What did the Virtual Cell predict? Target genes and evaluation shortcuts
On this page
- Abstract
- Introduction
- Cell representations and post-intervention prediction
- What target downregulation establishes
- Different problems should not all be called leakage
- A shortcut from removing only the query target
- Synthetic example
- Panel-wide and pairwise target removal
- What recent studies support
- A metric name does not specify evaluation conditions
- Conclusion
- Data and code availability
- References
Abstract
Predicting CRISPRi target downregulation and predicting other genes’ responses require separate evaluation. Published studies and public specifications were compared to examine retrieval metrics that handle the correct and competing targets asymmetrically. In a synthetic example with three perturbations and five genes, an output containing no downstream-response information scored 1.00 with a row mask but 0.50 with panel and pairwise masks. This demonstrates an evaluation shortcut, without establishing real-model rankings or the superiority of pairwise masking.
Literature checked on October 6, 2026. Reported research is distinguished from the synthetic calculations created for this article.
Introduction
A model predicts cells after a gene is suppressed and correctly predicts that gene's lower expression. Does that alone establish understanding of the cellular response?
Eric Kernfeld's December 2025 blog post (1) starts from this question to reconsider evaluation of Virtual Cell models, which computationally predict post-intervention responses. Here I read recent perturbation studies and evaluation specifications to determine what their conclusions support. The focus is CRISPRi transcriptional responses and retrieval of candidates from mean responses, rather than every aspect of Virtual Cell evaluation.
Cell representations and post-intervention prediction
Perturb-seq combines genetic intervention with single-cell RNA-seq to measure post-intervention transcriptional states. Extending predictions to untested targets or backgrounds could help choose experiments, one attraction of the Virtual Cell idea.
Single-cell foundation models (scFMs) pretrain on large cellular datasets and reuse representations across analyses. Geneformer reported transfer learning from transcriptional data; scFoundation reported large-scale pretraining and multiple downstream tasks. Good state representations and accurate expression prediction after unseen interventions nevertheless require separate validation (2, 3).
Evaluation first needs to define what remains unseen.
Table 1. Definitions of unseen conditions
| Intended prediction | Held out in testing | Not established by that result alone |
|---|---|---|
| A new target in the same cellular background | Perturbation target | Transfer to a new cell type |
| A known perturbation in another background | Cell type, line, donor or other context | Prediction for an unseen target |
| Combinations from single perturbations | Perturbation combination | Prediction of unseen single perturbations |
| Transfer of responses from another experiment | Dataset or experimental conditions | Prediction without any observed perturbation responses |
This is my organizational framework; each paper's actual split still needs checking. Wei and colleagues' broad benchmark likewise separates unseen perturbations and unseen backgrounds. It appeared online in December 2025 and in a 2026 volume (4).
Randomly splitting cells so that the same target and experiment appear on both sides does not test unseen-target generalization. Where possible, evaluation experiments should also be audited for overlap with pretraining. That differs from masking a target gene.
What target downregulation establishes
CRISPRi is designed to suppress target transcription. If that direct effect dominates, evaluation emphasizing strongly changed genes can reward a prediction that merely lowers the target.
Csendes and colleagues compared scGPT and scFoundation with simple references and also excluded CRISPR targets from Top-20 DE evaluation, the top 20 genes selected by differential-expression testing. With targets included, scGPT outperformed Train Mean, which supplies the same training-perturbation average to every test perturbation. But the target's own change contributes to that evaluation. The question is which genes account for the score improvement (5).
Wong and colleagues also report the importance of suitable simple baselines and corrections to existing benchmark data. I use only what was verifiable from their abstract (6).
Calling the target response nonbiological would go too far. Knockdown efficiency, residual expression and guide differences can themselves be legitimate prediction objectives. The distinction is predicting intervention efficacy versus predicting the response under that efficacy.
CRISPR knockout also does not equate loss of function with disappearance of mRNA. Setting measured expression uniformly to zero when mRNA can remain is a modeling assumption tied to a purpose, rather than an observation. The PEREGGRN paper notes that knockout mRNA can persist or increase (7).
Different problems should not all be called leakage
Let I be the intervention label, Z the post-intervention target expression, X other expression and c the cellular background. Predicting the full response from the label could target
\[ p(Z,X\mid I,c) \]
If achieved target suppression is already known and downstream prediction is wanted, the target becomes
\[ p(X\mid Z,I,c) \]
The latter conditions on more information.
Under PEREGGRN's closest-control setting, prediction replaces target expression with its measured post-intervention value. This illustrates conditioning on target change, but that measured value may not be available when prospectively predicting an unknown experiment (7).
Table 2. Distinct evaluation problems
| Problem | Consequence | What to inspect |
|---|---|---|
| Target direct effect dominates the score | High scores despite wrong downstream responses | Report scores with and without the target |
| Input availability mismatches intended use | An unknown measurement is supplied at prediction time | State what is assumed available beforehand |
| Training/evaluation contamination | The same experiment appears on both sides | Audit split units and pretraining data |
| Asymmetric target handling in retrieval | Only incorrect candidates retain their targets' direct effects | Inspect targets excluded from distances |
Supplying the target's name is normally a legitimate input, rather than leakage in perturbation prediction. When using “target-gene leakage,” specify whether the issue is unavailable input information or an evaluation shortcut.
A shortcut from removing only the query target
Retrieval evaluation matches a prediction to observed candidates and ranks the correct match. For perturbation i, prediction \(\hat x_i\) is compared with true \(x_i\) and other perturbations \(x_j\), rewarding a closer true match.
The problematic row mask removes only query target i from every comparison. Coordinates are shared within a query, yet correct and competing targets are treated asymmetrically:
\[ d_{-i}(\hat x_i,x_i),\qquad d_{-i}(\hat x_i,x_j). \]
Candidate j retains its strong decrease at target j. Artificially raising other targets in the prediction can push incorrect candidates farther away.
Arc's public specification reports pds_cosine values of 0.798, 0.757 and 0.761 for such shortcut predictions across three validation contexts, against baselines of 0.530, 0.528 and 0.510. These are Arc's reported results, not my recalculation from real data (8).
The competition brief dated August 19, 2026 defines pds_cosine using a fixed mask of all panel targets, so surviving coordinates do not depend on the candidate. This does not apply to all six metrics: the other five remove each perturbation's own target (9).
The document date should not be assumed to be an operational change date. A raw PDS reference of 0.5 also differs from zero on a competition score normalized with baseline and replicate controls.
Synthetic example
To test the scoring rule, I constructed three perturbations targeting A, B or C, with synthetic responses for downstream genes D and E. These synthetic changes relative to nontargeting control are not experimental data.
Table 3. Synthetic intervention effects
| Perturbation | A | B | C | D | E |
|---|---|---|---|---|---|
| Suppress A | −5 | 0 | 0 | 1 | 0 |
| Suppress B | 0 | −5 | 0 | 0 | 1 |
| Suppress C | 0 | 0 | −5 | −1 | −1 |
A shortcut-only prediction sets D and E to zero and other targets to +10. For A, that is \((0,10,10,0,0)\), containing no downstream-response information.
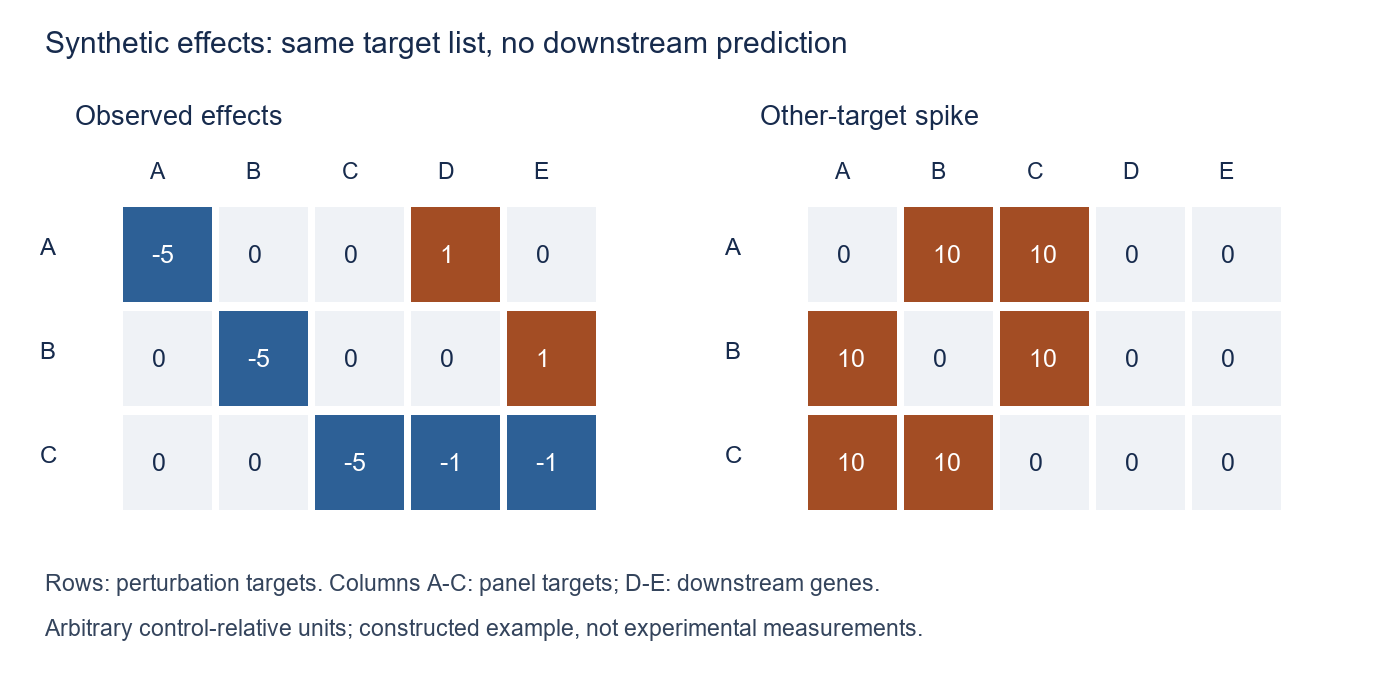
Figure 1. Author-created synthetic example. Blue is negative, brown positive and gray zero. Color indicates sign only; cell values show magnitude. Only other panel targets are raised, with no prediction of D or E. Units are arbitrary.
Calculation results
With cosine distance after removing A, the prediction's inner product with the true response is zero, giving distance one. Its inner product with the B response includes \(10\times(-5)\), giving a distance above one; C behaves similarly. The result appears to identify the truth by pushing wrong candidates away.
I compared row masking, panel masking of all targets, and pairwise masking of both targets for each comparison. Ties receive 0.5; zero-vector cosine distance is defined as one; distance differences within \(10^{-12}\) count as ties. For row and panel masking, mean pairwise wins correspond to a tie-adjusted normalized rank. This does not fully reproduce an old implementation's preprocessing or tie handling.
Table 4. Scores under different target masks
| Prediction | Row mask | Panel mask | Pairwise mask |
|---|---|---|---|
| Control unchanged: all effects zero | 0.50 | 0.50 | 0.50 |
| Raise other targets by +10 | 1.00 | 0.50 | 0.50 |
| Oracle providing only correct D and E | 1.00 | 1.00 | 1.00 |
| Oracle providing every correct gene | 1.00 | 1.00 | 1.00 |
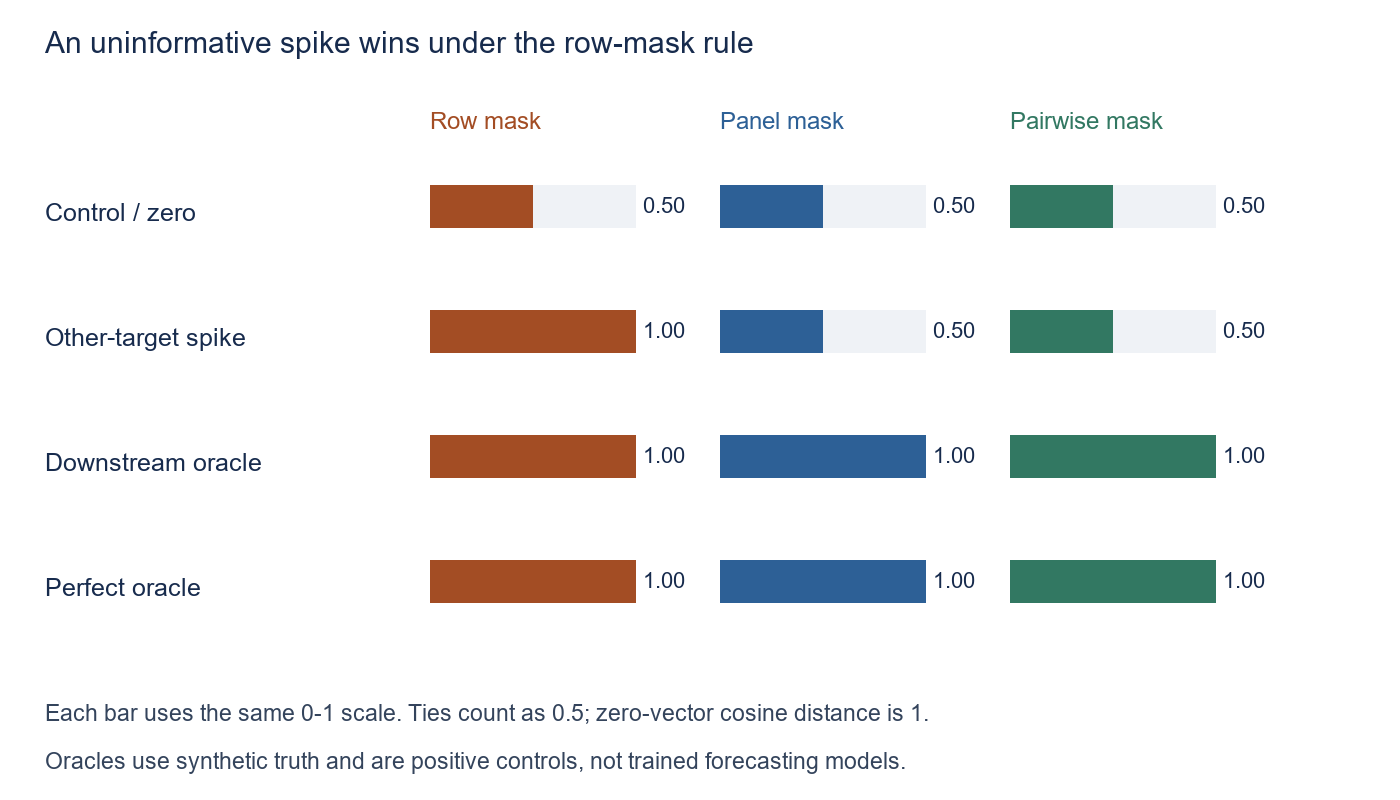
Figure 2. Synthetic calculation, averaged across three perturbations. Oracles use the true answers as positive controls; they are not trained predictors. All bars share a 0–1 scale.
The example establishes that outputs without downstream prediction can achieve perfect scores under a particular evaluation rule. It establishes neither actual model rankings, real-data effect sizes nor superiority of pairwise masking. Code, result CSV and a reproduction ZIP with inputs, dependencies and figures are available.
Panel-wide and pairwise target removal
Panel masking has the benefit of fixed coordinates. But if B responds when A is suppressed, that response also disappears whenever B is another panel target. Potentially relevant information is lost.
Kernfeld's appendix proposes removing both targets for each correct-versus-competing pair i,j. I add explicit tie handling:
\[ S_i=\frac{1}{N-1}\sum_{j\ne i} \left[ \mathbf 1\{a_{ij}<b_{ij}\} +\frac12\mathbf 1\{a_{ij}=b_{ij}\} \right], \]
\[ a_{ij}=d_{-(i,j)}(\hat x_i,x_i),\qquad b_{ij}=d_{-(i,j)}(\hat x_i,x_j). \]
This presentation and interpretation build on Kernfeld's original proposal (1). Each pair uses the same genes for both distances, then averages wins. That differs from ranking a single list of distances calculated using different coordinates for each candidate.
An AUC-like win fraction is an intuition, not equivalence to ordinary ROC-AUC or ranking by one fixed distance. Pair-dependent coordinates need not produce a common distance ordering across candidates.
Targets of other perturbations can remain in the comparison. That is not always beneficial: validation must consider retained direct effects, gene dependence, multitarget perturbations, weak responses and how masking changes vector norms in the cosine-distance calculation. Blocking the same spike in one toy example does not establish an optimal solution.
What recent studies support
Ahlmann-Eltze and colleagues found no deep-learning advantage over simple linear baselines in the gene-perturbation settings examined. Systema showed the need to distinguish shared systematic variation from perturbation-specific responses. Both motivate retaining simple references (10, 11).
Miller and colleagues in October 2026 assessed 18 metrics across 14 datasets by whether they distinguish positive and negative controls. Multiple deep models exceeded baselines on sensitive metrics. This checks a metric's ability to detect useful prediction, rather than calibration of predicted probabilities. The paper explicitly does not address unseen cellular backgrounds (12).
These views do not simply negate each other. All-gene mean error can dilute weak responses, while metrics restricted to strongly changing genes can emphasize direct target effects. Intended signal, positive-control sensitivity and susceptibility to shortcuts each require examination.
Recent models also solve different tasks.
Table 5. Recent studies and their evaluation targets
| Study or model | Principal reported capability | Relation to this article's concern |
|---|---|---|
| UCE, Nature 2026 | Shared representations across diverse cells | Embeddings alone do not validate unseen-intervention prediction |
| State, Cell 2026 | Context transfer with cellular heterogeneity | Population responses need evaluation beyond means |
| Stack, 2026 preprint | In-context learning with inference-time cellular prompts | Specify which conditions have already been observed as prompts |
| PIE, October 2026 preprint | Population-level perturbation effects informed by biological knowledge | Separate unseen target, unseen context and both unseen |
| Miller et al., Nature Biotechnology 2026 | Metric sensitivity and comparisons on unseen targets or combinations | Interpret scores together with metric properties |
Capability summaries draw on the UCE, State and Stack papers and the report by Miller and colleagues (13, 14, 15, 12). The last column is my interpretation. Stack is treated as a preprint in this review.
PIE was released on October 5, 2026. Its public README and announcement describe using knowledge sources, target-context controls and training-data perturbation responses. Predicting an unknown condition does not mean predicting with no observations at all. I describe only the design verifiable from public materials, without claiming detailed performance auditing or independent validation (16).
On the data side, Tahoe-100M in September 2026 reported a large drug-perturbation atlas spanning 50 cancer cell lines and 1,100 drug–dose conditions. Drug inhibition of a protein and CRISPRi suppression of its mRNA are different interventions; the target masking here does not automatically transfer to drug perturbations (17).
A 2026 preprint by Nicol and colleagues reports inflated correlations when the same estimated control is subtracted from predictions and observations, introducing shared estimation error (18). For intuition, suppose estimation errors \(\epsilon_p,\epsilon_t,\epsilon_c\) are independent. An algebraic illustration is
\[ \operatorname{Cov}(\epsilon_p-\epsilon_c,\epsilon_t-\epsilon_c) =\operatorname{Var}(\epsilon_c) \]
Subtracting a shared control introduces a common component even with independent prediction and observation errors. This does not assert independence for general cellular data. Target removal alone does not solve these other evaluation problems.
A metric name does not specify evaluation conditions
Target masks, gene sets, preprocessing and tie handling change a score's meaning even when its name is unchanged. In the toy example, target-only and shared predictions also receive different scores under different rules.
The scPertEval preprint separates evaluation into representation, metric, score transformation and reporting strategy. This makes clear why scores with different preprocessing and normalization cannot be compared by metric name alone (19).
My panel-versus-pairwise comparison is limited to equations and artificial examples. It neither validates real predictive performance or population distributions nor turns score differences into evidence of downstream mechanism understanding.
Conclusion
Kernfeld asks whether correctly predicting target downregulation supports understanding of downstream response. Arc's specifications additionally show that asymmetric target handling creates a real retrieval shortcut.
The synthetic example reproduces that mechanism. It does not establish that scFMs are useless or that pairwise masking solves evaluation.
Interpretation depends on what was known before prediction, what was held out, which responses were predicted and which controls were exceeded. Those conditions provide a common basis for discussing Virtual Cell progress and limits.
Data and code availability
Extract the reproduction ZIP and run the following from its directory with Python 3.11 or later. Tested NumPy and Pillow versions are pinned in its requirements.txt. Fonts can change figure appearance across environments without changing calculated values.
python -m pip install -r requirements.txt
python toy_metrics.py
This generates toy-results.csv, toy-data.json and Figures 1–2. Artificial mean effects for three perturbations and five genes are supplied directly. No real data were retrieved, no scFM trained, no single-cell distribution reproduced and no Arc competition pipeline rerun.
Checks cover two positive controls and baseline scores for 100 shared predictions. Pairwise masking is examined only through this example and mathematical properties; real-data comparative validation remains outstanding.
References
- Kernfeld E. We predict that the transcript abundance from the gene we are knocking down will (checks notes) decrease [Internet; blog]. 2025 Dec 5. Original post.
- Theodoris CV, Xiao L, Chopra A, Chaffin MD, Al Sayed ZR, Hill MC, et al. Transfer learning enables predictions in network biology. Nature. 2023;618(7965):616–624. doi:10.1038/s41586-023-06139-9.
- Hao M, Gong J, Zeng X, Liu C, Guo Y, Cheng X, et al. Large-scale foundation model on single-cell transcriptomics. Nature Methods. 2024;21(8):1481–1491. doi:10.1038/s41592-024-02305-7.
- Wei Z, Wang Y, Gao Y, Wang S, Li P, Si D, et al. Benchmarking algorithms for generalizable single-cell perturbation response prediction. Nature Methods. 2026;23(2):451–464. doi:10.1038/s41592-025-02980-0.
- Csendes G, Sanz G, Szalay KZ, Szalai B. Benchmarking foundation cell models for post-perturbation RNA-seq prediction. BMC Genomics. 2025;26:393. doi:10.1186/s12864-025-11600-2.
- Wong DR, Hill AS, Moccia R. Simple controls exceed best deep learning algorithms and reveal foundation model effectiveness for predicting genetic perturbations. Bioinformatics. 2025;41(6):btaf317. doi:10.1093/bioinformatics/btaf317. Only the abstract was consulted for the scientific claims discussed here.
- Kernfeld E, Yang Y, Weinstock JS, Battle A, Cahan P. A comparison of computational methods for expression forecasting. Genome Biology. 2025;26(1):388. doi:10.1186/s13059-025-03840-y.
- Arc Institute. cell-eval2 metrics reference [Internet; software documentation]. Commit 0ce25cf4c495e76e60dfca4ddc8f822507aa0e18. Pinned document.
- Arc Institute. VCC2026 metrics brief [Internet; software documentation]. Commit 0ce25cf4c495e76e60dfca4ddc8f822507aa0e18. Pinned document. Dated 2026 Aug 19; implementation 0.15.0, rule version 3.
- Ahlmann-Eltze C, Huber W, Anders S. Deep-learning-based gene perturbation effect prediction does not yet outperform simple linear baselines. Nature Methods. 2025;22(8):1657–1661. doi:10.1038/s41592-025-02772-6.
- Viñas Torné R, Wiatrak M, Piran Z, Fan S, Jiang L, Teichmann SA, et al. Systema: a framework for evaluating genetic perturbation response prediction beyond systematic variation. Nature Biotechnology. 2026;44(6):1050–1059. doi:10.1038/s41587-025-02777-8.
- Miller HE, Mejia GM, Leblanc FJA, Swain B, Wang B, de Lima Camillo LP. Deep learning perturbation models can outperform baselines on calibrated metrics. Nature Biotechnology. 2026 [published online 2026-10-01]. doi:10.1038/s41587-026-03307-w.
- Rosen Y, Roohani Y, Agrawal A, Samotorčan L, Tabula Sapiens Consortium, Quake SR, et al. Universal cell embedding provides a foundation model for cell biology. Nature. 2026;656(8126):183–191. doi:10.1038/s41586-026-10689-z.
- Adduri AK, Gautam D, Bevilacqua B, Naghipourfar M, Imran A, Shah R, et al. Predicting cellular responses to perturbation across diverse contexts with State. Cell. 2026;189(19):5914–5931.e20. doi:10.1016/j.cell.2026.07.052.
- Dong M, Adduri A, Gautam D, Carpenter C, Shah R, Ricci-Tam C, et al. Stack: In-Context Learning of Single-Cell Biology. bioRxiv [Preprint]. 2026. doi:10.64898/2026.01.09.698608.
- Verma R, Adduri A, Bevilacqua B, Eraslan B, Burke DP, Goodarzi H, et al. PIE: Generalizing perturbation effects across unseen perturbations, contexts and datasets. bioRxiv [Preprint]. 2026. doi:10.64898/2026.10.02.756297. Public implementation; author announcement. The announcement, public README and abstract were consulted; the full paper was not examined in detail.
- Zhang J, Ubas AA, Svensson V, Thomas N, Subramanyam V, Carpenter C, et al. Tahoe-100M: Mapping drug-induced molecular phenotypes at single-cell resolution. Cell. 2026;189(19):5945–5961.e8. doi:10.1016/j.cell.2026.08.035.
- Nicol PB, Shivakumar S, Irizarry RA. Spurious correlation inflates performance in single-cell perturbation prediction. bioRxiv [Preprint]. 2026. doi:10.64898/2026.05.07.723486.
- Schäfer PSL, Reid KA, Boldyga Z, Aksu ED, Hakem H, Saez-Rodriguez J. Towards Principled Evaluation of Single-Cell Perturbation Prediction Models. bioRxiv [Preprint]. 2026. doi:10.64898/2026.07.23.740433.