Sunvozertinib dose and dosing-frequency comparisons
On this page
Abstract
Dose–exposure relationships were estimated from public aggregate sunvozertinib PK, and a published PopPK model generated conditional comparisons in 4,096 virtual patients. Changing 200 mg QD to 100 mg BID preserved 24-hour AUC by model structure while lowering the median within-patient peak by 11.3%. Clinical response and diarrhea estimates came from different analysis populations and were not converted into an individual exposure–response model. Parent-drug fractionation predictions do not establish less diarrhea, maintained efficacy or an optimal regimen.
Literature checked on October 19, 2026. Aggregate measured PK supports dose–exposure estimation; virtual individuals depend on published PopPK parameters. No new individual-data NLME model was estimated.
Introduction
Sunvozertinib is an oral inhibitor for NSCLC with EGFR exon 20 insertions, granted US accelerated approval in July 2025 (1). A first-line phase III WU-KONG28 analysis was reported as a 2026 conference abstract (2). The clinical comparison here concerns mainly post-platinum WU-KONG1B, without pooling first-line patients.
Increasing dose and fractionating an unchanged daily amount alter exposure differently. Public evidence was used to determine which comparisons can be supported.
In 4,096 conditional virtual patients, changing 200 mg QD to 100 mg BID preserved 24-hour AUC and lowered the median paired peak by 11.3%. That does not predict a reduction in diarrhea or maintained efficacy. Aggregate-data estimates and published-model assumptions are distinguished.
Methods
Question and context of use
Table 1. Question, use and sources of parameters
| Item | Definition |
|---|---|
| QOI | How do AUC, peak and trough distributions change under 200, 250 and 300 mg QD and equal-daily-dose fractionation? Can these differences support clinical response/toxicity predictions? |
| COU | Research comparisons of exposure metrics and candidate regimens requiring verification, not treatment changes, optimal-dose selection or guarantees of BID efficacy/safety. |
| Newly estimated | Dose–exposure exponents and coefficients from aggregate measured PK; uncertainty in dose-group response and diarrhea probabilities. |
| Published inputs | PopPK structure, fixed effects and interindividual variability, rather than newly estimated individual PK or E–R. |
The approved reference is 200 mg once daily with food (1). BID extrapolates QD absorption, meal, formulation and relative-F assumptions to each dose. Meal timing, adherence and DZ0753 behavior were not validated. The 250 mg QD, 100 mg BID and 150 mg BID schedules are exploratory, not recommended regimens.
Public inputs
Table 2. Data and analytical roles
| Source | Information | Role |
|---|---|---|
| Wang et al. 2022, Supplementary Table S6 (3) | Geometric-mean AUC/Cmax, CV and n for five groups from 50–400 mg | Estimate parameters from aggregate measurements |
| FDA PopPK tables (4) | Apparent CL/volumes, absorption, presystemic metabolism and covariance | Parent-drug implementation and virtual individuals |
| WU-KONG1B dose comparison (4, 5) | Responses in randomized efficacy-evaluable groups | Dose-group response probabilities |
| FDA 120-day safety update, Table 62 (4) | Grade 3–4 diarrhea in all-treated 200/300 mg groups | Descriptive safety comparison |
Table S6 labels its values preliminary, unvalidated and subject to change. They are treated as early summaries, not independent clinical validation of the later model. Group-level backgrounds and overlap cannot be checked, so aggregate values were not used to estimate new interindividual variability.
Table 3. Early-study aggregate PK
| Daily dose, mg | n | AUCτ, ng·h/mL | Cmax, ng/mL |
|---|---|---|---|
| 50 | 5 | 1271 | 68.42 |
| 100 | 7 | 4371 | 252.1 |
| 200 | 9 | 6817 | 402.3 |
| 300 | 11 | 9131 | 521.4 |
| 400 | 10 | 16730 | 976.2 |
Values are geometric means at Cycle 2 Day 1. Sample sizes refer to each summary group; individual records were not obtained.
Aggregate-data estimation and results
Dose–exposure relationships
For AUC and Cmax separately, fit
\[ Y(D)=a\left(\frac{D}{200}\right)^b \]
\[ \log Y_g=\log a+b\log(D_g/200)+\epsilon_g \]
Dose proportionality corresponds to \(b=1\). CV supplies an approximate log-scale standard deviation and group-mean standard error:
\[ SE_g\simeq\sqrt{\frac{\log\{1+(CV_g/100)^2\}}{n_g}} \]
Weighted least squares uses assumptions about CV, lognormality and independent groups. The resulting intervals are not individual-patient predictive intervals.
Table 4. Power-model estimates
| Endpoint | Coefficient a at 200 mg | Exponent b | Approximate 95% interval for b |
|---|---|---|---|
| AUC | 6897.9 | 1.143 | 0.974–1.313 |
| CMAX | 397.5 | 1.144 | 0.963–1.326 |
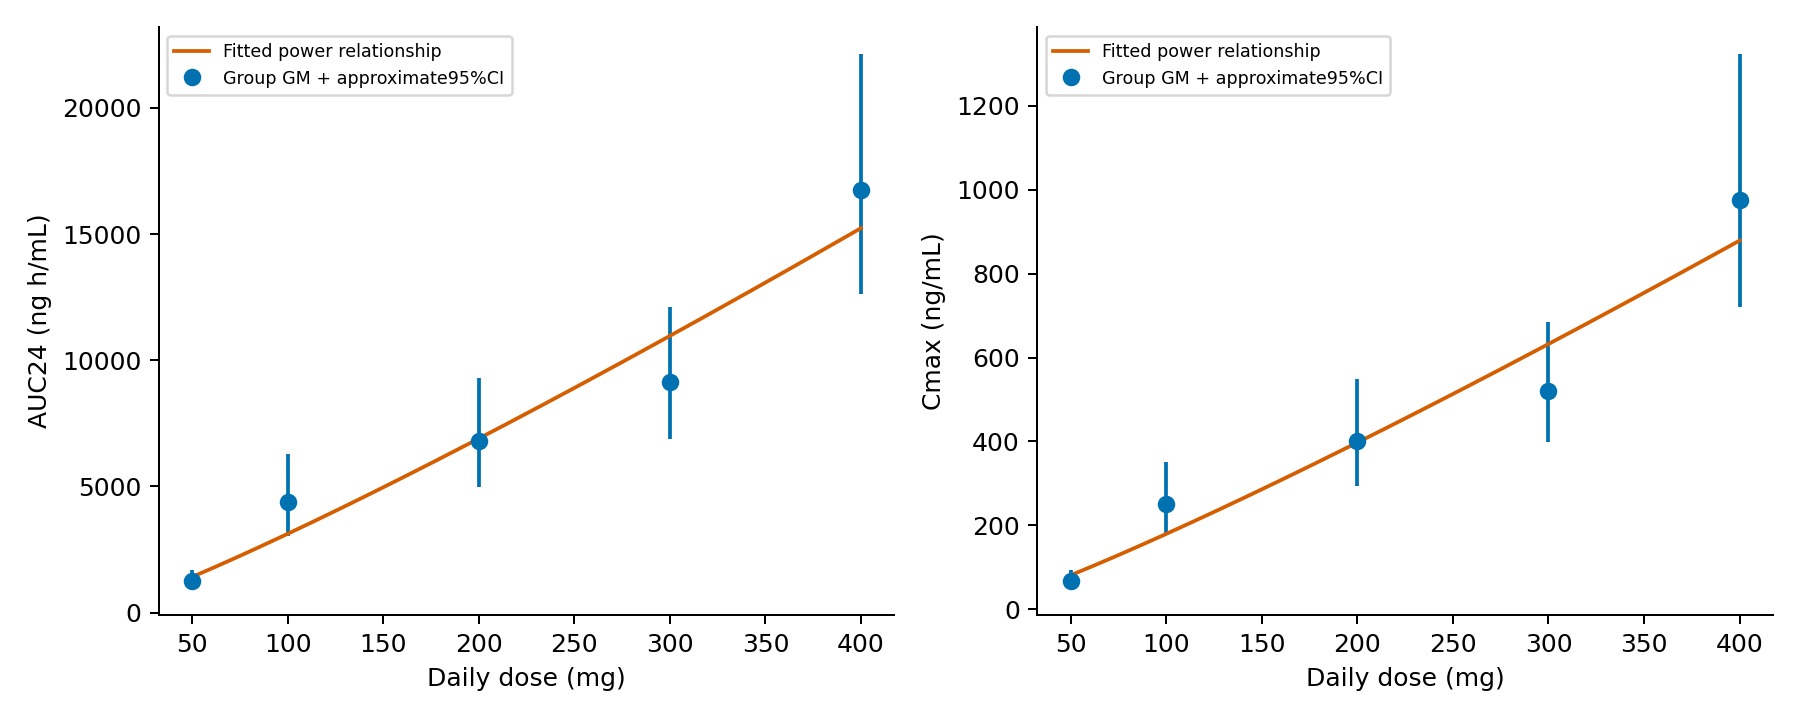
Figure 1. Aggregate PK and fitted power models. Error bars are approximate intervals derived from group CV and n.
Removing the 50 mg group changes exponents to 0.930 for AUC and 0.896 for Cmax, indicating substantial influence. Both main estimates exceed one but their intervals include one. This table neither rejects dose proportionality nor identifies a nonlinear mechanism. Coefficient a has AUC units ng·h/mL and Cmax units ng/mL.
Individual CL, volumes and absorption rates were not identified from these means. Instead, estimates assess compatibility of early summaries with the published dose-proportional assumption. Unweighted and leave-one-group-out fits are retained in CSVs.
Clinical populations and probabilities
Responses were 39/85 at 200 mg and 42/89 in the randomized 300 mg efficacy-evaluable group (4, 5). This differs from an ITT estimate using every randomized participant.
FDA's 120-day update reports grouped Grade 3–4 diarrhea TEAEs: 2/91 and 23/111. The 300 mg safety group includes 18 additional nonrandomized patients. These are not treatment-related events at another cutoff or a different severity definition. The diarrhea contrast is not treated as a randomized causal effect.
With Jeffreys priors for each dose-group probability,
\[ r_g\sim Binomial(n_g,p_g),\quad p_g\sim Beta(1/2,1/2) \]
\[ p_g\mid r_g,n_g\sim Beta(r_g+1/2,n_g-r_g+1/2) \]
This estimates group probabilities, not an individual E–R model using patient exposures.
Table 5. Dose-group posterior estimates
| Endpoint | Dose | Events/denominator | Posterior mean | 95% credible interval |
|---|---|---|---|---|
| ORR | 200 mg | 39/85 | 45.9% | 35.6–56.5% |
| ORR | 300 mg | 42/89 | 47.2% | 37.0–57.5% |
| Grade3-4 diarrhea | 200 mg | 2/91 | 2.7% | 0.5–6.9% |
| Grade3-4 diarrhea | 300 mg | 23/111 | 21.0% | 14.0–29.0% |
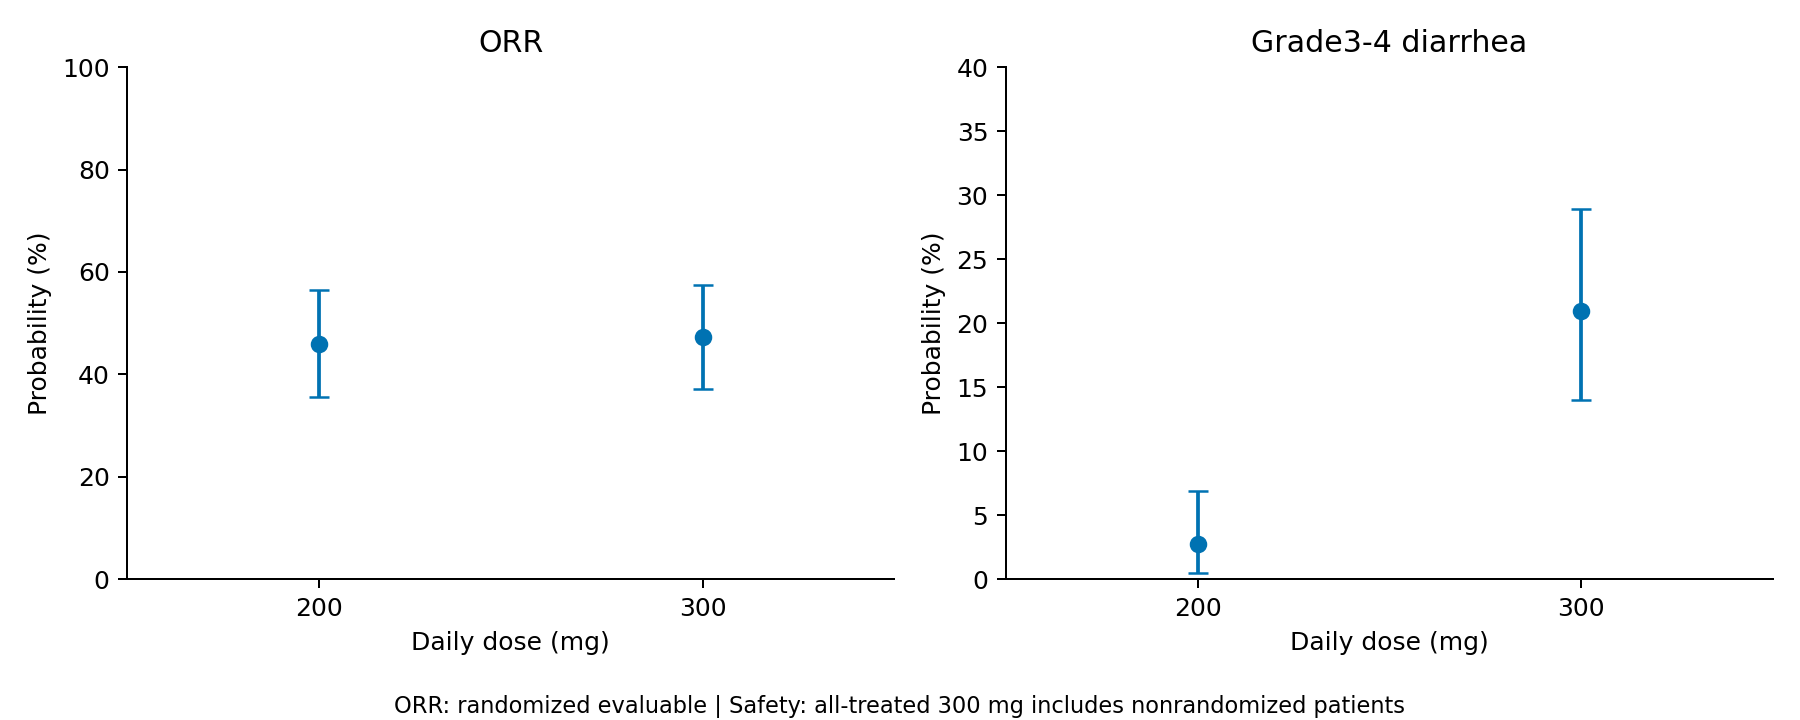
Figure 2. Separate clinical-group probabilities. Efficacy and safety populations differ; these are not joint benefit–risk probabilities in the same people. Vertical ranges differ between panels.
The 300-minus-200 mg response difference has posterior mean 1.3 percentage points and 95% credible interval −13.4 to 15.9. The descriptive diarrhea difference is 18.3 points, interval 10.3–26.7, without causal interpretation.
An interval spanning zero does not establish equivalence or noninferiority. Marginal group response and toxicity counts also cannot identify the probability of responding without an adverse event in the same individual.
Conditional comparison using published PopPK
The parent-drug portion of a parent/DZ0753 model was independently reconstructed from structural descriptions and parameter tables, without obtaining and fully reproducing original NONMEM code. With no metabolite-to-parent feedback, parent calculations can be separated. DZ0753 was not predicted, so parent exposure does not represent all pharmacological activity.
The main implementation interprets “two transit compartments” as two absorption states including the dosing destination. Branching follows the description of transfer from the second transit to metabolite.
With absorption amounts \(A_{T1},A_{T2}\) and central/peripheral amounts \(A_c,A_p\), time is in hours, amounts in µg and volumes in L; µg/L equals ng/mL.
\[ \dot A_{T1}=-k_aA_{T1},\qquad \dot A_{T2}=k_aA_{T1}-k_aA_{T2} \]
\[ \dot A_c=(1-f_{pre})k_aA_{T2}-CL\,C_c-Q(C_c-C_p) \]
\[ \dot A_p=Q(C_c-C_p),\quad C_c=A_c/V_c,\quad C_p=A_p/V_p \]
CL and volumes are apparent coefficients; absolute F was not independently identified. \(f_{pre}=0.125\) represents the presystemic branch to metabolite, not absolute bioavailability. Each dose enters \(A_{T1}\).
Table 6. Reference parent-drug parameters
| Parameter | Value |
|---|---|
| CL/F | 22.1 L/h |
| Central Vc/F | 954 L |
| Peripheral Vp/F | 569 L |
| Q/F | 15.0 L/h |
| ka | 1.53 h⁻¹ |
| Presystemic branch fpre | 0.125 |
Reference is a 65.7 kg cancer patient without healthy-volunteer factors. Weight and background joint distributions were not invented to reconstruct the trial population.
\[ \begin{pmatrix}\log CL_i\\\log V_{c,i}\\\log k_{a,i}\end{pmatrix} = \begin{pmatrix}\log22.1\\\log954\\\log1.53\end{pmatrix} +\boldsymbol\eta_i, \quad \boldsymbol\eta_i\sim N(0,\Omega) \]
\[ \Omega=\begin{pmatrix} 0.133&0.151&0\\ 0.151&0.324&0\\ 0&0&0.357 \end{pmatrix} \]
Published CL–Vc covariance is preserved; unreported covariance with ka is set to zero as a condition. Residual error is not added to true-exposure variability. A fixed seed creates 4,096 individuals with shared \(\eta_i\) across schedules. They are conditional virtual individuals, not resampled trial participants.
Common 24-hour exposure comparisons
Schedules are 200, 250 and 300 mg QD and 100 and 150 mg BID. Periodic steady state is solved directly by linear-system matrix exponentials for each individual. AUC uses a common 24 hours; peaks and troughs use each repeated dosing cycle. A 12-hour AUC is not compared directly with 24 hours.
Table 7. Conditional exposure distributions
| Schedule | Median AUC24 [5th–95th percentiles] | Median Cmax [5th–95th percentiles] | Median trough [5th–95th percentiles] |
|---|---|---|---|
| 200 QD | 7947 [4339–14142] | 410 [217–763] | 257 [138–471] |
| 250 QD | 9933 [5424–17678] | 513 [271–954] | 321 [173–589] |
| 300 QD | 11920 [6508–21213] | 616 [326–1145] | 385 [207–706] |
| 100 BID | 7947 [4339–14142] | 360 [194–651] | 296 [161–531] |
| 150 BID | 11920 [6508–21213] | 541 [291–976] | 444 [242–797] |
AUC units are ng·h/mL and concentration units ng/mL. These reflect variability conditional on fixed effects, not parameter uncertainty or clinical predictive intervals.
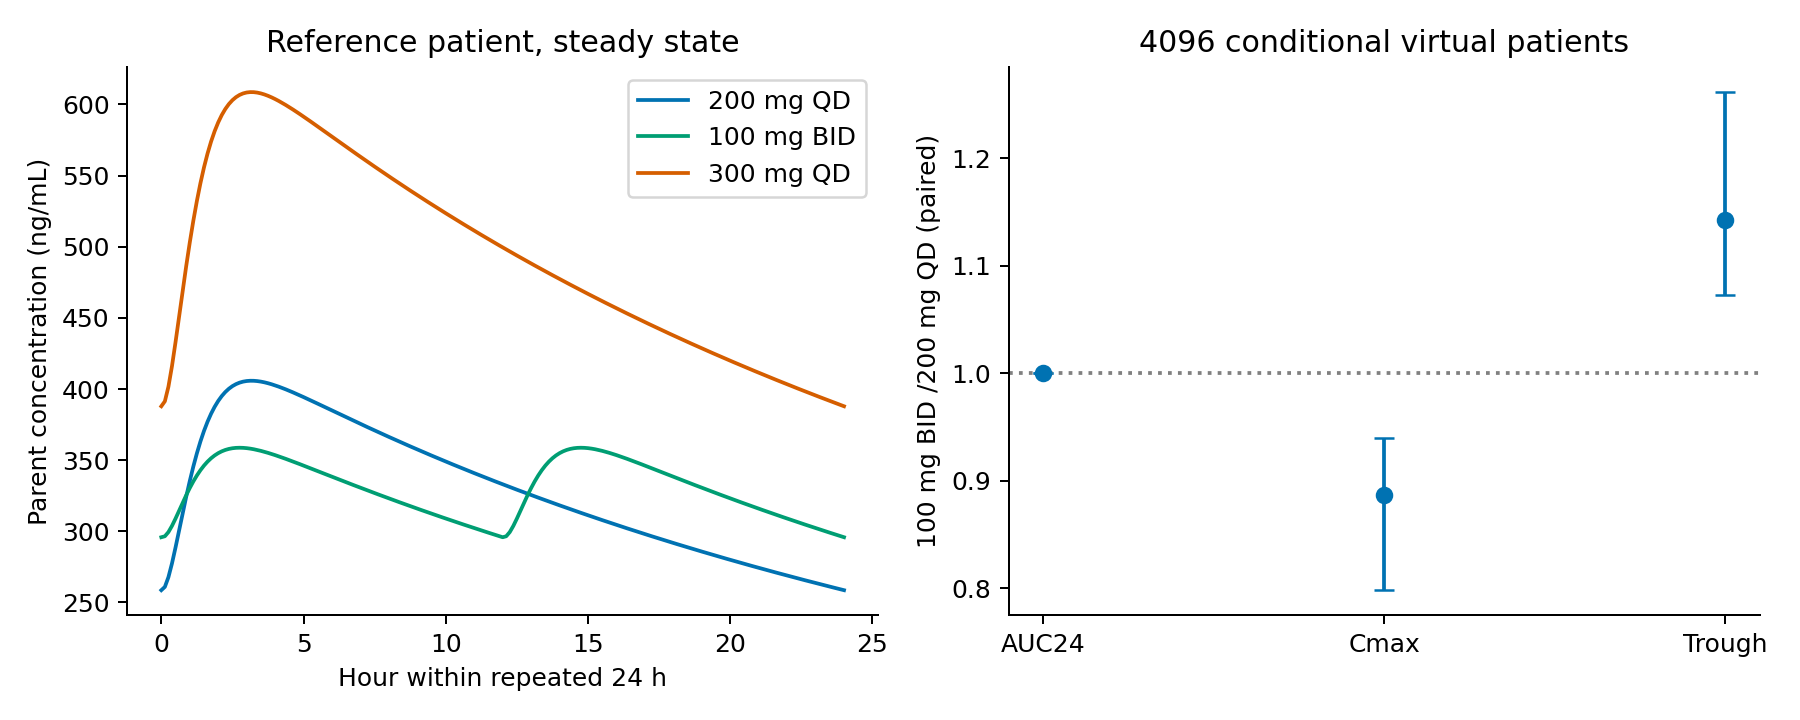
Figure 3. Conditional regimen comparisons. Paired-ratio ranges are 5th–95th percentiles across virtual individuals, not credible intervals for estimated parameters.
The paired Cmax ratio has median 0.887 and percentiles 0.798–0.940; the trough ratio has median 1.143 and percentiles 1.073–1.261. Fractions therefore differ between individuals. Under linearity, 250 and 300 mg QD multiply every metric from 200 mg QD by 1.25 and 1.50.
At steady state with linear elimination and an unchanged absorption branch,
\[ AUC_{24}=\frac{(1-f_{pre})\,Dose_{day}}{CL/F} \]
Equal daily doses therefore imply equal AUC structurally. The informative questions concern paired changes in peaks/troughs and whether those changes connect to clinical endpoints.
Fixed effects were also varied individually to published 95% CI bounds. Without joint covariance-based sampling, these ranges are not 95% predictive intervals. Paired peak ratios were 0.878–0.890 and trough ratios 1.136–1.152.
A structural control distinguished a dosing depot plus two transit states. One variant retained ka; the other multiplied it by 1.5 to preserve mean absorption time. These unestimated controls examine interpretation of a public description, not validated bounds.
Table 8. Alternative absorption-state controls
| Structural control | Median paired peak ratio | 5th–95th percentiles |
|---|---|---|
| 3steps_same_ka | 0.890 | 0.801–0.942 |
| 3steps_same_mean_absorption | 0.883 | 0.794–0.937 |
Both use the same η for 4,096 individuals. Until absorption structure and ka correspondence are established, these ratios are not exact reproductions of the original model.
Table 9. Absolute exposure scale comparison
| Dose | Reconstructed reference AUC24 | Early-study geometric-mean AUCτ | Simple ratio |
|---|---|---|---|
| 200 mg | 7919 | 6817 | 1.16 |
| 300 mg | 11878 | 9131 | 1.30 |
Units are ng·h/mL. Fixed-weight reference predictions and different early-study group means are unmatched; their ratio is not prediction error or external validation. Absolute values differ, and clinical qualification of the original model is not claimed.
Numerical checks
Matrix-exponential and independent ODE AUCs differed relatively by 4e-12; maximum periodic-state error was 1.4e-09 µg. Refining peak sampling gave relative difference 2.9e-05 at reference. Among 48 conditions selected from virtual absorption-rate and other extremes, maximum grid difference was 0.00067. Nine tests covered mass balance, equal-dose AUC, linearity, positive-definite covariance, random reproducibility and recovery of a known exponent.
These check the independent numerical implementation, not original-code reproduction or clinical validity.
Discussion
FDA's efficacy E–R analysis detected no significant time-average-exposure/ORR relationship over 200–300 mg QD. That does not guarantee unchanged efficacy under an untested regimen. Safety endpoints use AUC or average exposure depending on the event; a Cmax reduction cannot be substituted directly for a diarrhea-risk reduction (4).
Group ORR and diarrhea rates were not regressed on group-mean AUC to create an individual E–R model. Group-level relationships need not represent individual exposure–response, and two doses cannot adequately test curve shape.
The calculations predict parent-drug exposure under fractionation. They do not optimize toxicity, efficacy and adherence burden jointly. If AUC is the relevant adverse-event correlate, preserving AUC alone supplies no evidence of reduced risk. Higher parent troughs, unpredicted DZ0753, first-line efficacy and CNS efficacy also remain unresolved.
Conclusion
Conditional simulations quantify how fractionation changes parent-drug peaks and troughs while preserving AUC by model structure. Aggregate clinical counts do not identify an individual E–R relationship linking those changes to benefit or harm. Clinical advantages of BID dosing were not demonstrated.
Data and code availability
analysis/run_analysis.py regenerates inputs and outputs. Aggregate-PK estimates are in outputs/fit.json, group probabilities in clinical-estimates.csv, and exposure/paired ratios in virtual-exposure.csv and paired-ratios.csv. Original papers, figures and patient records are not redistributed.
Analysis code, aggregate inputs, results and instructions
References
- US Food and Drug Administration. FDA grants accelerated approval to sunvozertinib for metastatic non-small cell lung cancer with EGFR exon 20 insertion mutations [Internet]. 2025 Jul 2. Approval announcement.
- Heymach JV, Liu G, Xing L, Greillier L, Thomas J, Yazici O, et al. Sunvozertinib monotherapy versus platinum-based chemotherapy as first-line treatment for advanced NSCLC with EGFR exon20ins: Primary analysis of a multinational phase 3 randomized study (WU-KONG28) [Conference abstract]. Journal of Clinical Oncology. 2026;44(17_suppl):LBA8500. doi:10.1200/JCO.2026.44.17_suppl.LBA8500.
- Wang M, Yang JCH, Mitchell PL, Fang J, Camidge DR, Nian W, et al. Sunvozertinib, a Selective EGFR Inhibitor for Previously Treated Non–Small Cell Lung Cancer with EGFR Exon 20 Insertion Mutations. Cancer Discovery. 2022;12(7):1676–1689. doi:10.1158/2159-8290.CD-21-1615.
- US Food and Drug Administration. Sunvozertinib: NDA 219839 multidisciplinary review. 2025. PopPK tables, PDF pp. 229–230; safety Table 62, PDF p. 180; Section 19.4. Assessment report.
- Yang JCH, Wang M, Doucet L, Fan Y, Lv D, Sun M, et al. Phase II Dose-Randomized Study of Sunvozertinib in Platinum-Pretreated Non–Small Cell Lung Cancer With Epidermal Growth Factor Receptor Exon 20 Insertion Mutations (WU-KONG1B). Journal of Clinical Oncology. 2025;43(29):3198–3208. doi:10.1200/JCO-25-00788.