Inavolisib renal dosing: AUC, peaks and troughs
Published inavolisib PK separates renal dose adjustment, AUC matching and concentration shape without predicting clinical benefit.
On this page
- Background and question
- Population model and dedicated study
- Implementing the three-compartment model
- Relative apparent clearance from the dedicated study
- Dose adjustment does not align every concentration measure
- Splitting the same 6 mg daily dose
- Lower peaks do not establish less hyperglycemia
- Concentration differences remain after AUC adjustment
- Data and code availability
- References
Inavolisib starting doses are reduced for renal impairment. Does bringing AUC closer to a reference also bring peak and predose concentrations closer?
Calculations using public population PK and renal-impairment results showed different changes in AUC, peak and trough. Splitting an equal daily dose likewise preserved AUC while moving peak and trough in opposite directions. Converting these concentration differences into less hyperglycemia or preserved efficacy requires evidence beyond this calculation.
Background and question
Inavolisib inhibits PI3Kα and promotes degradation of mutant p110α. Overall survival from INAVO120, combining inavolisib with palbociclib and fulvestrant in PIK3CA-mutated HR-positive/HER2-negative advanced breast cancer, was reported in 2025. This article does not reanalyze that clinical effect; it organizes renal-function-dependent exposure using public information (1).
The US prescribing information checked here was revised in April 2026. It specifies 9 mg once daily ordinarily, 6 mg once daily for moderate renal impairment and 3 mg once daily for severe impairment. Categories use CKD-EPI eGFR: moderate, ≥30 to <60 mL/min; severe, <30 mL/min. Severe-impairment instructions were updated after the original 2024 review, so the older statement that it was unstudied is not used as a current description (2, 3).
The question is how far AUC, peak and trough align after renal dose adjustment, and what changes when an equal daily dose is divided. This is a research comparison of public PK conditions, not a method for selecting an individual's dose or a clinical-trial dose.
Population model and dedicated study
Two sources play different roles. The existing population PK model uses 336 participants and 3,863 observations. It has three compartments, first-order absorption and linear elimination. Renal function affects CL/F; weight and race affect Vc/F; formulation affects absorption rate. I reused estimated coefficients rather than acquiring and refitting individual concentrations (4).
The dedicated GP44944 study administered a single 6 mg dose to seven participants with moderate impairment, eight with severe impairment and 11 with normal renal function: 26 in total. Impaired groups were compared with matched normal controls. The controls in the two comparisons are not treated as independent populations (5).
Table 1. Dedicated renal-impairment study summary (5).
| Comparison | AUC₀–∞ geometric mean ratio (90% CI) | Cmax geometric mean ratio (90% CI) |
|---|---|---|
| Moderate / normal | 1.73 (1.49–2.02) | 1.11 (0.992–1.25) |
| Severe / normal | 2.23 (1.59–3.12) | 1.33 (0.914–1.92) |
Peaks increased less than AUC. A single multiplier applied to the entire concentration profile would miss this distinction.
The earlier model used MDRD eGFR as a continuous covariate, observed over 41.8–218 mL/min. The dedicated study used the 2021 CKD-EPI equation, while categorical impairment summaries in the old data used CrCL. I did not mix these measures by inserting hypothetical eGFR values such as 45 or 20 as study-group means. Public information did not establish those group means (6, Tables 46–48, pp. 197–199).
Implementing the three-compartment model
Let \(A_g\) denote the absorption compartment and \(A_c,A_{p1},A_{p2}\) the central and two peripheral amounts:
\[ \begin{aligned} \dot A_g&=-k_aA_g,\\ \dot A_c&=k_aA_g-\frac{CL+Q_1+Q_2}{V_c}A_c +\frac{Q_1}{V_{p1}}A_{p1}+\frac{Q_2}{V_{p2}}A_{p2},\\ \dot A_{p1}&=\frac{Q_1}{V_c}A_c-\frac{Q_1}{V_{p1}}A_{p1},\\ \dot A_{p2}&=\frac{Q_2}{V_c}A_c-\frac{Q_2}{V_{p2}}A_{p2},\\ C(t)&=1000\,A_c(t)/V_c. \end{aligned} \]
At dosing, the dose in mg is added to \(A_g\). Amounts are in mg, time in hours and volumes in L; the final factor of 1,000 converts concentration to ng/mL. Clearances and volumes below are apparent oral parameters. Absolute bioavailability of 0.76 is not multiplied into the dose again.
Table 2. Reused population PK coefficients (4, 6).
| Coefficient | Value |
|---|---|
| CL/F | 8.83 L/h |
| Vc/F, Vp1/F, Vp2/F | 155, 68.1, 31.4 L |
| Q1/F, Q2/F | 7.50, 0.142 L/h |
| ka, phase III formulation | 0.917 h⁻¹ |
| Renal effect on CL | (MDRD eGFR / 86)^0.441 |
| Interindividual variances of log(CL), log(Vc), log(ka), log(Vp1) | 0.0822, 0.0671, 0.632, 1.85 |
| Covariance of log(CL) and log(Vc) | 0.0608 |
Inputs come from FDA Table 48 and EMA Table 6. Weight is fixed at 65 kg, with the non-Asian reference condition and phase III formulation. Other covariances are zero. This is not a reconstruction of the patient population's demographics. Reference MDRD eGFR 86 is not the dedicated study's normal-group mean.
For a linear model with dosing interval \(\tau\), system matrix \(K\) and dosing vector \(bD\), the steady-state state immediately after dosing is:
\[ x_{ss}(0^+)=(I-e^{K\tau})^{-1}bD \]
I calculated one dosing interval from this expression rather than repeatedly simulating a long period with small time steps.
At the reference 9 mg every 24 hours, typical AUC was 1,019 h·ng/mL and Cmax 66.46 ng/mL. The current US label reports population geometric means of 1,010 h·ng/mL and 69 ng/mL, respectively (2, §12.3). Their similar magnitudes do not establish completed external validation: a fixed-reference typical value and a population geometric mean are different quantities.
Relative apparent clearance from the dedicated study
At equal doses under linear PK, \(AUC=D/(CL/F)\). If \(R\) denotes the dedicated study's AUC ratio, assigning the entire renal effect to CL/F while holding absorption and distribution constant gives:
\[ \frac{(CL/F)_{RI}}{(CL/F)_{N}}=\frac{1}{R} \]
Relative CL/F is 0.578 (0.495–0.671) for moderate impairment and 0.448 (0.321–0.629) for severe impairment. Parentheses invert the reported AUC-ratio 90% CIs; they do not represent interindividual variability.
Only CL/F was changed by these ratios. This is a conditional renal model calibrated to AUC, not a newly identified population PK or PBPK model of physiological, absorption and distribution changes. I did not apply the old eGFR power correction a second time.
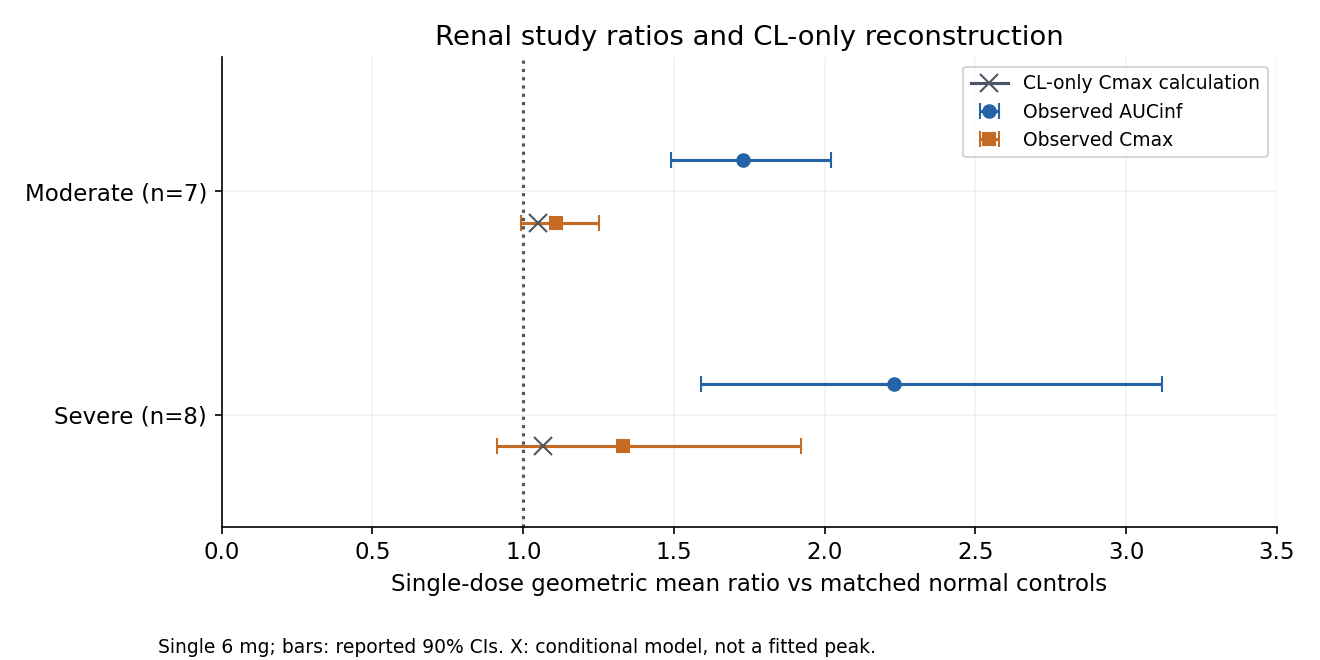
Figure 1. Points and intervals are dedicated-study summaries and 90% CIs; crosses are typical Cmax ratios from a model calibrated only to AUC. Predicted ratios are 1.048 for moderate and 1.065 for severe impairment. Both fall within the reported CIs despite differing from their point estimates. Comparing conditional typical values with adjusted population ratios does not prove unchanged absorption or distribution. No additional parameter was fitted to Cmax.
Dose adjustment does not align every concentration measure
I generated 4,096 random-effect vectors from the published variances and covariances and reused each vector across conditions. This paired simulation aligns assumed PK variability rather than matching actual patients. It assumes the same variability structure in renal impairment and excludes residual error, changing renal function and missed doses.
The comparison is reference 9 mg QD, moderate impairment 6 mg QD and severe impairment 3 mg QD. Transferring single-dose ratios to repeated dosing assumes linearity and a time-invariant renal effect. Although 3 mg is the current severe-impairment dose, the label's stated dose-proportionality range is 6–12 mg; linearity at the lower dose remains an assumption here.
Table 3. Exposure in conditional virtual populations after dose adjustment; intervals are not confidence intervals.
| Condition | Median AUC₂₄ [5th–95th percentile], h·ng/mL | Cmax, ng/mL | Cmin, ng/mL |
|---|---|---|---|
| Reference 9 mg QD | 1,015 [632–1,623] | 65.3 [40.6–103.3] | 24.4 [13.3–43.7] |
| Moderate 6 mg QD | 1,171 [729–1,872] | 63.7 [40.1–100.2] | 35.5 [20.9–60.3] |
| Severe 3 mg QD | 755 [470–1,207] | 38.8 [24.5–61.1] | 24.7 [14.8–41.1] |
All intervals are conditional virtual-population percentiles. Individual records, joint background-factor distributions and renal-group model validity have not been reconstructed.
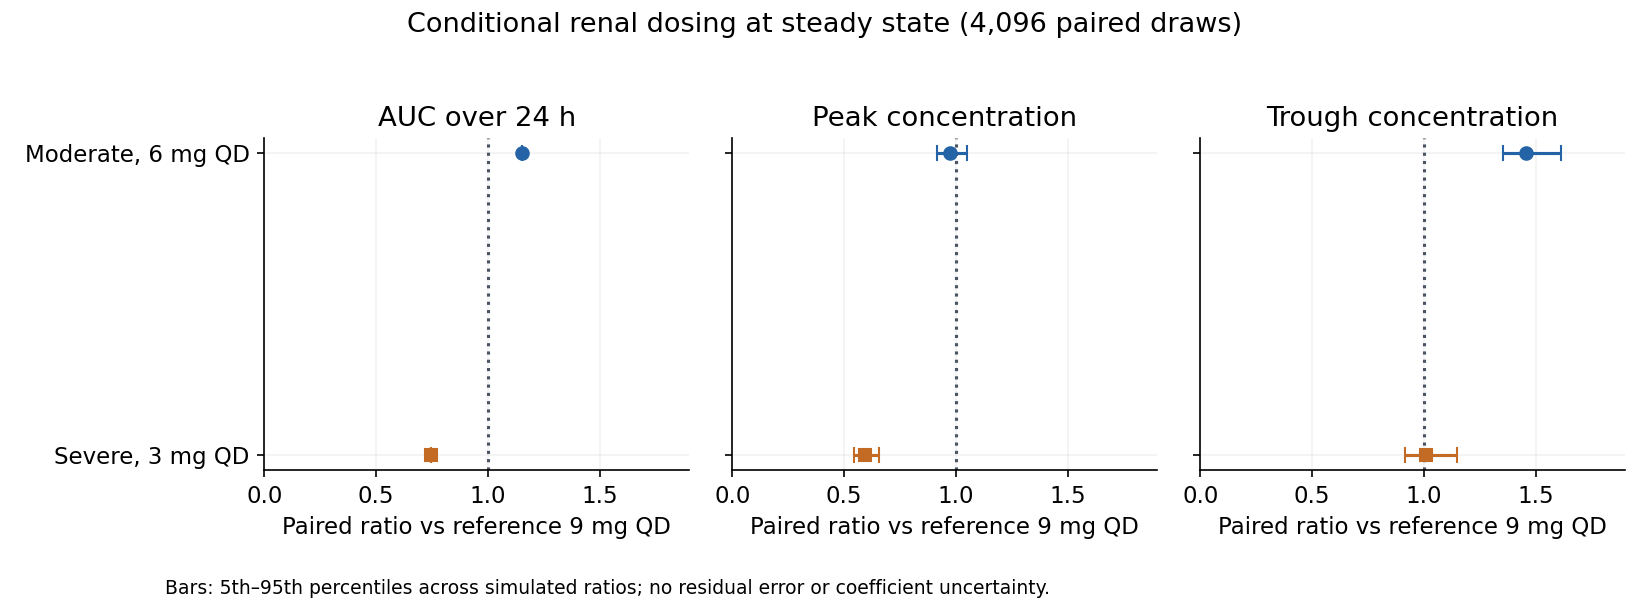
Figure 2. Ratios to reference 9 mg QD with identical random effects. AUC ratios are 1.153 for moderate and 0.743 for severe impairment. Sharing the individual CL random effect cancels its contribution to AUC-ratio variability algebraically. Narrow intervals do not imply little clinical uncertainty.
At severe-impairment 3 mg, AUC was lower than reference while the paired median trough ratio was 1.009. At moderate-impairment 6 mg, peak was 0.973 times reference but trough was 1.458 times reference. Slower concentration decline with reduced CL means total exposure and predose concentration do not change proportionally.
Dedicated-study estimation uncertainty is shown separately. The dose-adjusted AUC ratio is simply \(R\times D/9\).
Table 4. Single-dose AUC ratios and 90% CIs transformed for dose adjustment.
| Condition | Dose-adjusted AUC ratio | Transformed reported GMR 90% CI |
|---|---|---|
| Moderate 6 mg / reference 9 mg | 1.153 | 0.993–1.347 |
| Severe 3 mg / reference 9 mg | 0.743 | 0.530–1.040 |
These intervals linearly extrapolate single-dose findings to steady state, without uncertainty in that extrapolation. The severe-group point estimate does not establish underdosing. AUC matching has not been justified as a clinical target here, and no effective-exposure threshold was defined.
Splitting the same 6 mg daily dose
In the conditional moderate-impairment model, I compared 6 mg every 24 hours with a hypothetical 3 mg every 12 hours. The latter is not an approved regimen; it isolates dosing-frequency effects.
Steady-state daily AUC is:
\[ AUC_{24,ss}=1000\,\frac{24D}{\tau(CL/F)} \]
With D in mg, CL/F in L/h and τ in hours, AUC₂₄ is in h·ng/mL. Linear PK gives identical AUC for the two schedules, but different peaks and troughs.
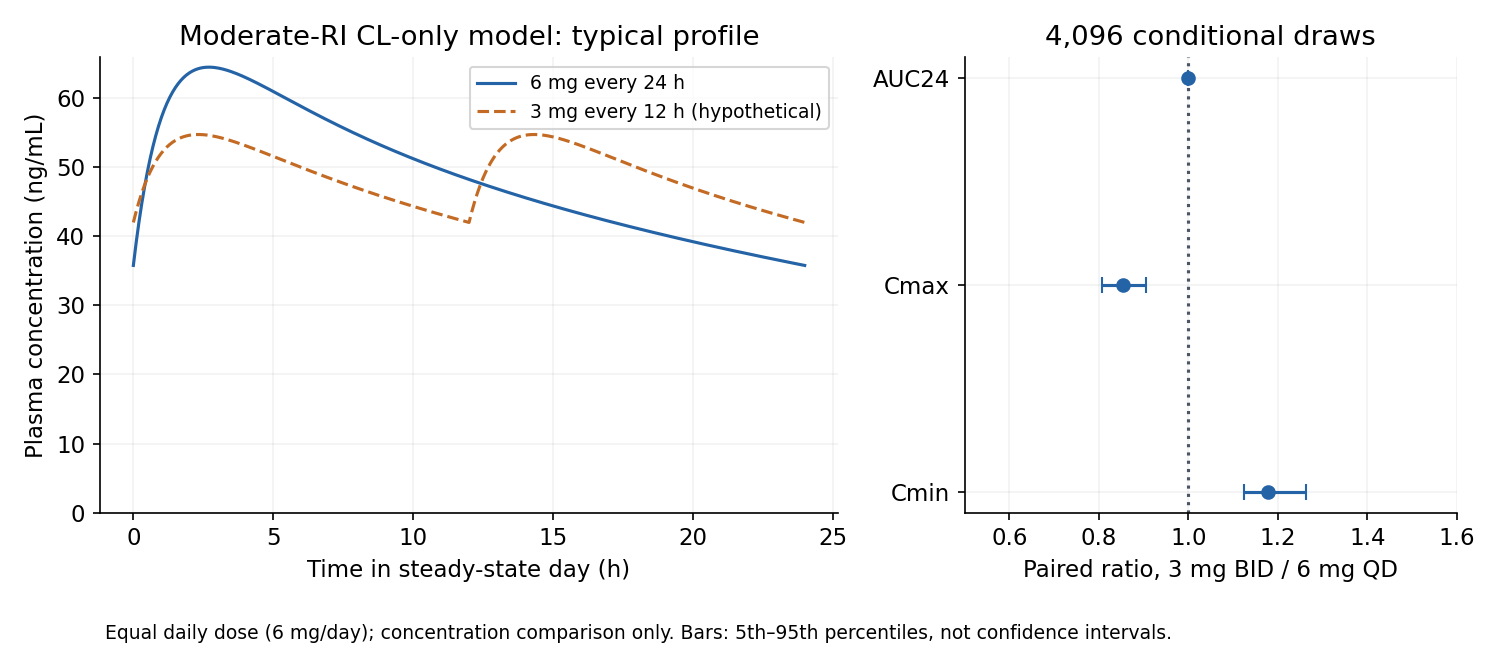
Figure 3. Left: typical concentration profiles. Right: ratios for 3 mg BID / 6 mg QD across 4,096 paired simulations. BID assumes strict 12-hour intervals; practical adherence was not evaluated.
Table 5. Equal-daily-dose comparison in the conditional moderate-impairment model.
| Metric | Median 3 mg BID / 6 mg QD [5th–95th percentile] |
|---|---|
| AUC₂₄ | 1.000 [1.000–1.000] |
| Cmax | 0.854 [0.807–0.906] |
| Cmin | 1.178 [1.124–1.264] |
Median peak fell by about 15% and trough rose by about 18%. Substituting the two limits of the renal AUC-ratio 90% CI gave median peak ratios of 0.835–0.871. This is renal-effect sensitivity, not a confidence interval for BID clinical effects. Distributed tables also vary the published CL 95% CI alone and the old eGFR power coefficient. Without coefficient covariance these are not full-parameter prediction intervals.
Lower peaks do not establish less hyperglycemia
The public review reports an exposure association with grade ≥2 hyperglycemia in phase I GO39374 across a broad dose range. The association was not confirmed in phase III WO41554 at 9 mg. Exposure range, baseline glucose/HbA1c eligibility and adverse-event management differed. The 2026 INAVO120 safety analysis also discusses baseline glycemic status and early hyperglycemia management (6, pp. 211–214; 7).
The reviewed documents do not provide the full final hyperglycemia equation with regression coefficients and covariates; they refer to tables in another report. I did not digitize unadjusted curves to calculate a BID event rate.
Data in which QD Cmax and AUC are correlated do not readily separate their contributions to hyperglycemia. BID changes that relationship. Lower peak accompanies higher trough, so improved safety without loss of exposure does not follow. These simulations concern steady state, not first-week exposure or glucose trajectories, event timing, glucose-recovery time constants or duration of intratumoral action.
Concentration differences remain after AUC adjustment
Closer AUC does not guarantee closer peaks or troughs. Splitting an equal daily dose moves them in opposite directions, and the available data do not identify a relationship converting this difference into less hyperglycemia or retained efficacy.
The severe-impairment 3 mg calculation transfers non-dialysis dedicated-study aggregate ratios into a cancer-population PK model whose original data excluded severe impairment. It does not represent dialysis, abrupt renal changes or changed absorption and distribution, and cannot replace approved dosing recommendations.
Data and code availability
Calculations are in analysis/run_analysis.py; numerical results are in outputs/results.json and outputs/tables/. The random seed is 20261021, with 4,096 paired vectors. Coefficients are reused and relative CL/F is transformed from aggregate AUC ratios, without individual-level NLME estimation. Matrix solutions were compared with independent ODE calculations and numerical integration; checks covered dose proportionality, steady-state AUC and equal daily dosing. The package excludes original-document images and paper text.
Sources checked on October 21, 2026.
Code, inputs, summary tables and rerun instructions
References
- Jhaveri KL, Im SA, Saura C, Loibl S, Kalinsky K, Schmid P, et al. Overall Survival with Inavolisib in PIK3CA-Mutated Advanced Breast Cancer. New England Journal of Medicine. 2025;393(2):151–161. doi:10.1056/NEJMoa2501796.
- Genentech. ITOVEBI (inavolisib) US prescribing information. Revised 2026 Apr. Sections 2.3, 2.5 and 12.3. Prescribing information.
- US Food and Drug Administration. Supplemental approval letter for NDA 219249, supplement 004. 2026. Approval letter.
- European Medicines Agency. Itovebi: public assessment report. 2025. Table 6; pp. 32–33. Assessment report.
- Sutaria D, Huang W, Clark T, Yang T, Shankar N, Stout T, et al. Evaluating the effect of moderate & severe renal impairment on the pharmacokinetics & safety of inavolisib [poster 108]. In: 2025 CPDD Abstract Booklet. Clinical Pharmacology in Drug Development. 2025;14(S1):1–140. doi:10.1002/cpdd.1588.
- US Food and Drug Administration. Inavolisib: multidisciplinary review, NDA 219249. 2024. Tables 46–48; pp. 197–199, 211–214. Review report.
- Im SA, Kalinsky K, Jhaveri KL, Loibl S, Turner N, Saura C, et al. Safety analyses of the INAVO120 randomised phase III trial of inavolisib or placebo with palbociclib–fulvestrant in patients with PIK3CA-mutated, hormone receptor-positive, HER2-negative, endocrine-resistant advanced breast cancer. ESMO Open. 2026;11(6):107735. doi:10.1016/j.esmoop.2026.107735.