Daraxonrasib dose fractionation: opposing exposure metrics
Published daraxonrasib coefficients show opposing peak and minimum-concentration changes after fractionation, with conditional rather than validated safety projections.
On this page
- Question and scope
- Published inputs
- Model and reconstruction assumptions
- Absolute exposure does not fully match the label
- Fractionation lowers peaks and raises minima
- Safety associations point in different directions
- Separate sources of uncertainty
- Safety interpretation depends on the endpoint
- Data and code availability
- References
Daraxonrasib (RMC-6236) is a RAS(ON) multi-selective inhibitor targeting active RAS. Its August 2026 US approval brings RAS inhibition in pancreatic cancer beyond development-stage discussion. The approved dose is 300 mg once daily. What changes if the same daily amount is divided into two 150 mg doses (1)?
Fractionation can reduce peaks without necessarily improving safety. In FDA analyses, grade 3 or higher treatment-emergent adverse events (TEAEs) are positively associated with minimum concentration, whereas grade 3 or higher treatment-related adverse events (TRAEs) are positively associated with maximum concentration. Moving those metrics in opposite directions creates competing interpretations.
Using published population-PK coefficients, I simulated 4,096 virtual individuals at fixed reference covariates and evaluated every regimen in each individual to compare dose reduction with daily-dose-preserving fractionation. Relative to 300 mg once daily, 150 mg every 12 hours gives median within-person ratios of approximately 0.77 for maximum concentration and 1.49 for minimum concentration. This is an exposure tradeoff, not a prediction of improved safety.
Question and scope
The question concerns changes in whole-blood peak, minimum and average exposure when 300 mg/day is divided, and how far published safety exposure–response associations can interpret those changes. This public-information calculation is a research and educational comparison, not a basis for treatment changes or clinical dose selection. Published coefficients are reused without fitting a new nonlinear mixed-effects model to individual data.
Table 1. Hypothetical regimens compared.
| Regimen | 0 h | 12 h | Daily dose | Interpretation |
|---|---|---|---|---|
| 300QD | 300 mg | — | 300 mg | Approved reference |
| 150BID | 150 mg | 150 mg | 300 mg | Equal split preserving 1-day dose |
| 200QD | 200 mg | — | 200 mg | 1-day dose reduction |
| 100BID | 100 mg | 100 mg | 200 mg | Reduction plus fractionation |
| 200+100 | 200 mg | 100 mg | 300 mg | Unequal split preserving 1-day dose |
QD means once daily and BID twice daily. Divided regimens are hypothetical, not validated alternatives. Adherence, food and concomitant medicines are held constant across conditions.
Published inputs
The main source is FDA’s NDA 220910 review (2). Population PK uses 720 participants and 8,527 observations. The safety exposure–response PK-evaluable population contains 466 participants with pancreatic cancer, a different population. Model-development regimens range from 10 to 400 mg QD and do not directly validate BID dosing (original Table 59 and Tables 65–67).
Table 2. Model information transcribed from the FDA review.
| Input | Value or treatment | Source location (PDF page) |
|---|---|---|
| CL/F, Vc/F | 53.8 L/h, 516 L | Table 59, page 242 |
| Q/F, Vp/F | 26.1 L/h, 255 L | Same table |
| ka, absorption lag | 0.735 /h, 0.305 h | Same table |
| Maximum relative-F reduction, half-change time | 0.357, 5.90 days | Same table |
| CL, Vc and ka η variances | 0.139, 0.168, 0.847 | Same table |
| CL–Vc η covariance | 0.0949 | Same table |
| Grade ≥3 TEAE Cmin slope | 0.013 /(ng/mL), 95% CI 0.007–0.020 | Table 65, page 260 |
| Grade ≥3 TRAE Cmax slope | 0.00363 /(ng/mL), 95% CI 0.00204–0.00523 | Table 66, page 260 |
| Dose-modifying TRAE log Cavg slope | 1.25, 95% CI 0.77–1.74 | Table 67, page 261 |
These are whole-blood concentrations. Concentration-dependent blood-to-plasma partitioning prevents substitution of plasma or unbound concentrations. Tumor concentrations and RAS occupancy are not calculated.
Model and reconstruction assumptions
A two-compartment model receives oral input after a lag. Gut, central and peripheral amounts are \(A_g,A_c,A_p\):
\[ \frac{dA_g}{dt}=-k_aA_g,\qquad \frac{dA_c}{dt}=k_aA_g-\frac{CL+Q}{V_c}A_c+\frac{Q}{V_p}A_p, \] \[ \frac{dA_p}{dt}=\frac{Q}{V_c}A_c-\frac{Q}{V_p}A_p, \qquad C(t)=1000\frac{A_c(t)}{V_c}. \]
Time is hours, amount mg and concentration ng/mL. Coefficients are apparent CL/F and V/F. Only relative F, normalized to one initially, multiplies input; absolute bioavailability is not additionally applied.
At steady state, relative F approaches \(F_{ss}=1-0.357=0.643\). For daily dose \(D\), linear mass balance gives
\[ AUC_{24,ss}=\frac{1000F_{ss}D}{CL/F},\qquad C_{avg,ss}=AUC_{24,ss}/24 \]
Equal daily AUC follows from these assumptions and does not independently demonstrate preserved efficacy.
The source provides maximum F reduction and half-change time, but the complete time function could not be confirmed. Initial profiles therefore use two assumed forms: \(F(t)=1-0.357t/(5.90+t)\) and \(F(t)=1-0.357(1-2^{-t/5.90})\), where t is days after initiation and each dose uses its administration-time F. These initial profiles are not full reproductions of the original model. Principal results concern steady state and do not depend on that choice.
The published low-dose absorption category also matters. A category effect of 1.49 with the general form \(1+\theta X\) gives a 2.49-fold ka increase at doses of 160 mg or less. Because original data are QD, it is unverified whether a BID category should use per-dose or daily amount. The primary analysis uses per-dose amount, with daily amount as sensitivity. Interval extrapolation thus also extrapolates the dose category.
Conditional individuals have fixed reference covariates: age 65 years, weight 70 kg, total bilirubin 8 µmol/L and previously treated pancreatic cancer. Jointly sampled random effects use
\[ \boldsymbol\eta\sim N\!\left(0, \begin{bmatrix}0.139&0.0949&0\\0.0949&0.168&0\\0&0&0.847\end{bmatrix}\right). \]
with coefficients \(\theta_i=\theta\exp(\eta_i)\). Unreported covariances are zero. The same η values are used for all regimens; the seed is 20261022. Real covariate distributions, residual error and joint fixed-effect uncertainty are excluded. Reported 5th–95th percentiles describe conditional individual variability, not 95% confidence intervals.
Absolute exposure does not fully match the label
Label summaries associated with 300 mg QD provide a consistency reference. Their Cmax aggregation time and AUC integration interval are not explicitly established here. The published AUC is therefore not asserted to be AUC24,ss, and this is not a strict validation against identical estimands (3; prescribing information section 12.3).
Table 3. Published summaries and conditional calculated absolute exposure.
| Metric | Published geometric mean | Reference covariates, η=0 | Geometric mean of 4,096 conditional individuals |
|---|---|---|---|
| Cmax (ng/mL) | 365 | 296.7 | 292.5 |
| AUC (ng·h/mL; published interval unconfirmed, calculation uses 24-hour steady state) | 3,760 | 3,585.5 | 3,580.2 |
Conditional Cmax is approximately 20% below the published value. Population composition and fixed reference covariates may contribute, but the cause is unresolved. Coefficients were not adjusted to match the label. This implementation is not a validated absolute-exposure model; subsequent results are coefficient-conditional regimen sensitivity analyses.
Closed-form single-dose responses were checked against an independently implemented ODE solution. Repeated doses use 40 preceding days of superposition; AUC was checked by independent numerical integration. Extrema use a 0.02-hour grid including absorption-start times and were compared with a finer grid. These validate implementation, not predictions in patients.
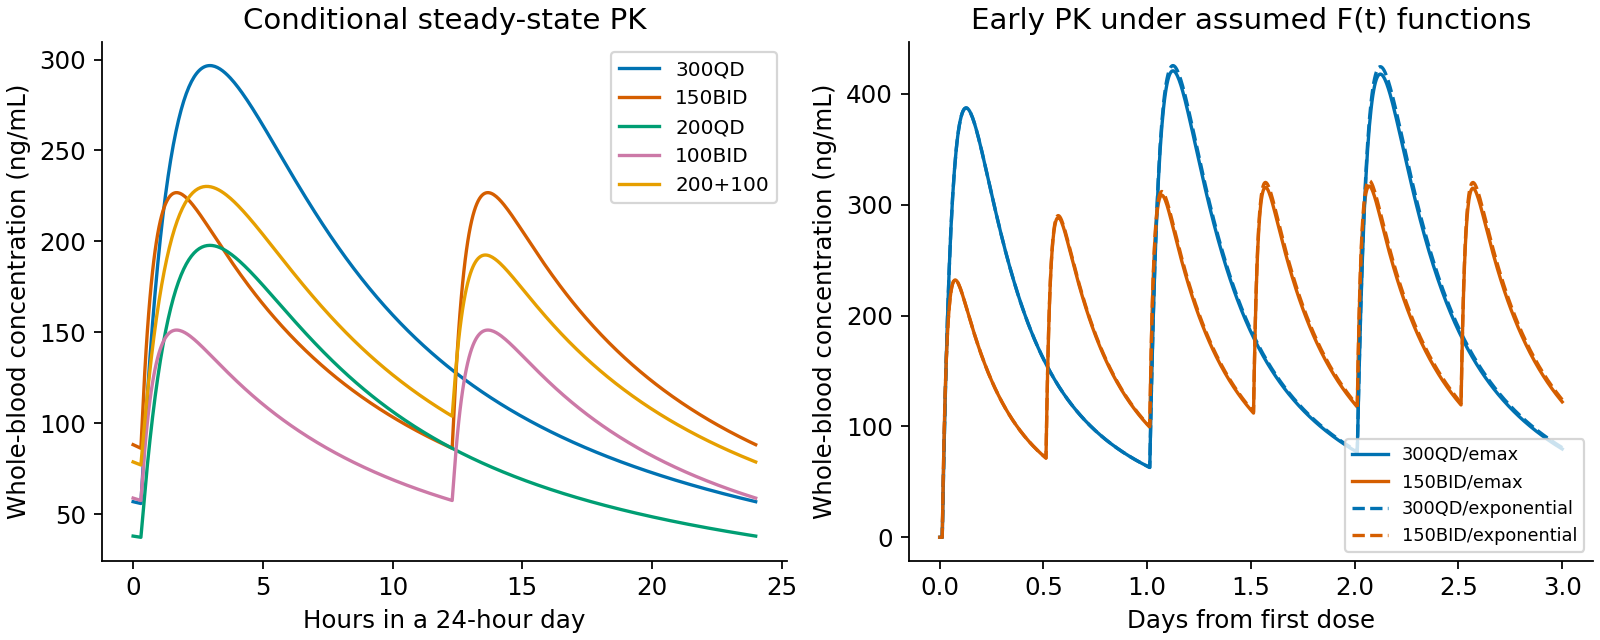
Figure 1. Left: five regimens in the same reference individual at steady state. Right: initial profiles under two assumed F functions, illustrating structural sensitivity rather than fits to observations.
Fractionation lowers peaks and raises minima
Table 4. Within-person exposure ratios relative to 300QD.
| Regimen | Cmax ratio | Minimum-concentration ratio | Cavg ratio |
|---|---|---|---|
| 150BID | 0.774 (0.662–0.908) | 1.49 (1.21–1.87) | 1.000 |
| 200QD | 0.667 | 0.667 | 0.667 |
| 100BID | 0.516 (0.441–0.605) | 0.991 (0.807–1.25) | 0.667 |
| 200+100 | 0.780 (0.723–0.886) | 1.35 (1.19–1.60) | 1.000 |
Values are medians (5th–95th percentiles); unrounded results are in CSV files. Minimum concentration is the minimum over 24 hours and need not equal predose concentration because of absorption lag.
150BID preserves average exposure while lowering peak concentration by approximately 23% and raising the minimum by approximately 49%. 100BID has a median minimum near 300QD but only two-thirds of its average exposure. A similar trough does not establish retained efficacy.
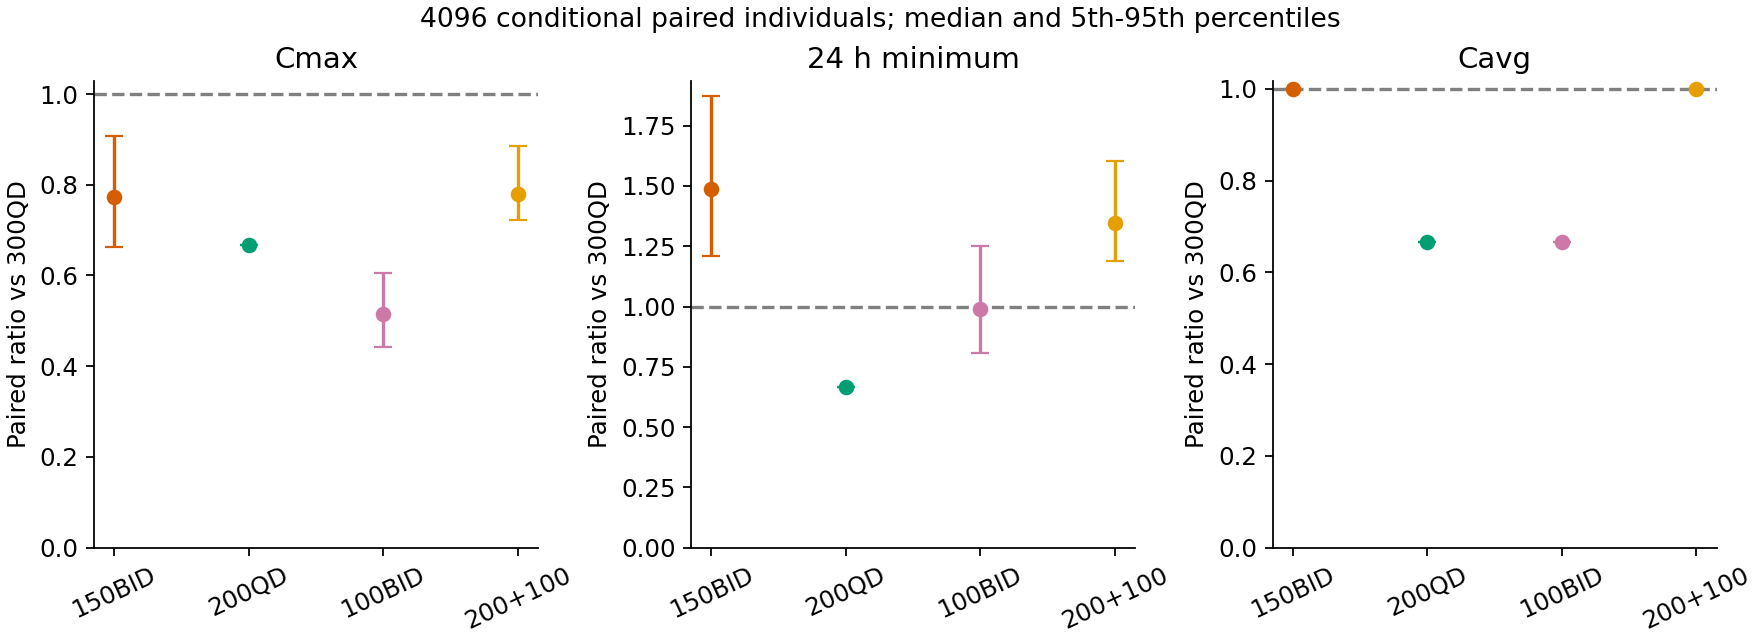
Figure 2. Points are medians; lines are conditional 5th–95th percentiles. The absence of variability in paired AUC and Cavg ratios follows from linear mass balance and does not imply high clinical predictive accuracy.
Classifying absorption by daily amount instead gives median 150BID ratios of 0.687 for Cmax and 1.61 for minimum concentration. Directions persist, but magnitudes change. Splits of 50+250, 100+200, 150+150, 200+100 and 250+50 mg were also compared. At 24-hour steady state, reversing dose order is a time shift with identical extrema and AUC. Equal splitting minimizes the median peak ratio among these comparisons, but not necessarily every individual’s peak, and does not identify a safety optimum.
Safety associations point in different directions
The published tables do not fully establish intercepts and covariate centering. Absolute event probabilities are therefore not calculated. Holding individual covariates fixed permits conditional relative-odds calculations:
\[ OR_{TEAE}=\exp\{0.013(C_{min,alt}-C_{min,300QD})\}, \] \[ OR_{TRAE}=\exp\{0.00363(C_{max,alt}-C_{max,300QD})\}, \] \[ OR_{modification}=\left(C_{avg,alt}/C_{avg,300QD}\right)^{1.25}. \]
The last endpoint covers any-grade TRAEs leading to interruption, reduction or discontinuation. TEAE and TRAE are distinct definitions, not independent explanations of identical events. Odds ratios are not risk ratios: 1.43 does not mean a 43% increase in event probability (original Tables 65–67).
Table 5. Conditional odds ratios projecting published QD associations onto hypothetical regimens.
| Regimen | Grade ≥3 TEAE conditional OR | Grade ≥3 TRAE conditional OR | Dose-modifying TRAE conditional OR |
|---|---|---|---|
| 150BID | 1.43 (1.21–1.77) | 0.790 (0.557–0.938) | 1.000 |
| 200QD | 0.773 (0.528–0.918) | 0.700 (0.510–0.832) | 0.602 |
| 100BID | 0.993 (0.723–1.07) | 0.599 (0.349–0.788) | 0.602 |
| 200+100 | 1.30 (1.16–1.50) | 0.796 (0.615–0.925) | 1.000 |
Medians and 5th–95th percentiles use point-estimate slopes. These calculations apply associations from QD data to hypothetical regimens, not causal BID effects or validated safety predictions. For 150BID, the Cmax-based TRAE association decreases while the Cmin-based TEAE association increases. They cannot be combined into one safety score. Correlated exposure metrics, disease, treatment duration and selected model forms also prevent identifying peak and trough as separate causes.
Canceling an intercept does not eliminate dependence on absolute concentration differences. The approximately 20% discrepancy from the label and unequal aggregation conditions still affect OR magnitudes. These values illustrate direction and sensitivity rather than calibrated effect sizes.
Using lower and upper published slope confidence limits gives median 150BID OR scenarios of 1.21–1.74 for TEAEs and 0.713–0.876 for TRAEs. These vary slopes alone; they are distinct from individual-variability intervals and from confidence intervals for true BID effects.
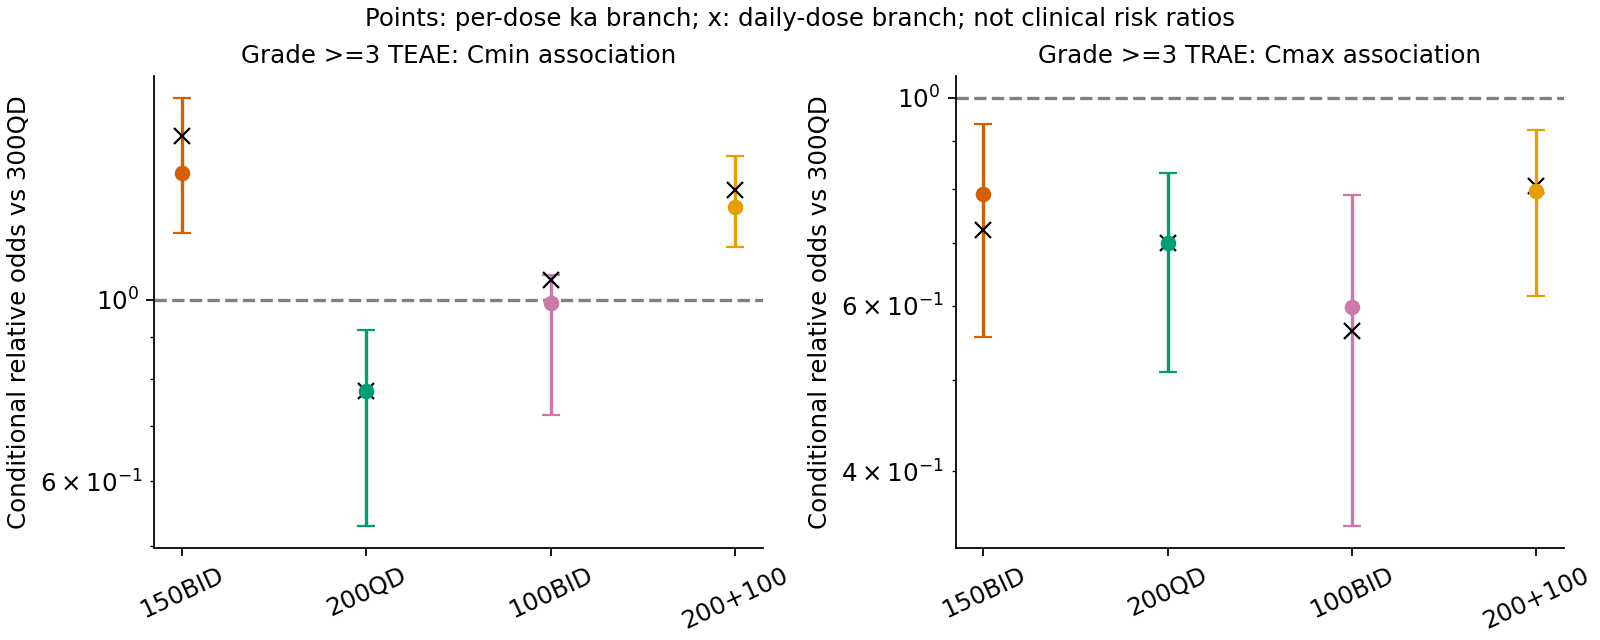
Figure 3. Colored points and lines show medians and 5th–95th percentiles with per-dose ka categories. Black crosses use daily-dose categories. Lines do not represent E–R coefficient confidence intervals.
Separate sources of uncertainty
Table 6. Sensitivity checks and their interpretation.
| Uncertainty | Check | Scope |
|---|---|---|
| Individual variability | Paired 4,096 draws from published η covariance | Fixed reference-covariate distribution |
| Absorption dose category | Classification by 1 dose versus 1 day | Structural extrapolation to BID |
| PK fixed effects | Vary CL, Vc, Q, Vp, ka, EM and ET50 separately on a log scale by approximately ±1.96 times reported RSE | Not a joint confidence region |
| E–R slopes | Separate calculations at published 95% CI endpoints | Kept distinct from individual variability |
| Cmin definition | Compare 24-hour minimum with minimum predose concentration | Sensitivity to an incompletely specified source extraction rule |
| Initial relative F | Compare 14-day and 42-day AUC under two assumed functions | Not a reconstruction of the original time function |
Peak reduction and minimum-concentration elevation persist under single-parameter changes and age, weight and bilirubin scenarios. ET50 does not change steady-state results because the calculation uses the limiting F value, not because ET50 is clinically unimportant.
For the two initial-F functions, median 150BID/300QD AUC ratios are approximately 0.987 and 0.986 over 14 days, and 0.995 and 0.994 over 42 days. Delaying half the daily dose by 12 hours changes carryover at finite-window boundaries and dose-time F. These finite-window ratios differ from exact steady-state equality.
Safety interpretation depends on the endpoint
Preserving daily dose while fractionating lowers peaks and raises minima. Reducing daily dose as in 100BID additionally lowers average exposure. These are different exposure changes and cannot all be called benefits of fractionation. Food timing, circadian variation and adherence burden are not modeled.
A nonsignificant efficacy exposure–response association in the source does not prove preserved efficacy after reduction or fractionation. The source’s exposure range centered on 300 mg QD differs from these hypothetical regimens (original efficacy E–R section). The calculation supports peak reduction but does not establish improved safety; the minimum-concentration-based association moves in the opposite direction.
Data and code availability
The analysis archive contains inputs, random seed, analysis and test code, eight CSV files and three figures. Individual clinical records and original PDFs are not redistributed. Sources were checked on 22 October 2026. Model coefficients come from the FDA review; all article figures were generated from this independent analysis.
References
1. US Food and Drug Administration. FDA approves daraxonrasib for metastatic pancreatic adenocarcinoma. 2026. Approval information.
2. US Food and Drug Administration. Daraxonrasib: multidisciplinary review, NDA 220910. 2026. Review.
3. US Food and Drug Administration. Rasonque (daraxonrasib) tablets: US prescribing information. Revised August 2026. Label.