Vopimetostat and daraxonrasib: what AUC matching leaves unknown
Public PK summaries and conditional simulations separate AUC matching from concentration profiles, clinical interactions and combination-dose optimization.
On this page
- Question and intended use
- What does 4,106 represent?
- Changing only the interpretation of the mean
- Two structures with the same AUC
- Comparable AUC does not imply comparable profiles
- Distribution tails distinguish hypothetical doses
- Which uncertainties enter the calculation?
- AUC cannot separate input from elimination
- Data and code availability
- References
Vopimetostat targets PRMT5 in MTAP-deleted tumors and is being developed with the RAS(ON) inhibitor daraxonrasib. In the June 2026 public presentation, one PK statement is especially consequential: daraxonrasib AUC at 100 mg in combination is described as comparable to 300 mg alone (slide 20) (1).
One-third the dose does not necessarily mean one-third the exposure. It also does not establish a threefold interaction or equal efficacy. AUC comparisons require matching intervals, sampling times, aggregation and populations. I audited the public definitions and calculated exposure matching conditional on comparable steady-state 24-hour AUC, then used public human PopPK coefficients in 4,096 paired hypothetical individuals to examine whether equal AUC constrains peaks and minima.
Question and intended use
The question is how hypothetical combination daraxonrasib 50, 75, 100 and 150 mg once daily, QD, overlap the monotherapy 300 mg QD distribution under comparable-AUC assumptions, and whether AUC determines concentration profiles. The intended use is public-data PK hypothesis clarification, not treatment or trial-dose selection. This is neither individual-data NLME estimation nor a validated combination PBPK model.
What does 4,106 represent?
The June 8 presentation reports daraxonrasib AUC 4,106 ng·h/mL, n=13 and CV 40.5% for dose level 1, vopimetostat 200 mg plus daraxonrasib 100 mg, both QD. Its heading includes pancreatic and lung cancer. This is not a separate 250 mg vopimetostat PK summary (slides 13, 19 and 20).
Table 1. Reported combination PK definitions and missing information.
| Item | Publicly established | Unconfirmed |
|---|---|---|
| Combination | Vopimetostat 200 mg + daraxonrasib 100 mg QD | Separate AUC at 250 mg |
| PK summary | AUC 4,106, n=13, CV40.5% | Arithmetic/geometric mean and CV definition |
| Measurement | Data extracted 2026-05-28 | AUC interval, sampling day, steady-state definition, whole blood/plasma or other matrix |
| Population | Pancreatic and lung cancer in the relevant section | Composition and individual covariates of 13 PK participants |
| Monotherapy comparison | Described as comparable to 300 mg alone | Individual comparison with a matched control group |
The US label reports geometric-mean Cmax 365 ng/mL and AUC 3,760 ng·h/mL, without explicitly specifying the AUC interval or exact assessment time in that paragraph. I therefore do not divide 4,106 by 3,760 and dose-normalize the result as an established DDI multiplier (section 12.3) (2).
At the fixed source-check time, the morning of October 23, 2026 in Japan, a 7:30 AM US Eastern briefing that day and an October 25 ESMO presentation had been announced. Their then-unreleased results are excluded (October 16 announcement) (3).
Changing only the interpretation of the mean
Because definitions are missing, I considered 4,106 as a geometric mean with geometric CV 40.5%, or as an arithmetic mean with SD/mean CV 40.5%. Under lognormality, the latter gives
\[ \sigma^2=\log(1+CV^2),\qquad GM=\frac{AM}{\sqrt{1+CV^2}} \]
and geometric mean 3,805.7 ng·h/mL. This is sensitivity to an unreported definition, not identification of the true aggregation.
The reference uses FDA human PopPK coefficients for age 65 years, 70 kg, bilirubin 8 µmol/L and previously treated pancreatic cancer: CL/F 53.8 L/h and limiting relative F=1−0.357=0.643 (Table 59, PDF p. 242) (4). Reference 100 mg QD steady-state AUC is
\[ AUC_{100,ss}=\frac{1000\times100\times0.643}{53.8} \]
The conditional scale matching the aggregate value is
\[ K=\frac{GM_{combo}}{AUC_{100,ss}} \]
This assumes the same whole-blood analyte as the model, also unconfirmed by the slides. K can incorporate population, matrix, condition and definitional differences. It is not a clinical interaction estimate.
Table 2. Conditional exposure scales under alternative aggregation assumptions.
| Assumption | Assumed combination AUC GM | Conditional K | Calculated dose matching monotherapy 300 mg AUC |
|---|---|---|---|
| GM + geometric CV | 4,106.0 | 3.44 (2.71–4.35) | 87.3 mg (69.0–110.5) |
| AM + SD/mean CV | 3,805.7 | 3.18 (2.52–4.03) | 94.2 mg (74.4–119.2) |
Parentheses are approximate location-sensitivity ranges from \(\log GM\pm t_{12,0.975}\sqrt{\log(1+CV^2)/13}\). The arithmetic-mean conversion simplifies variance-estimation uncertainty. These are not original-trial confidence intervals and do not resolve mismatched intervals, populations or definitions. The calculated matching doses are \(300/K\) (87.3 or 94.2 mg under the two assumptions). They do not constitute prescribing recommendations. The 50 and 75 mg conditions do not instruct tablet splitting, which the label disallows (sections 2.2 and 3).
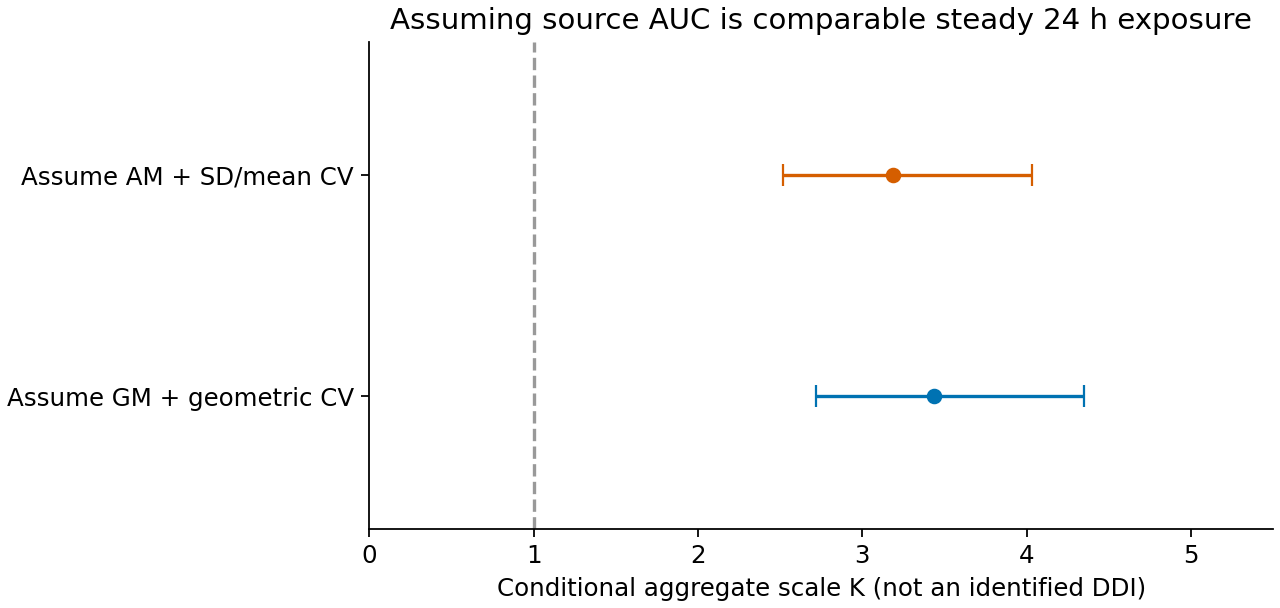
Figure 1. Conditional K and approximate location-sensitivity ranges, assuming comparable steady-state 24-hour AUC. They do not encompass unconfirmed definitions or establish equivalence.
Two structures with the same AUC
Gut, central and peripheral amounts are \(A_g,A_c,A_p\), with a 0.305-hour absorption lag:
\[ \dot A_g=-k_aA_g,\qquad \dot A_c=k_aA_g-\frac{CL+Q}{V_c}A_c+\frac{Q}{V_p}A_p, \]
\[ \dot A_p=\frac{Q}{V_c}A_c-\frac{Q}{V_p}A_p,\qquad C(t)=1000A_c/V_c. \]
Time is hours, amounts mg and concentrations whole-blood ng/mL. No plasma, unbound or tumor conversion is made. Relative steady-state F multiplies input once alongside apparent PK parameters.
Table 3. Reused PK coefficients and conditional-individual settings.
| Parameter or setting | Value or treatment |
|---|---|
| CL/F, Vc/F, Q/F, Vp/F | 53.8 L/h, 516 L, 26.1 L/h, 255 L |
| ka, Tlag | 0.735 /h, 0.305 h |
| ka effect at ≤160 mg | 2.49-fold from the published categorical equation; no-effect scenario also calculated |
| η variances, CL, Vc, ka | 0.139, 0.168, 0.847 |
| CL–Vc η covariance | 0.0949; others assumed 0 |
| Draws and seed | 4,096 paired draws, 20261023 |
| Covariates and error | Fixed reference covariates, no residual error |
Inputs come from the same Table 59. Because the complete initial relative-F function is unconfirmed, only steady state is examined. Individual coefficients are \(\theta_i=\theta\exp(\eta_i)\), with multivariate-normal η and the stated covariance. Identical η values are paired across conditions; this does not reconstruct the actual combination population.
The input-scale structure multiplies relative input by K while retaining elimination and distribution. The clearance-scale structure divides CL/F by K while retaining input and distribution. Both multiply AUC by K, but only the latter changes elimination timescales. One AUC cannot identify which structure applies. These hypothetical structures explore profile ambiguity; they identify neither true F changes nor CYP inhibition, and relative input scale is not absolute F.
Public nonclinical TNG462 material predicts low CYP/transporter DDI risk at therapeutic concentrations. That does not prove absence of clinical DDI, but neither does this AUC justify asserting strong CYP3A inhibition (PDF p. 15) (5).
Comparable AUC does not imply comparable profiles
The central scenario treats 4,106 as a GM. Denominators are the same individuals' 300 mg monotherapy outputs.
Table 4. Paired exposure ratios under two AUC-matched structures.
| Combination daraxonrasib | AUC24 ratio | Input-scale Cmax ratio | CL-scale Cmax ratio | Input-scale minimum ratio | CL-scale minimum ratio |
|---|---|---|---|---|---|
| 50 mg QD | 0.573 | 0.668 | 0.397 | 0.545 | 1.07 |
| 75 mg QD | 0.859 | 1.00 | 0.596 | 0.818 | 1.61 |
| 100 mg QD | 1.15 | 1.34 | 0.794 | 1.09 | 2.14 |
| 150 mg QD | 1.72 | 2.00 | 1.19 | 1.64 | 3.22 |
Values are medians of within-individual ratios. Constant AUC ratios follow from common K and linear balance, not precise clinical prediction. Minimum concentration is the minimum within 24 hours and need not occur immediately before dosing because of lag.
At 100 mg, AUC ratio is 1.15 in both structures, but Cmax ratios are 1.34 versus 0.794 and minimum ratios 1.09 versus 2.14. Cmax 5th–95th percentiles are 1.21–1.50 for input scaling and 0.616–1.03 for CL scaling. Matching AUC does not guarantee matching peaks or minimum concentrations.
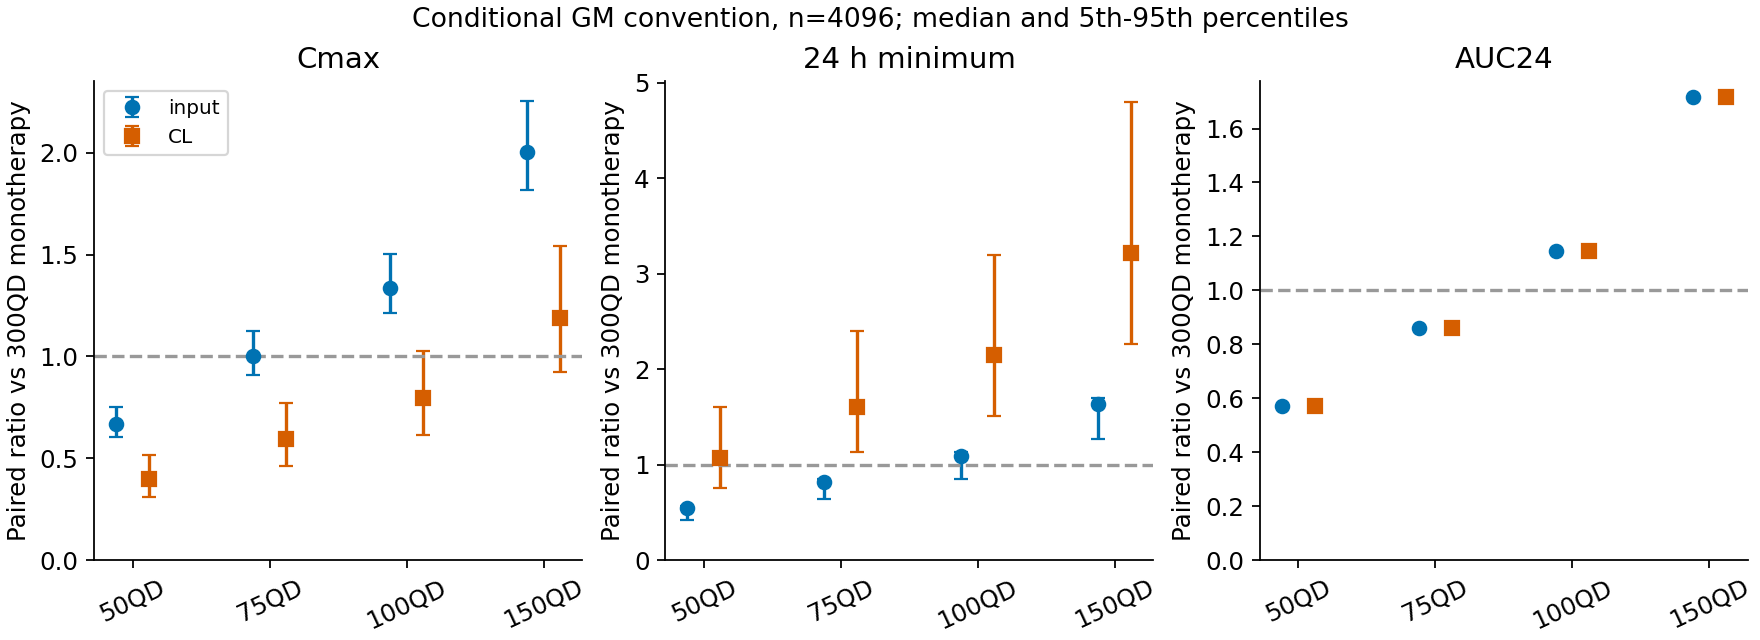
Figure 2. Medians and conditional between-individual 5th–95th percentiles. K location uncertainty and mean-definition sensitivity are kept separate. The structures are examples, not guaranteed bounds on true profiles.
Distribution tails distinguish hypothetical doses
I calculated fractions below and above monotherapy-reference AUC 5th and 95th percentiles. These are not efficacy or toxicity thresholds.
Table 5. Fractions beyond monotherapy-reference distribution tails.
| Combination dose | GM assumption: below P05 | GM assumption: above P95 | AM assumption: below P05 | AM assumption: above P95 |
|---|---|---|---|---|
| 50 mg QD | 44.2% | 0.07% | 52.7% | 0.05% |
| 75 mg QD | 10.7% | 1.90% | 14.6% | 1.15% |
| 100 mg QD | 2.08% | 10.7% | 3.61% | 7.25% |
| 150 mg QD | 0.05% | 43.6% | 0.17% | 35.8% |
These empirical fractions in 4,096 draws imply neither inefficacy below nor danger above the reference. They coincide between AUC-matched structures and conceal profile uncertainty.
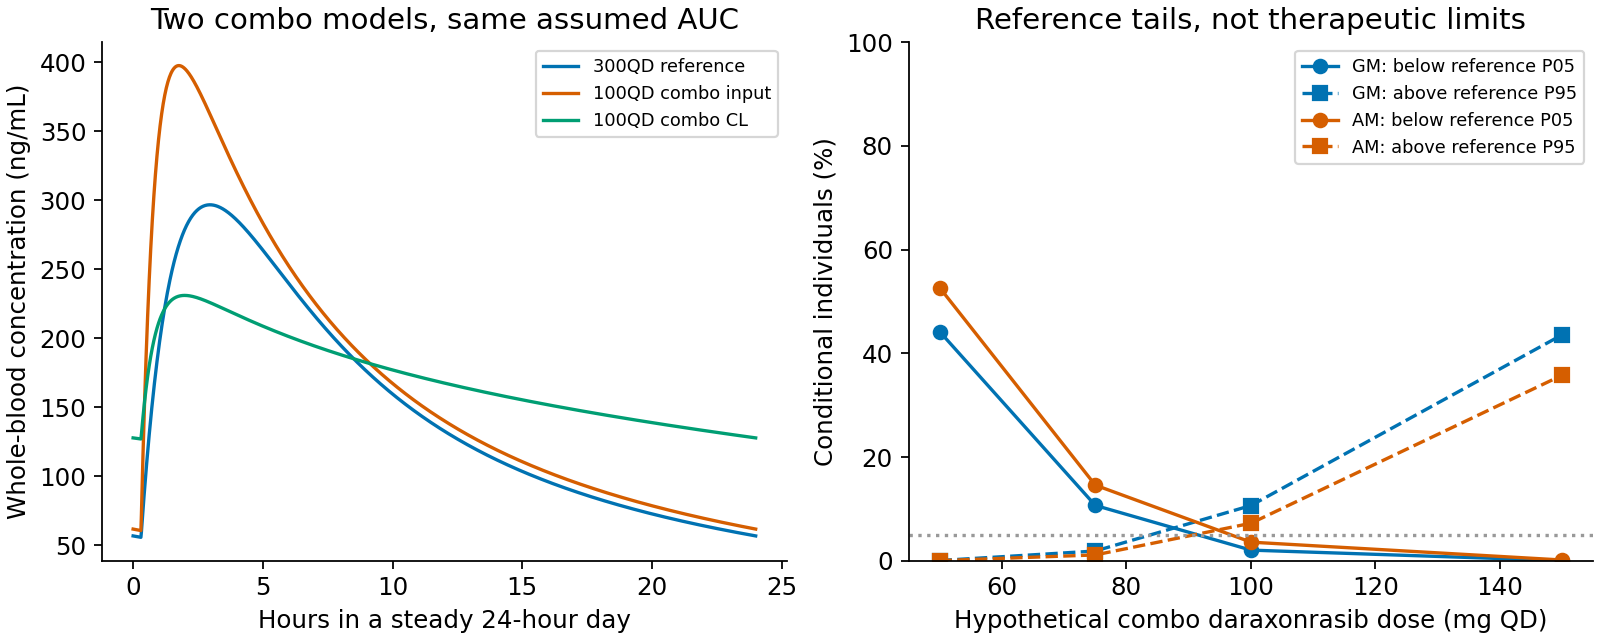
Figure 3. Left: reference-covariate, η=0 steady profiles. Equal AUC refers to the two 100 mg combination structures, not to monotherapy 300 mg. Right: AUC distributions under different mean assumptions, not therapeutic ranges or adverse-event rates.
Under these assumptions, 50 mg shifts many individuals toward lower exposure and 150 mg toward higher exposure. The intermediate 75 and 100 mg conditions merit comparison within this calculation, but no efficacy–safety optimum is estimated.
Which uncertainties enter the calculation?
Table 6. Sensitivity analyses and remaining constraints.
| Uncertainty | Calculation | Constraint |
|---|---|---|
| Mean/CV definitions | Separate GM/GCV and AM/CV scenarios | Source definitions remain unconfirmed |
| Small-sample location | Approximate ranges from n=13 | Individual data, missingness and selection unknown |
| Individual variability | Paired published η distribution | No combination covariate distribution or individual K variation |
| Structural profiles | Input versus CL scaling | Does not cover every possible structure |
| Low-dose absorption | With and without ka effect | Transferability to combination unknown |
| Dose–AUC relationship | At 100 mg, anchored exponents 0.8, 1 and 1.2 | Not measured combination exponents |
Central K is constant over 50–150 mg. In particular, 50 mg lies outside the label's approximately dose-proportional 80–300 mg range. Exponent sensitivity does not validate that extrapolation.
Even location uncertainty alone gives a 75 mg AUC ratio of 0.679–1.087 under the GM assumption, precluding precise interpretation of 87.3 mg. Removing the low-dose ka effect changes input-scale 100 mg Cmax ratio from 1.34 to 1.15. Absorption assumptions matter alongside AUC.
The reconstructed reference 300 mg Cmax is 296.7 ng/mL versus label geometric mean 365 ng/mL, with unmatched populations and assessment times. These profiles are not validated absolute-concentration forecasts. Broadening K or individual variability does not resolve definitions or structure.
Independent ODE solutions checked single-dose responses, numerical integration checked AUC, lognormal analytic results checked distribution tails, and finer grids checked extrema. These validate implementation rather than combination-patient predictions.
AUC cannot separate input from elimination
The interval, sampling day and averaging definition behind 4,106 remain unknown. Calculations retain those uncertainties as assumptions. Two structures fit the same AUC while producing different profiles; matching the number identifies neither altered input nor altered clearance.
Information at vopimetostat 200 mg does not establish transfer to 250 mg. Starting and stopping the combination and recovery after discontinuation are also outside steady state. Early uncontrolled responses include unconfirmed responses. Exposure matching establishes neither pharmacological synergy nor improved safety (slide 15).
Data and code availability
The archive supplies inputs, analysis and test code, eight CSV files and three figures. Original figures and individual clinical data are not redistributed. Sources were checked on the morning of October 23, 2026 JST. All article figures arise from these calculations.
References
- Tango Therapeutics. Vopimetostat and RAS(ON) combination data. 2026 Jun 8. Public presentation. Slides 13, 15, 19 and 20.
- US Food and Drug Administration. Rasonque (daraxonrasib): US prescribing information. 2026 Aug. Label. Sections 2.2, 3 and 12.3.
- Tango Therapeutics. Tango Therapeutics to Present Updated Vopimetostat + RAS(ON) Combination Data at European Society For Medical Oncology (ESMO) Congress 2026. 2026 Oct 16. Announcement.
- US Food and Drug Administration. Daraxonrasib: multidisciplinary review, NDA 220910. 2026. Review. Table 59, PDF p. 242.
- Cottrell K. Discovery of TNG462: a highly potent and selective MTA-cooperative PRMT5 inhibitor synthetic lethal for MTAP deleted cancers. ACS National Meeting. 2023 Aug 16. Presentation. PDF p. 15.