Sevabertinib dosing frequency and formulation
Aggregate AUC ratios estimate relative bioavailability. Public PopPK coefficients compare paired schedules in 4096 conditional virtual patients. Unresolved peak reconstruction and the limits of AUC-only E-R are explicit.
On this page
- Background and objective
- Comparison conditions
- Formulation differences
- Reconstructing the public PopPK model
- Comparing the same 24-hour AUC window
- Within-individual differences and estimation uncertainty
- An AUC-only E–R model cannot select dosing frequency
- Discussion
- Numerical checks and limitations
- Data and code availability
- References
Background and objective
Sevabertinib 20 mg twice daily and 40 mg once daily have the same daily dose, but need not produce the same concentration profile. A further distinction is the liquid formulation used in early development versus tablets.
In a reconstruction from public information, changing tablets from twice to once daily preserved steady-state 24-hour AUC while increasing the peak and lowering the minimum. A 40 mg once-daily liquid regimen could instead produce a peak close to that of 20 mg tablets twice daily while having a lower 24-hour AUC.
I examine these differences using a reconstruction of the public population-PK model and conditional virtual patients. The new estimation is limited to relative bioavailability inferred from an aggregate formulation AUC ratio. The analysis does not show that once-daily dosing preserves clinical efficacy or improves safety.
Comparison conditions
Sevabertinib is an oral drug for HER2-mutant non-small cell lung cancer. Its US indication expanded in September 2026. The recommended regimen is 20 mg twice daily with food. These calculations do not recommend changing that regimen (1, 2).
Table 1. Question and comparison conditions.
| Item | Definition |
|---|---|
| Question of interest | At the same 40 mg/day, how do frequency and formulation affect parent-drug AUC, peak and minimum concentration? What can public E–R information establish? |
| Context of use | Public-information PK comparisons and identification of quantities requiring further validation; not patient regimen changes or clinical-trial dose selection |
| Reference | 20 mg tablets every 12 hours, abbreviated TAB BID |
| Frequency comparison | 40 mg tablets every 24 hours, TAB QD |
| Formulation-changing comparison | 40 mg liquid every 24 hours, LSF QD |
| Conditions | Periodic steady state, paired within the same individual; food conditions, adherence and concomitant drugs held unchanged |
The early 20 mg tablet and current 10 mg tablet strength must also be distinguished. FDA review documents contain an exploratory comparison of those strengths, but this article is not a new equivalence study of the current tablets.
Formulation differences
The FDA cardiac review grouped 20 mg TAB BID and 40 mg LSF QD as having similar exposure. That grouping does not establish that 40 mg tablets can be substituted once daily. The concentration–QT dataset also included 40 mg TAB QD, but that small subgroup did not establish clinical equivalence between regimens (3, PDF p. 35).
If relative bioavailability and absorption differ between liquid and tablet, changing formulation and frequency simultaneously mixes two effects. Similar exposure must therefore specify whether it means AUC, maximum concentration or minimum concentration.
The exploratory relative-bioavailability analysis reported a tablet/liquid AUC0–24 geometric least-squares mean ratio of 1.5545, with a 90% confidence interval of 1.0746–2.2485. This is an aggregate result from an existing analysis, not individual concentration data (4, PDF pp. 117–118).
Let \(r_F\) denote liquid/tablet relative bioavailability. I used an aggregate log-ratio likelihood:
\[ y=\log(1.5545),\qquad s=\frac{\log(2.2485)-\log(1.0746)}{2z_{0.95}}, \]
\[ y\sim N(-\log r_F,s^2). \]
The one-parameter maximum-likelihood estimate was 0.643, with a log-normal aggregate-approximation 90% interval of 0.445–0.931. Its magnitude is close to the published PopPK liquid relative bioavailability of 0.639.
The directly observed contrast is nevertheless a finite-window AUC ratio. Interpreting it as an F ratio assumes that dosing conditions, clearance and the fraction captured in 0–24 hours do not materially distort the ratio. The aggregate comparison and PopPK also share study information, so their proximity is not independent external validation. A single ratio cannot identify absorption rate or individual clearance.
Reconstructing the public PopPK model
The FDA review describes delayed absorption with two-compartment distribution. The main implementation uses five serial absorption compartments leading to the central compartment. This reconstructs published descriptions and coefficients rather than reproducing the original executable model. A six-stage sensitivity analysis covers an alternative interpretation counting the dose compartment separately (4, PDF pp. 293 and 300).
At dosing, \(D F_{rel,i}\) is added to the first absorption compartment. With absorption amounts \(B_1,\ldots,B_m\) and central and peripheral amounts \(A_c,A_p\):
\[ \frac{dB_1}{dt}=-k_{a,i}B_1,\qquad \frac{dB_j}{dt}=k_{a,i}(B_{j-1}-B_j),\quad j=2,\ldots,m, \]
\[ \frac{dA_c}{dt}=k_{a,i}B_m- \left(\frac{CL_i^*}{V_c^*}+\frac{Q^*}{V_c^*}\right)A_c+ \frac{Q^*}{V_p^*}A_p, \]
\[ \frac{dA_p}{dt}=\frac{Q^*}{V_c^*}A_c-\frac{Q^*}{V_p^*}A_p, \qquad C(t)=\frac{A_c(t)}{V_c^*}. \]
Asterisks denote apparent coefficients normalized to the reference tablet bioavailability. Absolute F is not known. Calculations use mg, hours and liters, with concentrations converted to ng/mL.
Table 2. Published coefficients used in the reconstruction.
| Coefficient | Published value | Role in this implementation |
|---|---|---|
| \(k_a\) | 7.90 h⁻¹ | Transfer rate between absorption compartments |
| \(CL^*\) | 3.09 L/h | Reference apparent clearance |
| \(V_c^*,V_p^*\) | 30.0, 20.4 L | Apparent central and peripheral volumes |
| \(Q^*\) | 0.634 L/h | Intercompartmental clearance |
| Liquid relative F | 0.639 | Main liquid input; 0.643 and its interval assessed separately |
| Liquid absorption-rate multiplier | 1.491 | Faster absorption for liquid than tablet |
| \(\Omega_{ka},\Omega_{CL},\Omega_F\) | 0.330, 0.135, 0.0936 | Log-normal between-individual variances |
Published weight and albumin/total-protein effects were reconstructed as multiplicative relative-F terms around 61 kg and a ratio of 0.56, with exponents −0.517 and −1.22. This equation does not validate covariate–formulation interactions:
\[ F_{rel,i}=F_{form} \left(\frac{BW}{61}\right)^{-0.517} \left(\frac{ALB/PROT}{0.56}\right)^{-1.22}e^{\eta_F}, \quad CL_i^*=3.09e^{\eta_{CL}},\quad k_{a,i}=k_{a,form}e^{\eta_{ka}}. \]
Because this is relative F, it need not be truncated to 0–1 as if it were absolute bioavailability. The main simulation fixes reference covariates and generates random effects for 4096 virtual individuals. Unreported correlations are assumed to be 0; a sensitivity analysis sets the Ka–CL correlation to ±0.5. These are individuals conditional on stated assumptions, not a reconstruction of the full joint patient-covariate distribution. Residual measurement error is not added to true-exposure variability.
Comparing the same 24-hour AUC window
Periodic steady state is obtained directly by matrix exponentiation, with concentration evaluated every 0.05 hours. Each virtual individual's random effects are shared across regimens. For a linear model with the same formulation and daily dose:
\[ AUC_{0-24,ss}=\frac{D_{day}F_{rel,i}}{CL_i^*} \]
Thus, equal 24-hour AUC for 20 mg BID and 40 mg QD follows from the model structure. It is not a new pharmacological finding discovered by simulation.
The label's AUC of 6640 ng·h/mL for 20 mg BID corresponds to 0–12 hours, as verified in the FDA review (4). Comparing it directly with a 40 mg QD 0–24-hour AUC would mix exposure windows (2, Section 12.3).
The reference individual had AUC0–12 of 6472 ng·h/mL and Cmax of 868 ng/mL. These are close to the label's population means of 6640 and 902, but a reference individual and a population mean are different quantities. Main-implementation steady-state Tmax was 1.25 hours. The label's approximately 2 hours is a single-dose median, so this is not a direct like-for-like validation.
I also checked the formulation Cmax ratio, which was not used to estimate F. Under equal 20 mg single doses to the reference individual, the reconstructed tablet/liquid AUC0–24 ratio was 1.562, but the Cmax ratio was 1.519, below even the reported aggregate Cmax ratio's 90% interval of 1.5822–3.2563 around 2.2699. That interval describes uncertainty in an aggregate least-squares mean ratio, not a formal goodness-of-fit criterion for an individual prediction. It nevertheless exposes a discrepancy that AUC alone misses. Six absorption stages did not resolve it. Because the original aggregate dosing and background conditions are not fully reconstructed, the discrepancy cannot be attributed solely to absorption-stage count.
The reconstruction therefore does not reproduce the formulation peak contrast merely by matching AUC. Subsequent Cmax and Cmin comparisons are conditional on this absorption implementation. Agreement with an average steady-state BID Cmax does not validate peaks after changing regimens. Diagnostics are saved in outputs/consistency.json and outputs/tables/aggregate-consistency.csv.
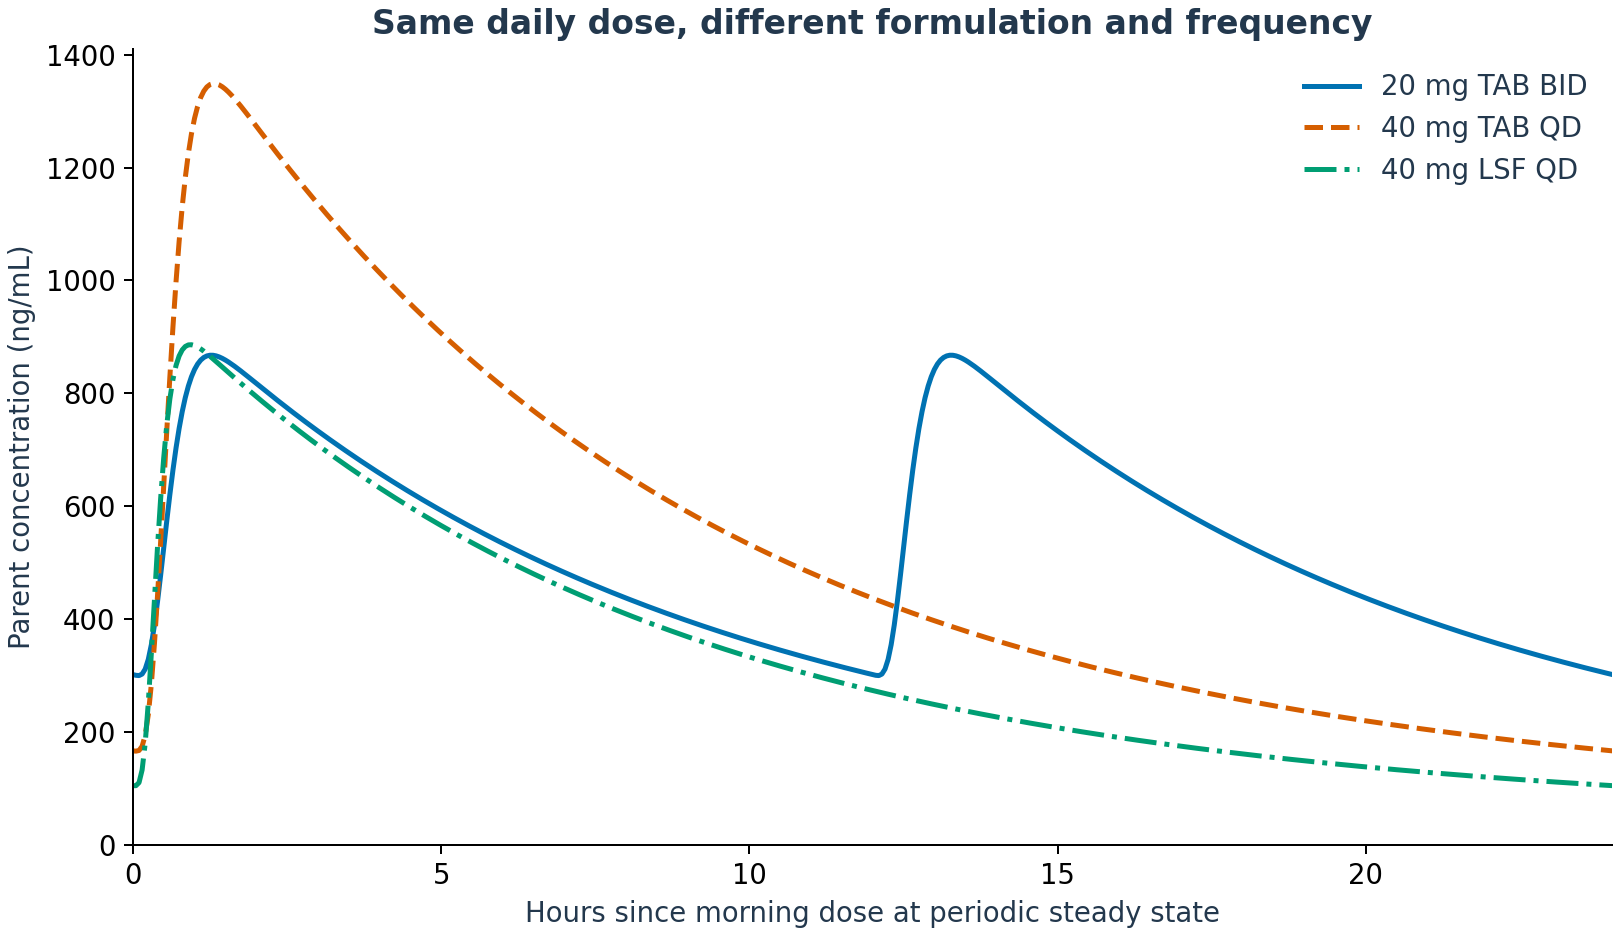
Figure 1. Reconstructed 24-hour reference-individual profiles, not observed concentration curves. TAB denotes tablets, LSF liquid, BID every 12 hours and QD every 24 hours. Reference conditions are 61 kg, ALB/PROT=0.56 and zero random effects. The following values come from this run.
Table 3. Steady-state exposure in the reference individual.
| Regimen | AUC0–24 (ng·h/mL) | Cmax (ng/mL) | Cmin (ng/mL) | Cmax/Cmin |
|---|---|---|---|---|
| 20 mg TAB BID | 12945 | 868 | 300 | 2.89 |
| 40 mg TAB QD | 12945 | 1349 | 166 | 8.11 |
| 40 mg LSF QD | 8272 | 886 | 105 | 8.43 |
Cmin is the minimum within a dosing cycle. With delayed absorption, it need not equal the concentration immediately before dosing.
Among tablet regimens, once-daily dosing widens the peak-to-minimum difference. For liquid QD, lower relative F brings the peak close to tablet BID while leaving AUC lower. This calculation does not establish that FDA exposure grouping was erroneous; it makes explicit which exposure metric and formulation are being compared.
Within-individual differences and estimation uncertainty
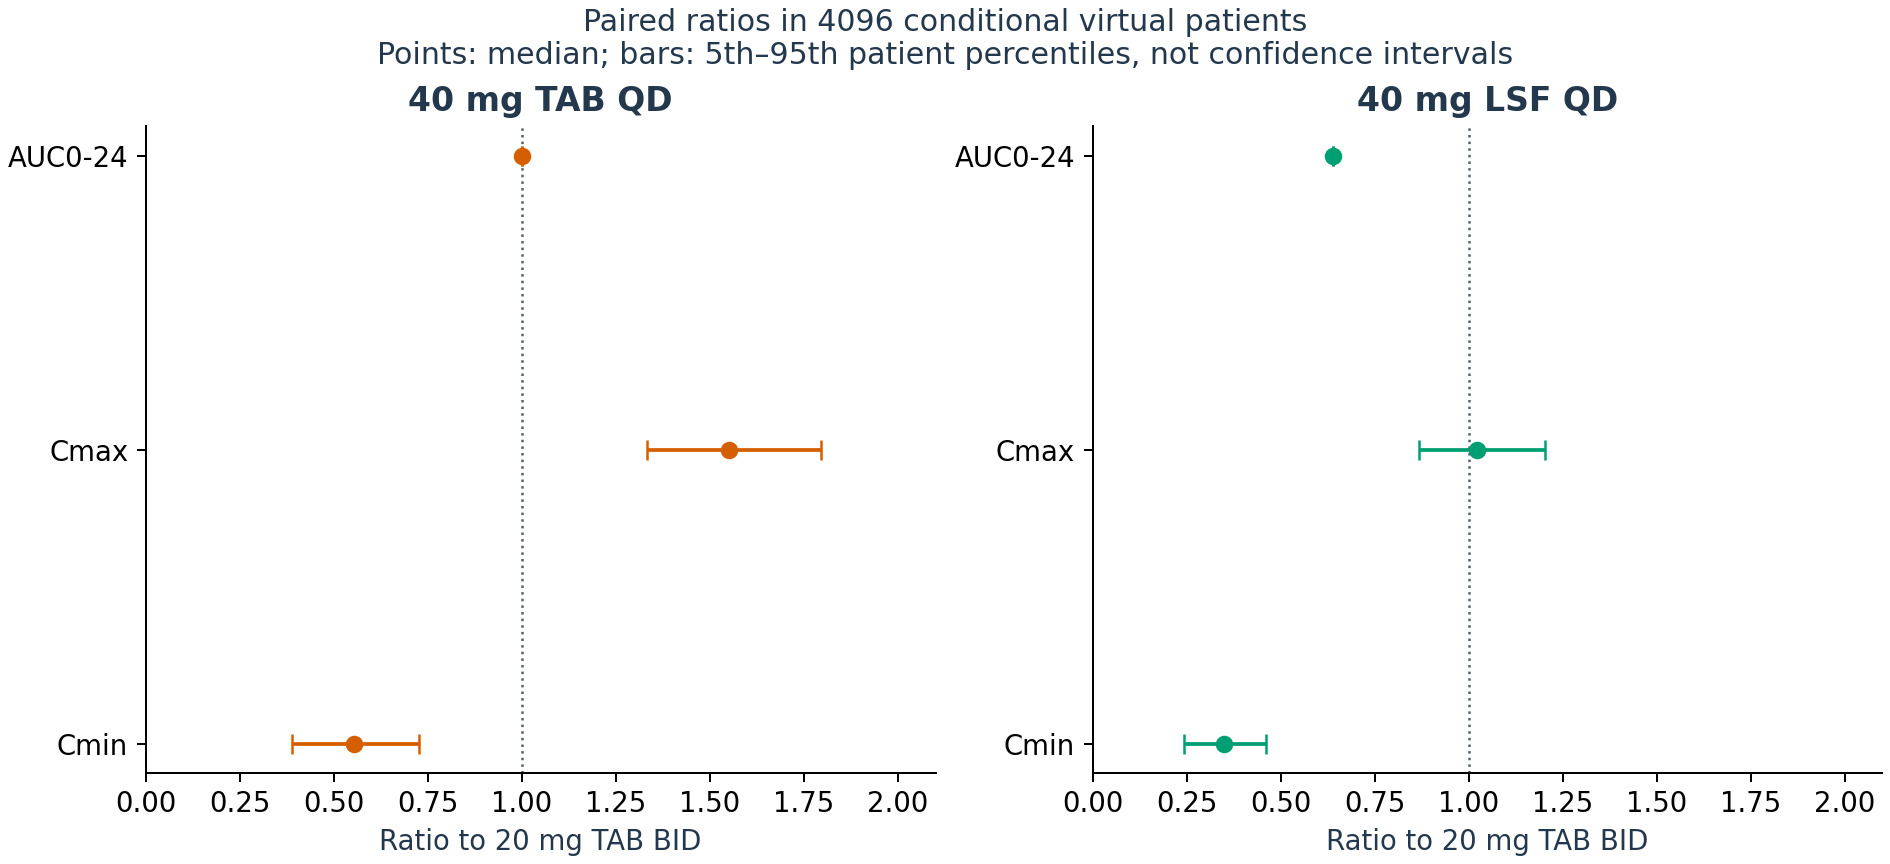
Figure 2. Paired ratios in 4096 conditional virtual individuals. Points are medians and lines are 5th–95th percentiles, not confidence intervals. All individuals have the same covariates. Uncertainty in estimated liquid F is excluded from these lines.
Table 4. Within-individual ratios relative to 20 mg TAB BID.
| Ratio relative to 20 mg TAB BID | Median | 5th–95th percentile of paired ratios |
|---|---|---|
| 40 mg TAB QD: AUC0–24 | 1.000 | 1.000–1.000 |
| Same: Cmax | 1.551 | 1.333–1.796 |
| Same: Cmin | 0.553 | 0.389–0.727 |
| 40 mg LSF QD: AUC0–24 | 0.639 | 0.639–0.639 |
| Same: Cmax | 1.022 | 0.867–1.203 |
| Same: Cmin | 0.348 | 0.244–0.461 |
The liquid AUC ratio is 0.639 for everyone because formulation relative F is fixed across individuals. This is not clinical evidence that formulation-switch effects lack variability.
Varying the aggregate-estimated relative F over 0.445–0.931 changed reference-individual 40 mg LSF QD AUC0–24 to 5757–12046 ng·h/mL and Cmax to 617–1290 ng/mL. These are sensitivity ranges for F alone, not joint PopPK-parameter uncertainty or prediction intervals for new patients.
Additional sensitivity analyses in 512 individuals, using five or six absorption stages and Ka–CL correlations of −0.5, 0 or 0.5, yielded median tablet QD/BID Cmax ratios of 1.547–1.552 and Cmin ratios of 0.551–0.557. The direction persisted, but this does not exclude effects of food, adherence timing or other absorption structures.
Changing body weight individually to 48 or 80 kg and ALB/PROT to 0.49 or 0.63 leaves regimen ratios unchanged in this multiplicative-F model because the common factor cancels. Covariates are not thereby clinically irrelevant; the equation simply contains no covariate–regimen interaction.
An AUC-only E–R model cannot select dosing frequency
The FDA review includes the applicant's exploratory Emax relationship between best tumor response (BTR) and AUC. Its published point estimates give:
\[ g(AUC)=\frac{-58.635\ AUC_{0-24,ss}}{4000+AUC_{0-24,ss}}. \]
This describes tumor-diameter change versus AUC in the existing D/D1 subgroup; I did not estimate it. FDA did not identify a clear positive E–R relationship for objective response rate (ORR). BTR and ORR are different outcomes (4, PDF pp. 310 and 314).
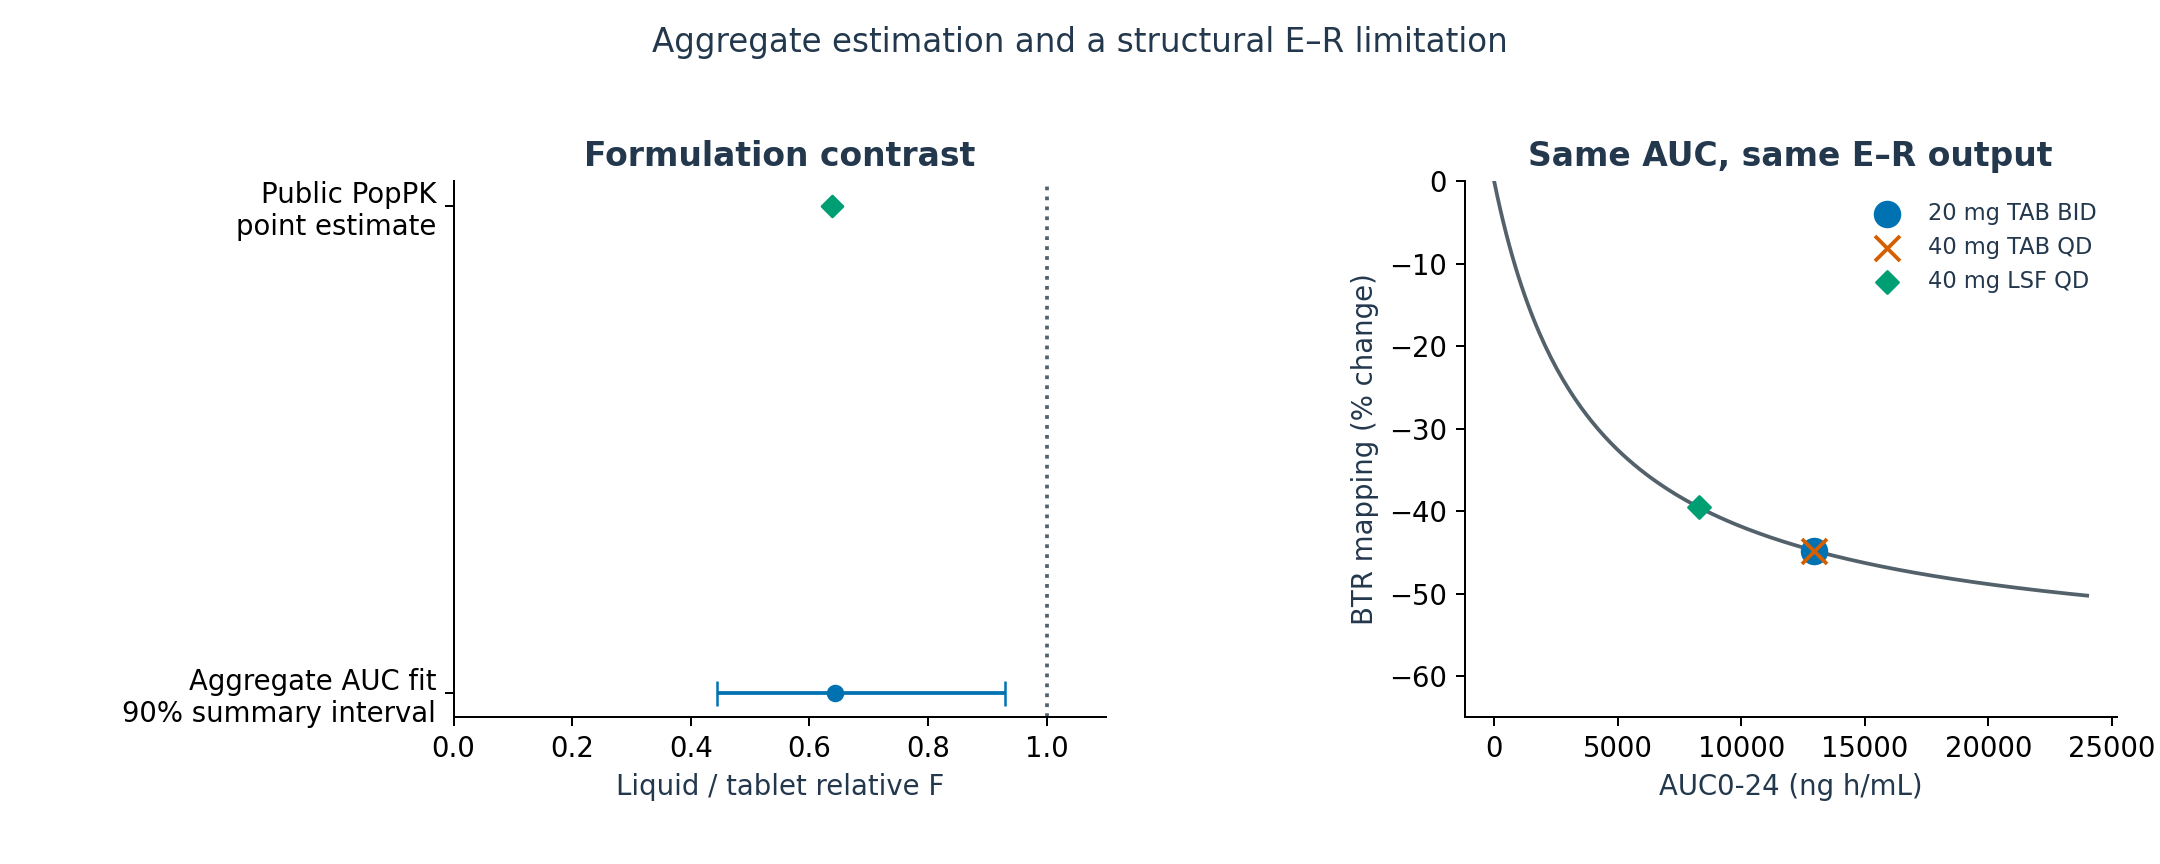
Figure 3. Left: relative F estimated from the formulation AUC ratio, with its aggregate-approximation 90% interval; the diamond is the published PopPK point estimate. This is not a meta-analysis of two independent studies. Right: a mathematical mapping of simulated AUC through the published BTR function, not a clinical prediction after regimen change. The two tablet-regimen symbols overlap.
Because tablet BID and QD have equal AUC, the function returns equal values for every virtual individual, although Cmin approximately halves and Cmax rises approximately 1.55-fold. Equal E–R output does not establish equal clinical efficacy. An AUC-only predictor has no mechanism for distinguishing concentration fluctuation at equal AUC.
The label describes associations of higher exposure with diarrhea and rash (2). I do not convert a peak difference directly into an adverse-event-rate difference. Public parent-drug PK alone cannot determine the efficacy consequences of lower minimum concentrations or the tolerability consequences of higher peaks.
Discussion
With the same tablet daily dose, changing frequency preserved 24-hour AUC while altering peaks and minima. Introducing liquid QD also changed relative F and therefore AUC. These are different comparisons and cannot be combined into a single frequency effect.
Existing AUC-only E–R information cannot evaluate concentration-profile differences at equal AUC. This analysis demonstrates neither preserved efficacy nor improved safety after changing frequency.
Numerical checks and limitations
Inputs record their sources, tables and PDF pages. Python code regenerates relative-F estimation, the main 4096-individual analysis, the 512-individual structural sensitivity analysis, tables and figures. Original review images and individual data are not distributed.
Run analysis/run_analysis.py for analysis and python -m unittest discover -s analysis -p "test_*.py" -q for verification. Tables are in outputs/tables/, estimates in outputs/fit.json and checks in outputs/verification.json.
The maximum relative difference between numerically integrated 24-hour AUC and mass-balance AUC was 0.012%. Halving the reference BID time step changed Cmax by 0.014%. Ten tests passed, covering periodic steady state, agreement with an independent ODE calculation, exposure windows, formulation F, covariate cancellation, structural E–R equality and single-dose diagnostics. These verify calculations, not external validity in patient data.
I did not use individual concentrations, a joint patient-covariate distribution or the original executable model. Only parent-drug plasma PK is represented, excluding metabolites, intratumoral concentrations and time-varying target binding. Formulation F is a conditional approximation from aggregate AUC0–24. It cannot establish efficacy or safety equivalence or identify an optimal regimen.
Data and code availability
Download code, aggregate inputs, results and rerun instructions.
References
- US Food and Drug Administration. FDA grants accelerated approval to sevabertinib for locally advanced or metastatic non-squamous non-small cell lung cancer. 2026 Sep 9. Approval announcement.
- Bayer HealthCare Pharmaceuticals Inc. HYRNUO (sevabertinib) tablets: US prescribing information. Revised 2026 Sep. DailyMed. Sections 2.2 and 12.2–12.3.
- US Food and Drug Administration. HYRNUO (sevabertinib), NDA 219972: Other Review(s). 2025. Review PDF. PDF p. 35.
- US Food and Drug Administration. HYRNUO (sevabertinib), NDA 219972: Multi-Discipline Review. 2025. Review PDF. PDF pp. 117–118, 293, 300, 310 and 314.