Matching RNA counts does not determine intracellular organization
A SubcellPert metric diagnostic uses real RNA coordinates to show spatial-shape differences after counts, centroids and covariance have been matched.
On this page
- Intracellular maps contain information absent from count tables
- Evaluation with and without true RNA counts
- Artificial arrangements with matched counts and moments
- Matching second moments leaves differences in shape
- Nuclear localization requires boundary information
- Count agreement and arrangement agreement are different properties
- Data and code availability
- References
Cells can contain the same number of RNA molecules while placing them differently. An expression-count table discards that distinction. As virtual perturbation models move from predicting amounts to predicting arrangements, the definition of a correct prediction must also change. Is matching a centroid sufficient, or matching the spread as well?
SubcellPert, released on 17 October 2026, benchmarks intracellular RNA arrangements. This article examines preprint version 1 and public code, then uses released astrocyte RNA coordinates to test what remains after matching counts, centroids and covariance (1, 2).
Intracellular maps contain information absent from count tables
The prediction target is two-dimensional coordinates of RNA molecules labeled by gene. Fourteen imaging datasets test responses across cellular backgrounds and intervention conditions. The measurement unit is within cells, rather than the arrangement of whole cells in tissue.
Images are not supplied directly. For each cell, coordinates are centered on the centroid of all RNA and divided by their root-mean-square radius. These are relative arrangements, not absolute cell sizes, distances from a nuclear membrane or three-dimensional heights (original section 3 and Appendix A.2).
An RNA molecule far from the origin is not necessarily cytoplasmic: the origin is the all-RNA centroid, not the nuclear center. Nuclear or cellular boundaries require separate measurements. Even an increase in the measured nuclear fraction could reflect transport, altered projected nuclear area or changed cell populations. More coordinates do not automatically identify a mechanism.
Evaluation with and without true RNA counts
The benchmark separates two questions.
Table 1. Conditions with and without access to true RNA counts.
| Setting | True RNA count available at prediction? | Question |
|---|---|---|
| Oracle | Yes | How accurately can arrangement be predicted with counts fixed? |
| Joint | No | How accurately can post-intervention counts and arrangement be predicted together? |
Oracle starts with correct counts and does not assess count-prediction accuracy. Models are trained separately, so Oracle is not a strict performance bound for Joint.
The paper compares resampling, classical transport and frozen foundation models with prediction heads. Gaussian transport achieves the lowest Oracle spatial error in eight of eleven held-out-cellular-background datasets. This is specific to the tested settings, not evidence that large models are unnecessary for every spatial task (original Fig. 4 and section 4.2). It motivates testing whether first and second moments suffice on measured coordinates.
Artificial arrangements with matched counts and moments
The following is neither model retraining nor replication of the Oracle benchmark. It gives artificial point clouds summaries of the true coordinates to diagnose metrics; it does not predict future arrangements.
The data are PF-Astro sample1, human pluripotent-stem-cell-derived astrocytes measured using Perturb-FISH (3). RNA coordinates and cell/gene assignments come from the public reconstruction released by SubcellPert’s authors (4).
The specimen contains 3,532 cells and 4,247,341 RNA molecules. I use 838 control cells and 361 ASXL3-intervention cells. ASXL3 is selected because it has the most cells among intervention conditions in the specimen, not because its spatial response appears largest. Conditions are pooled for metric diagnosis; their difference is not estimated as an intervention effect.
The five genes with the most control RNA molecules are VIM, HIF1A, FKBP10, ITGAV and CDC37. This selection is independent of apparent response differences. Retaining cell–gene pairs with at least 20 molecules yields 4,681 point clouds from 1,194 cells.
For each cloud, Gaussian replacement draws the same number of normal random points, while resampling draws the same number from observed points with replacement. Both are then affinely transformed to match the original centroid and covariance exactly. For proposed points \(U\) and original points \(X\),
\[ Y=(U-\bar U)\,\Sigma_U^{-1/2}\Sigma_X^{1/2}+\bar X \]
Covariance uses denominator \(n\), the molecule count. Matrix square roots are calculated using symmetric eigendecomposition; degenerate covariance is disallowed. Five random replicates are generated per pair. Distances are averaged across those replicates and then summarized as medians across cells for each gene. Replicates describe random-number variation, not biological replication.
Matching second moments leaves differences in shape
Across generated clouds, the maximum centroid difference is below \(4.5\times10^{-16}\) and maximum covariance-matrix difference below \(2.6\times10^{-15}\). Counts are identical. Those summaries therefore match to numerical precision.
Distances to observed point clouds remain. Table 2 reports median first Wasserstein distances between radial distributions measured from the all-RNA centroid. Units are normalized coordinate distances, not micrometers.
Table 2. Radial W1 between moment-corrected artificial and observed arrangements.
| Gene | Cell–gene pairs | Resampling radial W1 | Gaussian-replacement radial W1 |
|---|---|---|---|
| VIM | 1,192 | 0.043 | 0.197 |
| HIF1A | 1,080 | 0.061 | 0.139 |
| FKBP10 | 849 | 0.076 | 0.160 |
| ITGAV | 812 | 0.077 | 0.168 |
| CDC37 | 748 | 0.085 | 0.113 |
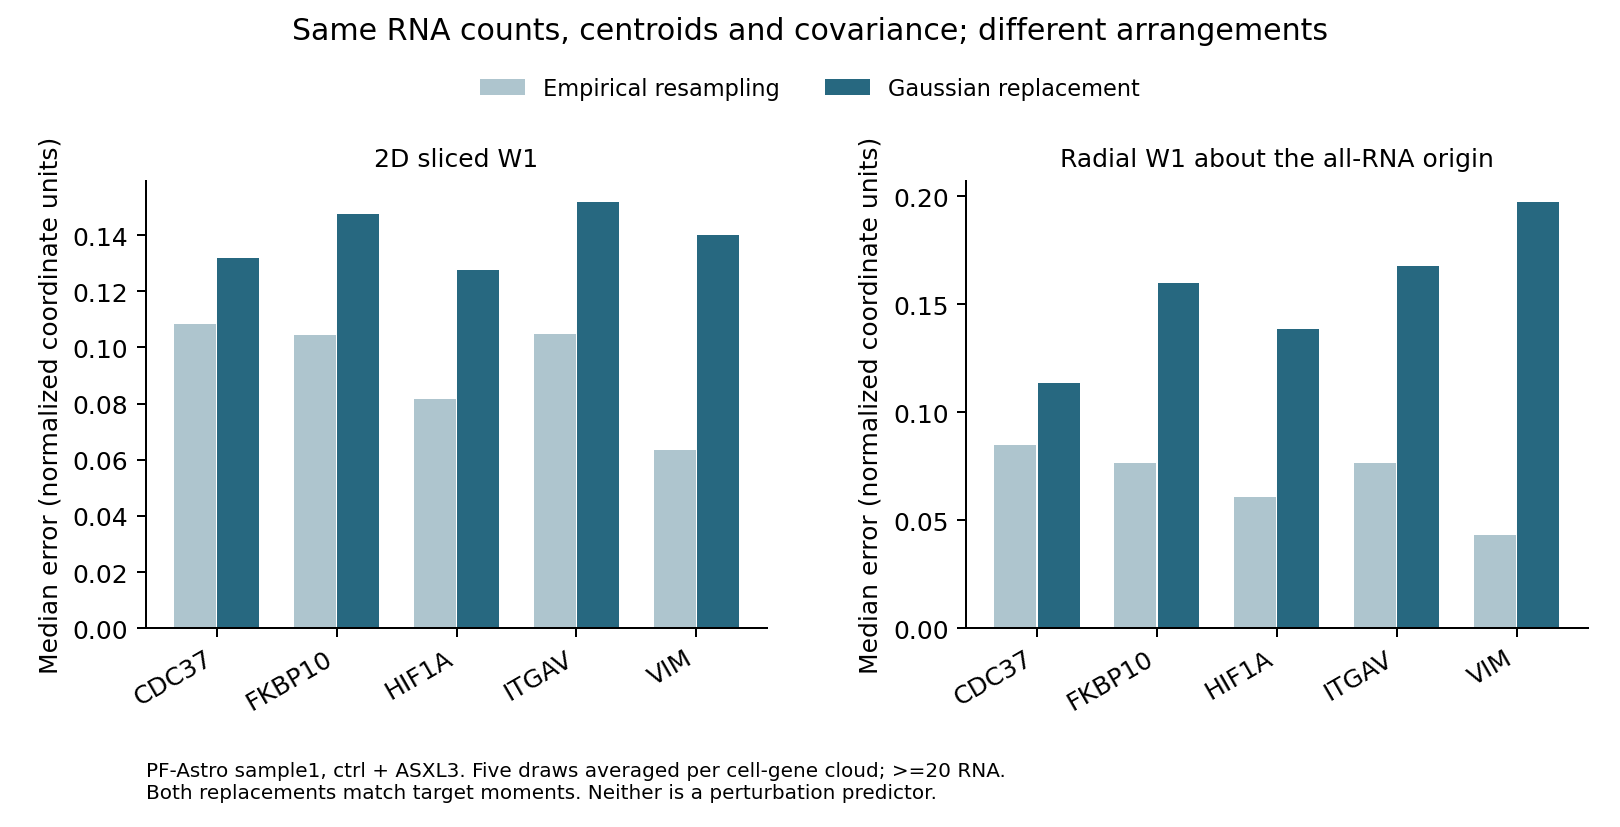
Figure 1. Sliced W1 and radial W1 for artificial arrangements with matched counts and moments. These are independent metric diagnostics, not errors from the original predictive models.
The left panel averages one-dimensional W1 across 32 projection directions to examine two-dimensional arrangement. The right panel uses radial distance only. These cell–gene-level diagnostics differ from the official benchmark’s weighted aggregation across genes and biological units.
Gaussian replacement has the larger median for all five genes. Increasing the minimum molecule count to 40 or 80 preserves this ordering, but CDC37 has only two eligible pairs at 80 molecules. A stricter threshold does not necessarily produce a stronger comparison.
Resampling distances are nonzero because finite molecular samples change when resampled. Reusing observed points also means this is not an estimate of independent remeasurement error. The larger Gaussian distance diagnoses shape information beyond second moments in this specimen; it is not a general significance test between models or an intervention effect size.
Artificial clouds are not constrained by actual cell boundaries. They neither reproduce cell shape nor necessarily represent biologically possible RNA arrangements.
Nuclear localization requires boundary information
The result does not favor radial distance to the exclusion of other summaries. Points equally far from the origin can lie along axes or diagonals. Radial distributions cannot distinguish orientation. The accompanying tests include clouds with identical centroid, covariance and radii but different projected distributions.
Amount, centroid, spread, radius and direction summarize different properties. A small aggregate spatial error need not resolve the localization question for a particular RNA. Likewise, a gene missing from predictions cannot be assigned zero spatial error. Prediction coverage must be considered before scoring the common gene set. The public code explicitly distinguishes coverage from shared-gene spatial scores (evaluation specification).
Count agreement and arrangement agreement are different properties
This example retains shape differences after matching RNA counts, centroids and covariance, demonstrating information lost by count aggregation in the same specimen. Coordinate differences do not alone establish RNA-transport mechanisms: segmentation, measured gene panels, detection, cellular shape and population composition can also change distributions. Normalized coordinates cannot recover absolute movement distances, and nuclear boundaries remain necessary for nuclear/cytoplasmic classification.
SubcellPert expands evaluation of spatial prediction. It does not turn snapshots of different cells into trajectories of the same RNA molecules.
Data and code availability
The diagnostic code and aggregate inputs include point-cloud diagnostics, random-replicate averages, plotting and test code, and instructions for acquiring source data. Original images, RNA coordinates, cell annotations and trained models are not bundled.
inputs/provenance.json records source version, downloaded-file SHA-256 hashes and selection criteria. REPRODUCE.md documents dependencies and regeneration after data acquisition. This is an independent diagnostic using measured coordinates from one specimen, not a reproduction of the paper’s 608 training runs.
References
1. Wang J, Cao H, Dang X, Zhou T, Zhao Y, Hsieh CY, et al. SubcellPert: benchmarking subcellular perturbation prediction. bioRxiv. 2026 October 17. Version 1. doi:10.64898/2026.10.11.758305. Preprint.
2. king159. SubcellPert. GitHub repository. Source code and evaluation specification.
3. Binan L, Jiang A, Danquah SA, Valakh V, Simonton B, Bezney J, et al. Simultaneous CRISPR screening and spatial transcriptomics reveal intracellular, intercellular, and functional transcriptional circuits. Cell. 2025;188:2141–2158.e18. doi:10.1016/j.cell.2025.02.012.
4. king159. SubcellPert datasets: PF-Astro reconstruction. Hugging Face. Dataset repository.