Does a readable perturbation label imply a predictable cellular response?
PerturbEnergy label accuracy and expression prediction are compared using reported results and a one-dimensional counterexample with explicit transfer limits.
On this page
An AI model compresses treated cells into a latent space. If a classifier can recover drug labels from that space, it is tempting to conclude that the model represents drug responses well. But label information and information determining which genes change, and by how much, need not coincide.
PerturbEnergy, released as a preprint on 13 October 2026, explicitly shapes perturbation-specific latent representations. This article examines version 1, not a peer-reviewed publication (1).
Energy is a model score rather than cellular thermodynamics
PerturbEnergy separates basal and perturbation-related representations, changing the latter’s prior using a conditional energy function. Probability shifts toward latent representations compatible with the supplied perturbation (original Eq. 4).
This energy is a neural-network score. It is neither measured cellular free energy nor a drug–target binding free energy; lower energy does not establish biological stability. The design addresses a real representational issue: cell type and culture conditions may dominate perturbation effects. Encouraging retention of relevant information differs from merely enlarging the decoder.
The inputs nevertheless matter. The released PertEncoder combines a basal representation with a perturbation embedding. Recovering the label from that representation alone is insufficient evidence of reproducing the observed biological response. Supplying labels is legitimate for conditional prediction; the distinction concerns what the evaluation measures (2; inspected encoder).
Identical classification accuracy can accompany opposite response errors
The following independently constructed one-dimensional example isolates distribution tilting by conditional energy. It does not reproduce trained PerturbEnergy models or biological data. Let equally frequent labels be \(a\in\{-1,+1\}\), with a standard normal baseline latent distribution and energy
\[ E(z,a)=\frac{\lambda}{2}(z-a)^2,\qquad \lambda\geq0 \]
The parameter \(\lambda\) controls attraction toward the label. Defining
\[ p(z\mid a)\propto\exp(-z^2/2)\exp\{-E(z,a)\} \]
and completing the square gives
\[ z\mid a\sim N\left(\frac{\lambda}{1+\lambda}a,\frac{1}{1+\lambda}\right) \]
Using the sign of \(z\) to classify labels yields accuracy
\[ P(\widehat a=a)=\Phi\left(\frac{\lambda}{\sqrt{1+\lambda}}\right) \]
where \(\Phi\) is the standard normal cumulative distribution function. Stronger attraction improves classification.
Now let the target response be \(y=a\). Write the conditional latent mean as \(m_a=\lambda a/(1+\lambda)\) and predict mean response as \(\widehat y=g\,m_a\). Fix three decoder directions: correct (\(g=+1\)), ignoring the latent variable (\(g=0\)), and reversed (\(g=-1\)).
All use the same latent distribution and thus the same classification accuracy. Their mean-response error differs:
\[ \mathrm{RMSE}=\left|1-g\frac{\lambda}{1+\lambda}\right| \]
This compares condition means; individual latent-sample variance is not added to RMSE.
Table 1. One-dimensional example with identical latent distributions and different decoders.
| Attraction strength \(\lambda\) | Label accuracy | Correct-direction RMSE | Ignoring latent variable | Reversed-direction RMSE |
|---|---|---|---|---|
| 0 | 50.0% | 1.00 | 1.00 | 1.00 |
| 1 | 76.0% | 0.50 | 1.00 | 1.50 |
| 4 | 96.3% | 0.20 | 1.00 | 1.80 |
| 16 | Approximately 100.0% | 0.06 | 1.00 | 1.94 |
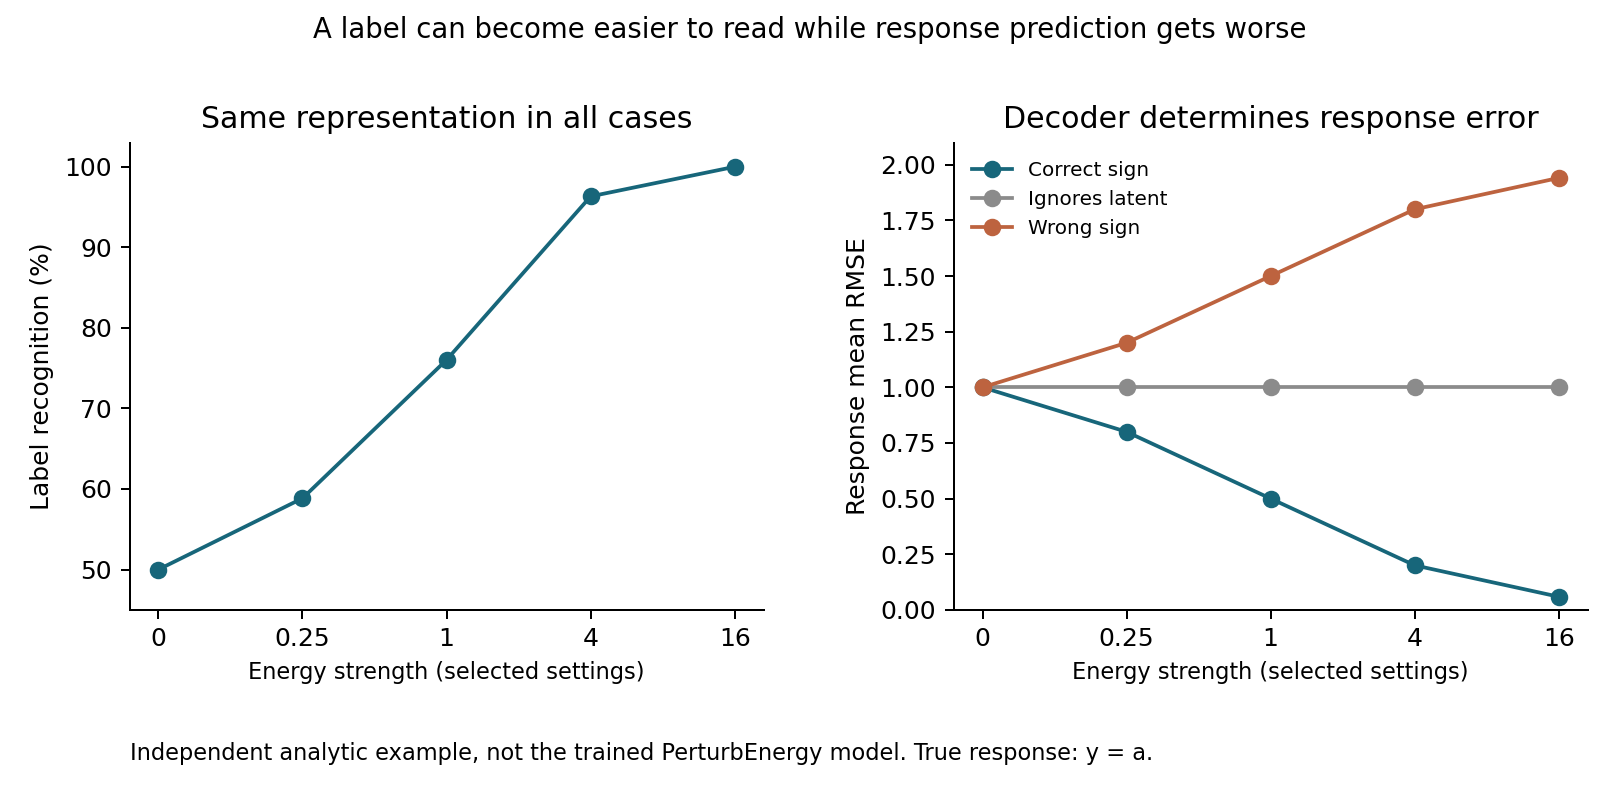
Figure 1. Accuracy rises for the same latent representation while response RMSE improves, stays constant or worsens according to decoder direction. This independent example does not reproduce the original model.
The reversed decoder is deliberately artificial and might be corrected by response training. Its role is a logical counterexample: improved label accuracy alone does not imply improved response predictions. It does not claim PerturbEnergy predicts in the wrong direction. The link between retained labels and actual responses still requires evaluation.
What improves by 83.2%?
In original Table 3, Replogle latent-label accuracy increases from 28.6% for PerturbedVAE to 52.4% for PerturbEnergy-Mis. The relative increase is
\[ 100\times\frac{52.4-28.6}{28.6}=83.2\% \]
The absolute increase is 23.8 percentage points. Neither quantity is a reduction in gene-expression prediction error or a drug-candidate success rate.
The paper does evaluate expression prediction, across drug, genetic and cytokine perturbations. I recalculated comparisons using RMSE on the true top 50 differentially expressed genes in original Table 2, selecting the minimum reported value among existing methods separately for each dataset. Input files contain all 12 methods, and code selects comparators. Lang denotes Langevin negative sampling; Mis constructs negatives using another perturbation.
Table 2. Recalculation of original top-50-DEG RMSE results.
| Dataset | Lowest existing-method RMSE | PerturbEnergy-Lang | PerturbEnergy-Mis |
|---|---|---|---|
| Replogle | 0.2024 (STATE) | 0.1870 | 0.1780 |
| PBMC | 0.0729 (stVAE) | 0.0637 | 0.0654 |
| Tahoe100M | 0.3293 (stVAE) | 0.3114 | 0.3123 |
| Norman2019 | 0.1248 (PerturbDiff) | 0.1434 | 0.1376 |
Relative to the best existing result, RMSE is 12.1% lower for Replogle with Mis, 12.6% lower for PBMC with Lang, and 5.4% lower for Tahoe100M with Lang. Norman2019 with Mis is 10.3% higher. Choosing the better variant per dataset does not show one variant is best everywhere (original Table 2).
These are calculations from reported means, not retraining results. Although the original table reports standard errors across groups, paired condition-level errors are unavailable here, so I do not calculate between-method significance tests or confidence intervals for differences.
The “true top 50 DEGs” are selected from measured responses. Error within that supplied set is distinct from identifying responsive genes. A model could predict the specified genes well while failing to discover the relevant set. Candidate selection requires distinguishing gene discovery from response-magnitude prediction.
What is unseen at evaluation?
According to Appendix A.3.1, 30% of perturbations from evaluation cell lines or donors are returned to training for Replogle, PBMC and Tahoe100M. Perturbation labels are observed somewhere in training, and the remaining conditions test transfer. Norman2019 holds out combinations of individually known genes.
This does not directly test responses to entirely new compounds. Transferring a known drug to another cell background differs from extrapolating to a new compound. With a learned label table, a previously unseen compound still needs a representation, perhaps from chemical structure, targets or a few measured responses. Each option requires different data and evaluation splits. These results do not jointly validate unseen compounds, concentrations and time points.
Label separation is not biological response separation
Drugs sharing a mechanism can produce similar responses despite distinct labels. The same drug can produce different responses at different concentrations or sampling times. A representation optimized for label recovery need not preserve all biologically relevant distinctions.
The reported expression-RMSE improvements in transfer settings do not establish better follow-up hit rates, survival predictions or avoidance of unwanted responses. A gap remains between latent separation and useful candidate selection.
Data and code availability
The calculation code and inputs contain top-50-DEG RMSE and standard errors extracted from original Table 2, recalculated comparisons, and analytic expressions, plotting code and tests for the one-dimensional example. Original text, figures, trained models and cell datasets are not bundled.
Numerical integration checks the example’s means and variances, and simulated classifications provide another comparison. These checks are separate from replication of PerturbEnergy. REPRODUCE.md records execution conditions and limitations. The inspected public-code commit is 0d0e32e80f0aecb43a439b5ad92bb8e167f73865.
References
1. Yan Y, Bian Y. Learning perturbation-specific representations through conditional energy prior for cellular response prediction. arXiv. 2026 October 13. Version 1. arXiv:2610.18456v1. Preprint.
2. BlueWhaleLab. PerturbEnergy. GitHub repository. Commit 0d0e32e80f0aecb43a439b5ad92bb8e167f73865. Source code.