How can AI predict cellular responses to drugs that have not been profiled?
A descriptive audit of published MAP scores for 16 held-out drugs and four knowledge-pretraining stages, distinguishing unprofiled compounds from unseen structural or mechanistic groups. No model training or inference was performed.
On this page
- An unprofiled drug can still have a structural input
- Holding out drugs is different from holding out structural series
- A higher average across 16 drugs does not mean winning every evaluation
- One discrepancy in the published means
- Knowledge-learning increments are not isolated mechanism contributions
- Correlation does not determine the magnitude of expression change
- Recalculation and materials
Which genes change when a new compound is added to cells? Predictions for compounds without RNA measurements could help narrow experimental candidates. But an unseen drug name does not necessarily mean an unseen structure or mechanism.
MAP, published in August 2026, incorporates drug and gene knowledge into representations for predicting transcriptional responses (original paper).
I read the study by distinguishing information withheld from information still available. Here I recalculate public Source Data for 16 drugs, six methods and five evaluations. I did not train or run the models. Reinterpretation of published scores is distinguished from conditions I would ask of further validation. Sources were checked on 2026-10-12.
An unprofiled drug can still have a structural input
A model representing drugs only as identifiers cannot interpret a new identifier. Molecular structure provides a way to use similarities to training compounds. MAP's knowledge learning connects structures, protein sequences and descriptive text, then uses the resulting representation for response prediction.
Pretraining information is different from prediction-time input. The official demo I inspected passes control-cell inputs, a compound's SMILES and concentration to the predictor. I did not execute it, but the code establishes an interface different from looking up a known drug identifier.
Two possible routes to an unmeasured compound's response remain distinct: resemblance to responses of structurally similar known compounds, and relationships learned through knowledge that structure alone may not capture. Both may operate. Better performance after adding knowledge does not by itself establish discovery of a new mechanism.
Holding out drugs is different from holding out structural series
The paper evaluates both unseen drug–cell combinations and drugs whose transcriptional responses are excluded entirely from training. For the latter, it also states that test drugs, synonyms and related edges are removed from knowledge learning. The calculations below concern that setting (evaluation design).
| Information held out | Information still available | Question addressed |
|---|---|---|
| Drug–cell combination | The same drug's measured responses in other cells | Transfer across cell backgrounds |
| The drug's transcriptional responses | Structure, learned representation and other drugs' responses | Prediction for an unprofiled drug |
| Structural series | Distant structures and known targets/pathways | Prediction less dependent on close analogues |
| Mechanism-of-action group | Structure and drugs with other mechanisms | Prediction beyond known mechanism groups |
The last two rows are additional evaluations proposed here. MAP's drug holdout does not automatically hold out structural series or mechanisms. A different identifier can still have a close analogue in training.
That is not inherently leakage. Knowledge of analogues is legitimate when improving a chemical series. Extending results from analogues to new structures or mechanisms requires evaluation in that intended scope.
I also inspected the official knowledge-data loader, but did not reproduce the pairing of split knowledge graphs and checkpoints. A stated exclusion in a paper is different from verifying that exclusion in a particular executable artifact.
A higher average across 16 drugs does not mean winning every evaluation
I used the Fig_3c sheet in the Source Data. This evaluates unprofiled drugs in six Tahoe-100M cancer cell lines using pseudobulk scores. It does not evaluate individual cell fates or every cell type. For each drug, MAP, CRISP, ChemCPA, PRnet, trainMean and XPert have Pearson delta correlations for the top 50 differentially expressed genes. Differential expression is the drug–control change; delta correlation measures agreement between predicted and observed gene-wise changes. This expression delta differs from the between-method correlation difference calculated below.
For each of all 16 drugs, I selected the comparator with the highest published mean, held it fixed and subtracted its score from MAP's in each of five evaluations. Selection used the evaluation outcomes, so this is a descriptive comparison of published results, not a model-selection procedure available for an unknown candidate.
\[ d_{j,e}=r_{\mathrm{MAP},j,e}-r_{\mathrm{comparison},j,e}. \]
Here \(j\) denotes drug and \(e\) evaluation. Plot points are mean \(d\) calculated from the five published rounded values.
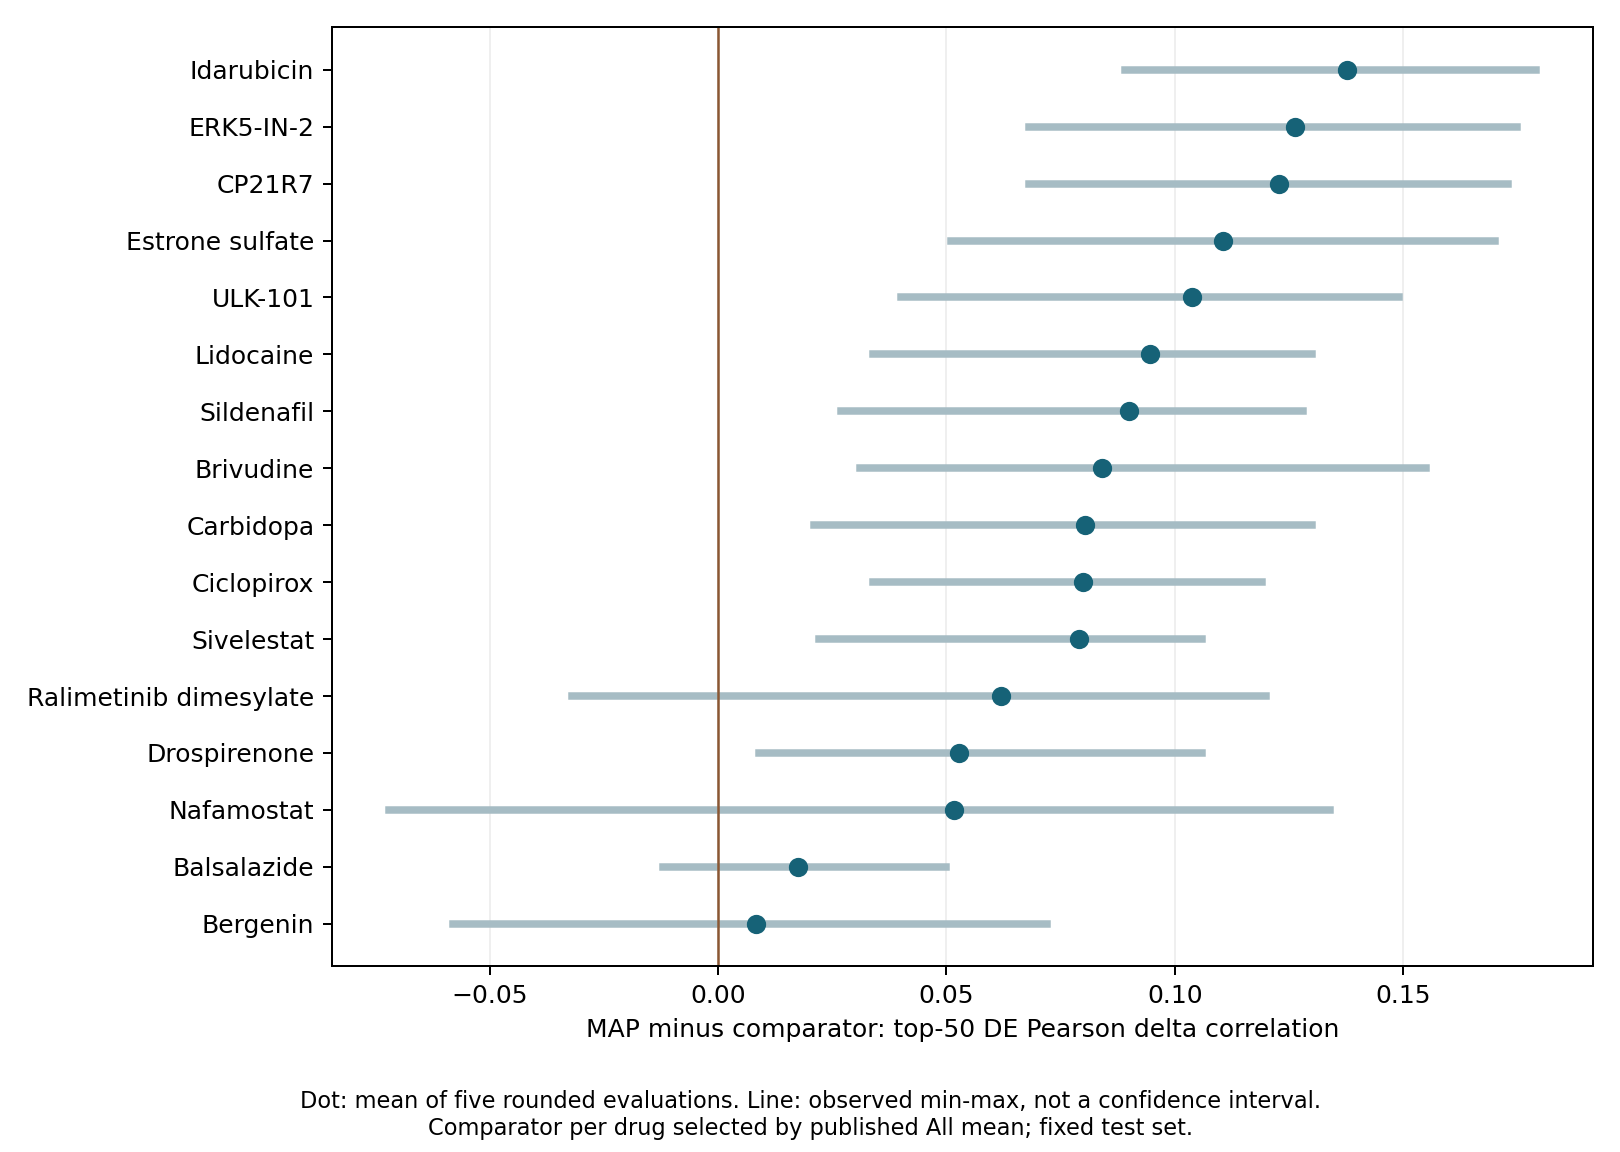
Figure 1. Original recalculation showing all 16 drugs. Lines span the minimum and maximum of five differences, not confidence intervals. Comparators differ between drugs but are fixed across a drug's five evaluations; they are recorded in results/drug-comparisons.csv.
MAP exceeds the comparator in the published mean for all 16 drugs. Recomputing the means from the five rounded values preserves that conclusion. Only 12 drugs, however, have a positive difference in every evaluation.
| Drug | Comparator | Mean correlation difference | Minimum–maximum | Evaluations with positive difference |
|---|---|---|---|---|
| Bergenin | XPert | 0.0084 | −0.058–0.072 | 3/5 |
| Balsalazide | CRISP | 0.0176 | −0.012–0.050 | 3/5 |
| Nafamostat | XPert | 0.0516 | −0.072–0.134 | 4/5 |
| Ralimetinib dimesylate | XPert | 0.0620 | −0.032–0.120 | 4/5 |
This does not negate the mean advantage. Its magnitude varies by candidate, and small differences can change sign between evaluations. One overall mean does not imply a uniform improvement for every compound.
The five evaluations use the same fixed test set. Differences were paired by the evaluation indices in the table, but the scores alone do not verify what was randomized, or whether methods shared seeds or sampled cells. These are not five additional patients or independent experimental systems. They cannot estimate success across all unknown drugs or biological uncertainty. The differences are correlation units, not percentage improvements in drug efficacy.
One discrepancy in the published means
I checked all 96 published means (16 drugs × six methods) against the corresponding five values. MAP's published mean for drospirenone is 0.941, whereas their mean is 0.9346. The 0.0064 difference is difficult to explain by rounding both values to three decimal places alone.
I did not replace the published value as an established error. The available scores do not determine whether another aggregation procedure or a reporting issue explains it. Both values remain in the distributed CSV. The comparator difference stays positive: 0.059 using published means and 0.0528 after recalculation.
Input and aggregation consistency matter when tiny score differences are used to choose candidates. This discrepancy does not change the mean advantage across all 16 drugs; more decimal places do not make a comparison more certain.
Knowledge-learning increments are not isolated mechanism contributions
I also read unprofiled-drug correlations in the Fig_5a Source Data sheet. PrimeKG is an existing biomedical knowledge graph; MAP-KG integrates drugs, genes and their relationships for this study. Published means are 0.321 with random initialization, 0.734 after adding MoleculeSTM, 0.747 with PrimeKG and 0.822 with MAP-KG.
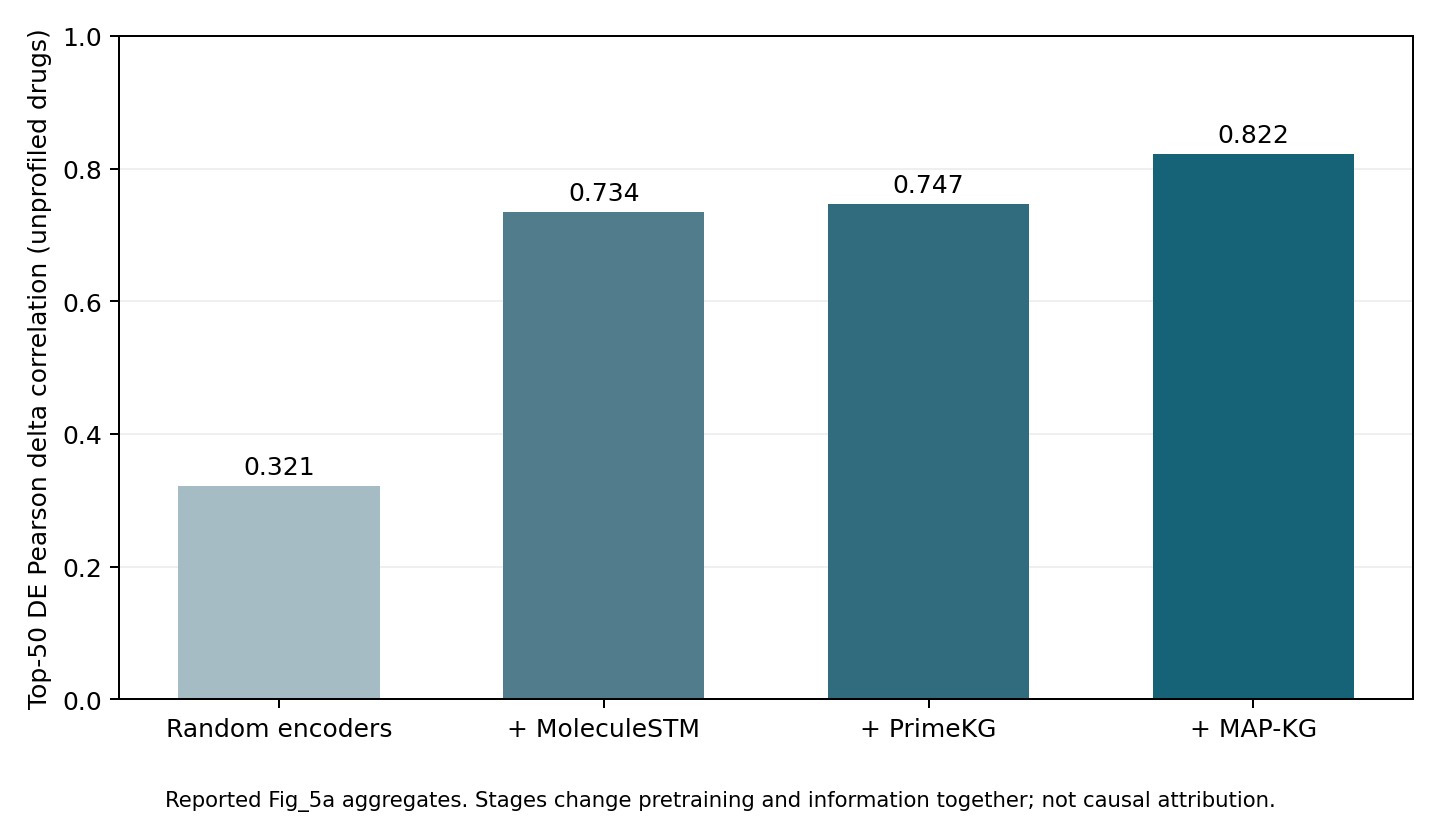
Figure 2. Original plot of four public conditions. Successive correlation differences are 0.413, 0.013 and 0.075. They are correlation units, not causal fractions attributable to knowledge.
The large first difference includes the introduction of molecule–text pretraining. Later differences also change learning content and amount. The 0.413 cannot be assigned to structure alone and the 0.075 to target mechanisms alone.
I read this as evidence that prediction changes when information and pretraining conditions change. Which relationship improves which drug remains a question for information-matched controls and per-drug evaluation. A prediction consistent with mechanisms differs from identifying a mechanism from predictions.
Correlation does not determine the magnitude of expression change
Doubling every true change still gives Pearson correlation one when the changes are nonconstant. A correlation advantage does not establish correct ranking of drug-induced change magnitudes.
The top 50 genes selected from measured responses can diagnose recovery of changed genes, but are unknown when predicting an unprofiled drug (gene-selection procedure).
These Source Data are score tables. I did not recompute errors on a common gene set, drug discrimination or performance by structural distance. The mean advantage for 16 drugs is supported; the structural distances over which it persists are unresolved by this table.
Recalculation and materials
Input CSV, recalculation code, figures and results are available. python analysis.py uses only the standard library; figure regeneration uses matplotlib. The inputs are 600 public scores with source-sheet and cell locations retained.
This is descriptive score recalculation and static reading of official code. It does not execute the model, reproduce evaluation from cell-level data, add independent test drugs or estimate clinical effects.
Sources are the MAP paper, supplement and official code, checked at 629ebdc. The package excludes the original paper, figures, Source Data workbook, official code and model weights.
Cite this article
Kumakura, D. (2026). How can AI predict cellular responses to drugs that have not been profiled? daikikumakura.github.io. https://daikikumakura.github.io/writing/map-unprofiled-drugs-en.html