What changes when 100 assay labels are added to Boltz-2 candidate selection?
An independent aggregation of released predictions for eight MF-PCBA targets examines affinity-head adaptation, top-100 hit recovery, rescoring budgets and a nearest-active comparison. No model inference, retraining or prospective experiments were performed; scaffold annotations are author supplied.
On this page
Ranking tens of thousands of compounds with AI does not mean that all of them can go into an assay. If the next experiment can test only 100, the useful question is how many active compounds those 100 will contain.
Boltz-2 predicts a protein–small-molecule complex and scores related to binding. Once results return for an initial batch of 100 compounds, can those measurements improve the next ranking?
A preprint by Furui and Ohue examined this question using existing screening data for eight targets. I reaggregated the author-released per-compound predictions. With 100 labels for adaptation, the mean number of active compounds among the next 100 selections rose from 10.75 to 20.75. These are retrospective ranking results from existing measurements and predictions, rather than results from new experiments.
Where the assay results enter
The measurements used here are binary active/inactive labels under each assay's conditions. They are neither drug effect sizes nor measured binding constants.
The procedure first ranks compounds with Boltz-2, then uses labels for the top 40, 100 or 300 to adapt the scoring components. The trunk that produces complex representations and the structure-generation components remain frozen; two affinity heads are updated. These heads produce binding-related scores from saved structures and internal representations. The evaluated ranking uses the mean of the two heads' predicted probabilities (original paper methods; public implementation).
An inactive compound that initially received a high score also contributes a training example. This is not a procedure trained only on active compounds.
The official Boltz-2 documentation distinguishes the probability-related binding output from the affinity-value output. Adaptation to binary activity labels cannot be read as improved accuracy of binding constants. Whether adapted scores are calibrated to actual positive rates is also a separate question from improved ranking.
Train on the first 100 and evaluate the next 100
The measurements come from the MF-PCBA screening benchmark. According to the paper's data section, the eight targets were selected from ten previously evaluated assays, excluding cases such as those for which a binding pocket could not be specified. They are not a random sample of arbitrary targets.
The released data distinguish compounds used for adaptation from compounds used to evaluate candidate selection. I retained that distinction.
The top 300 compounds in the initial ranking are excluded from evaluation in every condition. Even when only 40 labels are used for adaptation, the remaining 260 do not return to the evaluation pool. This common pool contains about 49,600 compounds per target, with positive rates of about 0.27–1.92%. The 100 adaptation labels contain between 4 and 52 active compounds depending on the target. A budget of 100 labels therefore supplies quite different positive/negative compositions (public data column definitions).
The “next 100 candidates” below are 100 compounds selected from this common evaluation pool. They exclude active compounds already discovered in the initial training measurements. A 100-label adaptation batch followed by another 100 measurements requires at least 200 planned measurements, before preprocessing, validation measurements, repeats and hit confirmation.
Top-100 hits and AP answer different questions
I calculated average precision (AP), enrichment in the top 1% and the active count in the top 100 from the released predictions, then checked these against the authors' saved results. I did not run model inference or train the heads.
| Adaptation labels | AP: unadapted → adapted | Geometric mean of per-target AP ratios | Active compounds in the next 100: unadapted → adapted |
|---|---|---|---|
| 40 | 0.0523 → 0.0685 | 1.24× | 10.75 → 17.63 |
| 100 | 0.0523 → 0.0869 | 1.56× | 10.75 → 20.75 |
| 300 | 0.0523 → 0.1339 | 2.14× | 10.75 → 34.38 |
AP and active counts are arithmetic means across eight targets. The fold changes are geometric means of ratios calculated separately for each target, rather than ratios of the mean AP values in the table. The accompanying CSV gives the individual target results.
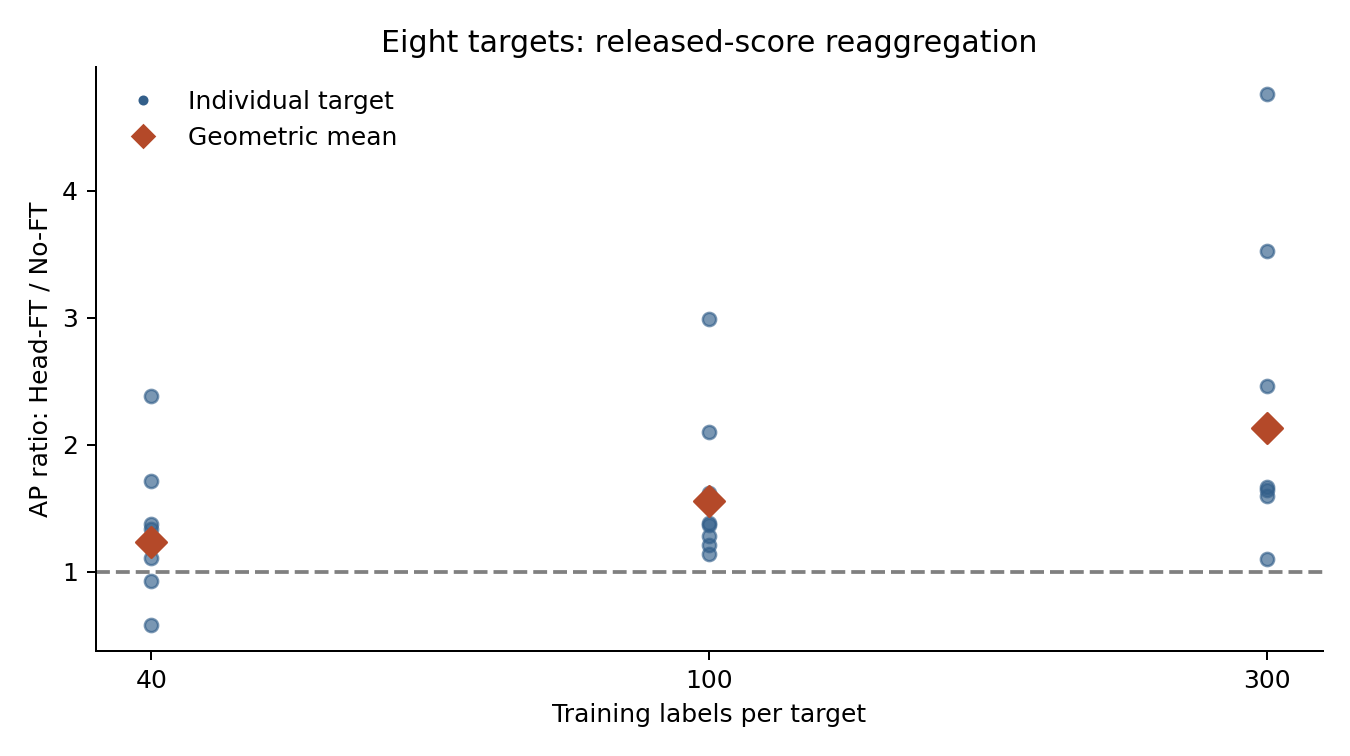
Figure 1. Each point is a target; each diamond is the geometric mean of eight AP ratios. The dashed line at one indicates no improvement.
Precision is the active fraction among selected compounds. Recall is the fraction recovered out of all active compounds in the evaluation pool. AP summarizes precision and recall as the selection expands down the ranking. An AP of 0.0869 does not mean that 8.69% of the next 100 compounds will be active. For a measurement budget of 100, look directly at the active count and precision at that position. In the 100-label condition, mean precision was 20.75/100, or 20.75%.
Top-1% enrichment divides the active fraction in that selected fraction by the active fraction in the whole evaluation pool. Here the top 1% contains about 496–497 compounds, a different selection budget from the top 100. A metric's improvement ratio and the number of compounds entering an experiment should not be conflated.
The figure also retains variation between targets. Adding the same number of labels does not produce a uniform effect. The trend across eight targets is not a guarantee of the same improvement on a new target.
Must every compound be rescored?
A second question is whether an unadapted No-FT ranking can shortlist compounds for rescoring by the adapted heads. Let M be the number rescored and 100 the final selection size. The No-FT ranking here is distinct from the initial standard-inference ranking used to choose training compounds.
I took the top M compounds according to the released unadapted scores and reranked that subset using adapted scores. With 300 adaptation labels and M=5,000, the mean active count was 34.75, close to the 34.38 obtained by rescoring the entire evaluation pool.
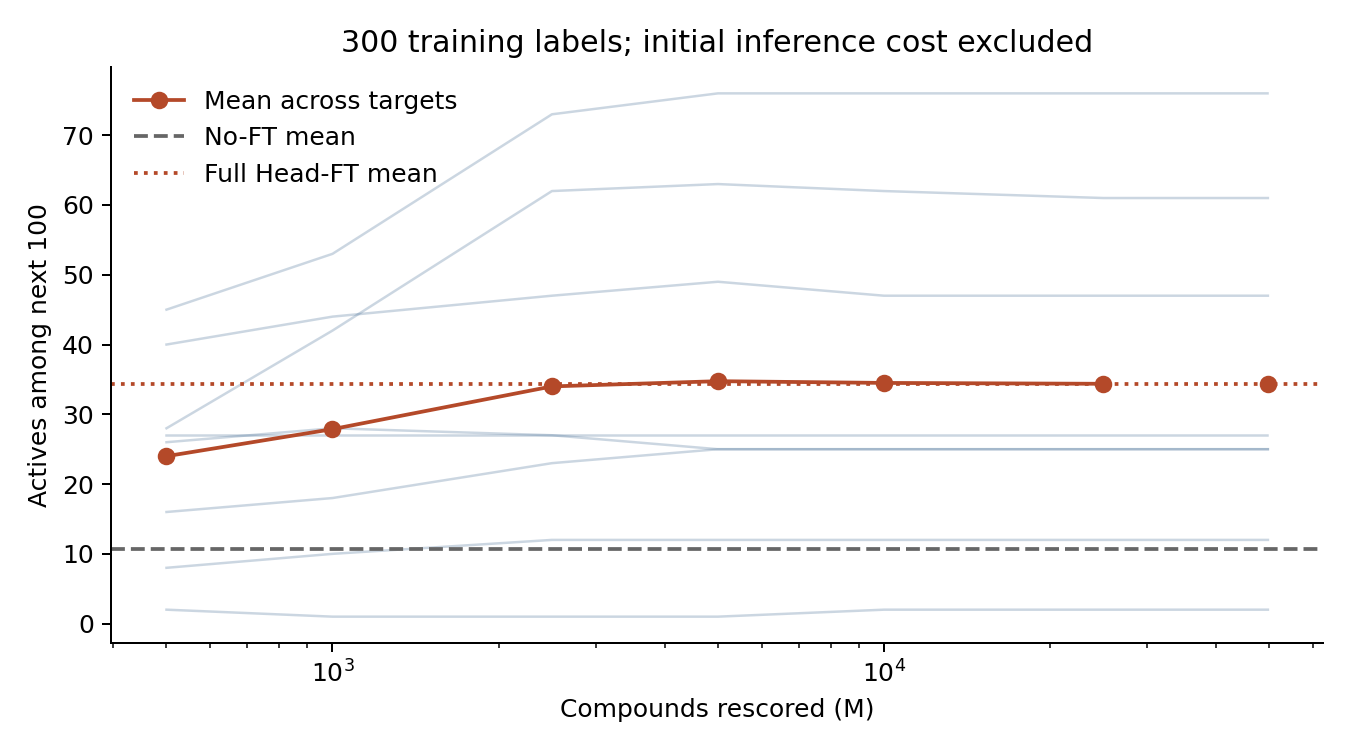
Figure 2. The 300-label condition. Thin lines show individual targets and the thick line their mean. Dashed and dotted lines indicate the unadapted and full-pool rescoring means, respectively. The horizontal axis is logarithmic.
Increasing M need not increase the active count. Newly admitted compounds can include inactive compounds with high adapted scores. The slightly higher mean for 5,000 than for the full pool does not establish a general advantage of scoring fewer compounds.
Conversely, compounds discarded at the shortlisting stage cannot be recovered by a better subsequent ranking. If A(M) is the number of active compounds in the top M of the No-FT ranking, the top-100 active count obeys
\[ H_{100}(M) \leq \min\{100, A(M)\} \]
Reporting this bound beside observed recovery separates losses at the entry stage from poor ordering among compounds that remain. The accompanying code outputs the recovery, remaining active count and bound for each M.
Reducing roughly 50,000 compounds to 5,000 cuts additional head evaluations by about 90%. This assumes that initial Boltz-2 inference, representation storage, label acquisition and adaptation have already taken place. It is not a measured 90% reduction in total runtime or drug discovery costs.
For example, let C0 be common costs such as initial inference, c the cost per head evaluation and n the size of the evaluation pool. The cost difference between full rescoring and M-compound rescoring is c(n−M). The fraction saved out of total costs is
\[ \frac{c(n-M)}{C_0+cn} \]
and shrinks as C0 grows. This equation decomposes costs; it does not estimate measured costs in this study.
Give similarity search the same labels
Assay labels have uses beyond adapting Boltz-2. A necessary comparator is selecting compounds similar to known actives.
Restricting the authors' scaffold-recovery CSV to 300 labels and the next 100 candidates gives the means below. These are aggregations of the authors' scaffold annotations; I did not recalculate molecular scaffolds or similarities.
| Method | Active compounds | Active compounds with scaffolds absent from the training set |
|---|---|---|
| Unadapted Boltz-2 | 10.75 | 7.63 |
| Adapted heads | 34.38 | 22.13 |
| Maximum similarity to a known active | 34.75 | 13.75 |
Source: author-released scaffold-recovery CSV. Similarity uses Morgan fingerprints and the Tanimoto coefficient; scaffolds follow the Bemis–Murcko definition. The right column counts active compounds, not distinct scaffolds: multiple compounds sharing a scaffold count separately.
For total hit recovery, mean similarity-search performance was no worse than that of the adapted heads. The adapted heads recovered more active compounds with scaffolds absent from training. The interpretation depends on whether the aim is to collect as many actives as possible or to retain candidates with different scaffolds. These mean differences alone do not establish statistical superiority.
A compound with a scaffold absent from training can still share substructures with known compounds. An unseen scaffold and low similarity are different conditions. Nor does a new scaffold establish a new mechanism of action or patentability.
Comparisons with conventional supervised models should begin with the same compounds and labels. Model selection, iteration budgets, pretrained information and compute should then be matched or their differences explained. Comparing an adapted model only with a model that receives no labels does not determine the best use of those additional labels.
What the reaggregation establishes
The improvement concerns existing activity labels and saved scores. The unadapted comparator uses the same saved structures, internal representations and scoring path as the adapted heads. The initial ranking used to choose training compounds comes from standard inference and differs from the unadapted evaluation ranking.
The original study uses the bottom 20 compounds in the evaluation pool's initial ranking for validation during training and evaluates a fixed final epoch. This is not identical to never accessing any labels from the final evaluation pool. I retained the original split. Each adaptation condition was trained once, so variation across targets cannot identify sensitivity to retraining seeds.
Candidate selection improved in the saved predictions. Whether the gain reproduces on a new target, or exceeds similarity search given the same labels, remains unresolved by this reaggregation alone.
Code and sources
Inputs are prediction CSVs for eight targets and author reference summaries pinned to BoltzFT commit a31c79a8420c1156a876f007dbdc52107cd0e957. I recalculated and checked AP and top-1% enrichment, and verified recovery under additional rescoring. Ties for top-100 and two-stage selections follow the released evaluation order. Top-1% enrichment uses the NumPy 1.26.4 default sort to match the authors' saved values. Probability calibration, head retraining and wet-lab experiments were not performed.
Download the aggregation code, results and figures. The approximately 98 MB of compressed input CSVs are not bundled; the retrieval script downloads pinned versions. Author-derived summary data retain their original license. Figures were drawn for this article from public numerical data.
- Furui K, Ohue M. Adapting Boltz-2 with limited experimental activity data improves early enrichment in virtual screening. September 21, 2026. Preprint v1; this article examines that version.
- BoltzFT: code, per-compound predictions, evaluation splits and reference summaries. MIT License.
- Boltz-2 official prediction/output documentation. See the distinction between binding probability and affinity-value outputs.
Cite this article
Kumakura, D. (2026). What changes when 100 assay labels are added to Boltz-2 candidate selection? daikikumakura.github.io. https://daikikumakura.github.io/writing/boltz2-assay-finetuning-en.html