Proteome-guided degrader design: separating target degradation from mitochondrial effects
Public proteomics and respiratory-chain data reveal the gains and limits of redesigning an androgen-receptor degrader.
On this page
- Reading off-target effects in cells without the target
- How structural changes affect respiration
- Target degradation remains but potency changes
- Saved-score accuracy does not establish new-compound performance
- Respiration and AR degradation do not improve equally
- Data and code availability
- References
A molecule that degrades its target efficiently is not necessarily a good drug candidate. Design must preserve target activity while reducing effects on other cellular functions. For a degrader such as a PROTAC, this involves the target-binding group, the ligase-recruiting group and the linker between them.
Basu and colleagues' paper, published on October 9, 2026, connects proteomic changes to mitochondrial effects and structural redesign of androgen-receptor (AR) degraders (1). It combines measured protein abundances with gradient-boosted trees, rather than a deep-learning foundation model.
The interesting part is the progression from protein changes to separate functional experiments and then to molecular redesign. I reaggregated public supplementary data for compounds 1–3, covering saved toxicity scores, respiratory-chain activity and AR degradation. Improvements are visible, but so are residual effects at higher concentrations and limitations of the model evaluation.
Reading off-target effects in cells without the target
An AR degrader links an AR-binding group to an E3 ubiquitin-ligase recruiter. Bringing them together promotes AR degradation. Successful target engagement does not remove possible effects on other proteins or metabolic processes.
The study measured drug-treated proteomes in AR-negative HepG2 cells. Changes in this system principally describe off-target responses rather than AR degradation efficacy. Changes in respiratory-chain proteins, especially those related to complex I, were associated with the toxicity phenotype (1).
The classification target was whether ATP-based IC50 in galactose-grown HepG2 cells was below 10 µM. Galactose increases reliance on oxidative phosphorylation relative to glucose, making mitochondrial effects easier to detect. A toxicity score refers to this experimental classification; it is not a patient's probability of liver injury.
SHAP importance for complex-I proteins does not establish direct binding to those proteins. Abundance may change as a cellular response. The authors therefore used separate functional experiments to investigate effects that a proteomic association alone cannot establish.
How structural changes affect respiration
Compounds 2 and 3 add a 7-methoxy group to the lenalidomide-based CRBN recruiter in compound 1. Compound 3 also replaces an ether-chain linker with piperidine. The AR-binding group is shared; the changes are not confined to the linker (original Figure 5e).
I extracted saved scores from the final paper's Supplementary Dataset 5 and averaged them by base identifier: two rows for compound 1, one for compound 2 and three for compound 3. This aggregates existing predictions; it neither retrains a model nor predicts new compounds.
Table 1. Saved scores aggregated by base identifier.
| Compound | Mean saved score | Rows aggregated |
|---|---|---|
| 1 | 0.917 | 2 |
| 2 | 0.478 | 1 |
| 3 | 0.359 | 3 |
Lower scores align directionally with separately measured respiratory activity, although the improvement varies with concentration.
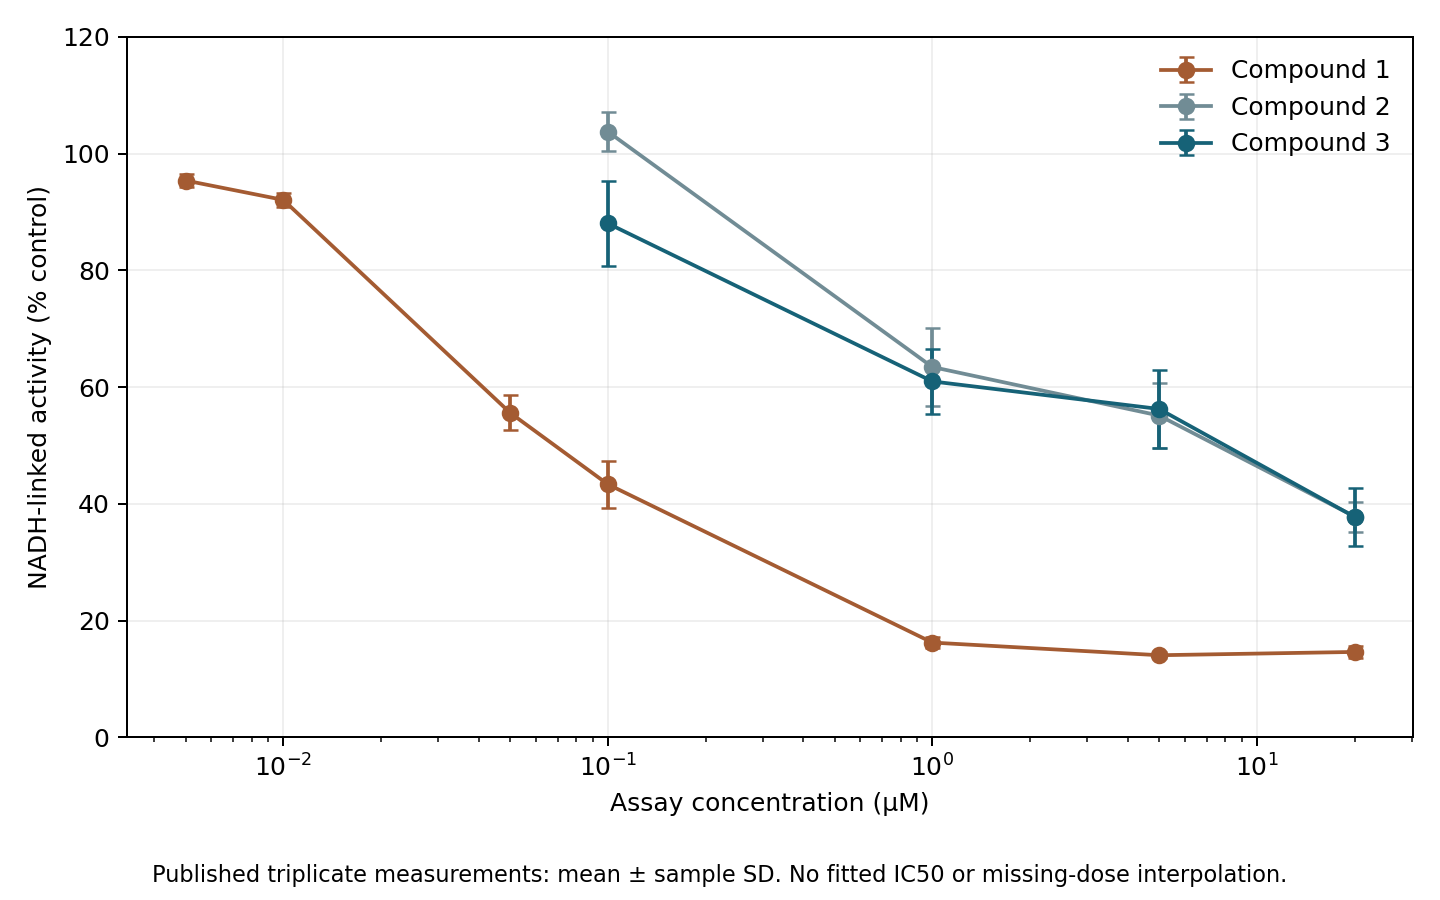
Figure 1. Author's redrawing of 45 public measurements from Source Data Figure 6C. Points show means of three measurements at each concentration; bars show sample standard deviations. Connecting lines are not fitted concentration–response curves. Missing low-concentration measurements for compounds 2 and 3 were not imputed.
Table 2. Mean NADH-dependent respiratory-chain activity from public measurements.
| Concentration (µM) | Compound 1 activity (%) | Compound 2 activity (%) | Compound 3 activity (%) |
|---|---|---|---|
| 0.1 | 43.4 | 103.8 | 88.0 |
| 1 | 16.2 | 63.4 | 61.0 |
| 20 | 14.6 | 37.8 | 37.8 |
Activity is expressed relative to control; 100% indicates a similar level. At 0.1 µM, compound 1 reduced activity to 43.4%, while compounds 2 and 3 retained higher values. Differences remained at 1 µM. At 20 µM, however, activity fell to about 38% for compounds 2 and 3. The effect was attenuated, not eliminated across all concentrations. These are means of public observations, not statistically tested between-compound differences.
The NADH-dependent assay measures respiratory function through complexes I, III and IV, not direct binding to isolated complex I. The paper also compares succinate-dependent activity through complexes II, III and IV, bypassing complex I. This supports a complex-I-related effect and gives functional substance to the structural redesign (original Figure 6 and assay methods).
Target degradation remains but potency changes
Reducing off-target effects would defeat the purpose if AR degradation were lost. Source Data Figure 5C permits a comparison of AR-degradation EC50 and model score.
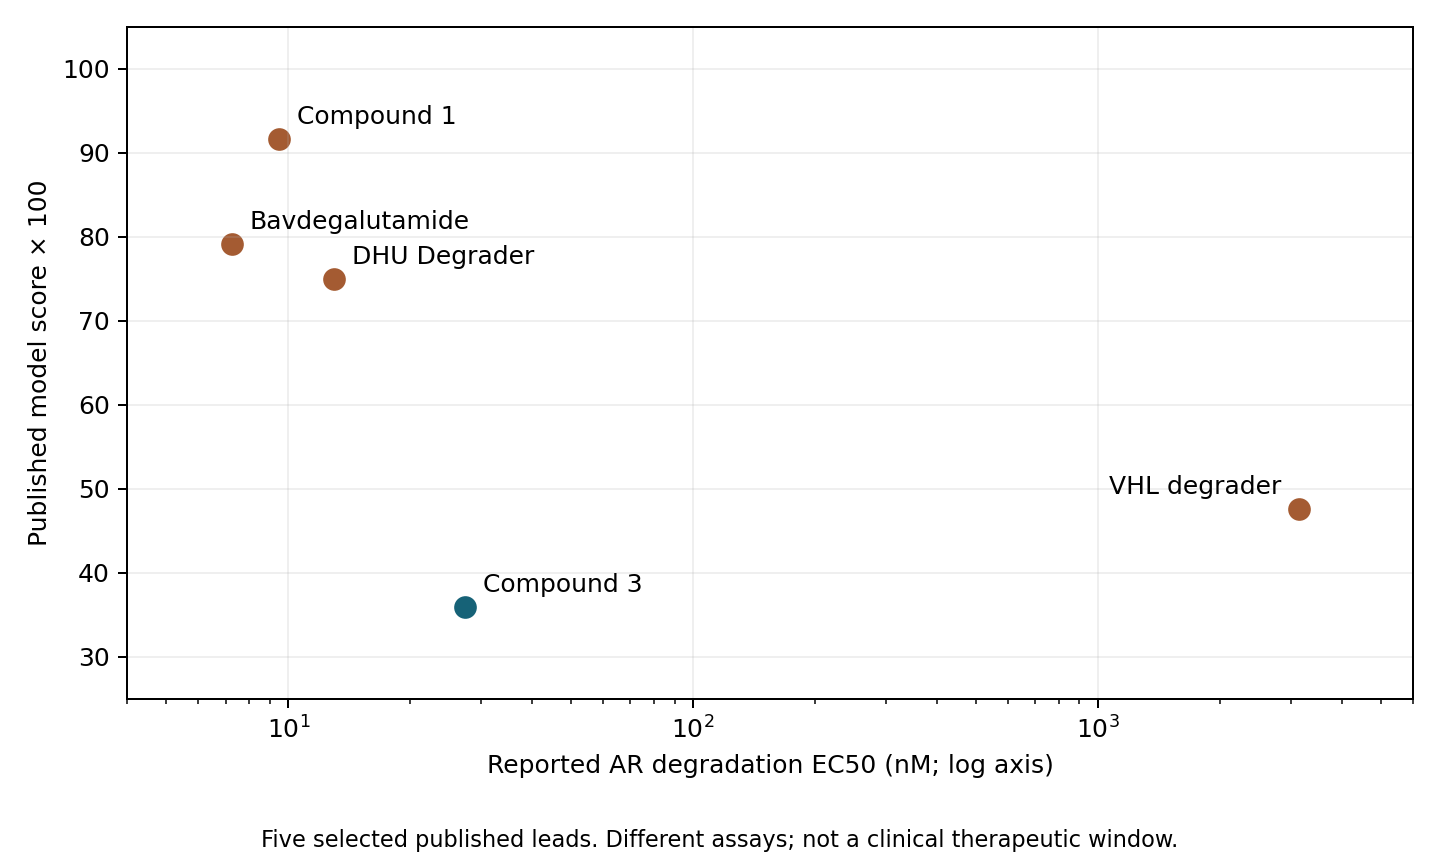
Figure 2. Summary values for five selected candidates. The horizontal axis is AR-degradation EC50 in nM on a logarithmic scale; the vertical axis is the saved score multiplied by 100. The measures come from different experimental systems. These examples do not establish a library-wide correlation.
AR-degradation EC50 was approximately 9.50 nM for compound 1 and 27.3 nM for compound 3, a ratio of about 2.88. Compound 3 retains nanomolar degradation activity, but the point estimates do not establish equivalent potency. Both the higher EC50 and the weaker respiratory effect belong in the assessment.
Respiratory activity, HepG2 ATP content and AR degradation are distinct measurements. Dividing results from different cells and conditions does not produce a clinical therapeutic window. The paper includes further experiments in primary human hepatocytes, AR-positive cells and animals; the values reaggregated here remain preclinical measurements (original Figures 5–6 and source data).
Compound 3 can be described as retaining target degradation while reducing effects in a particular respiratory assay. Quantifying the margin between target degradation and respiratory impairment requires corresponding exposure conditions, including treatment duration and intracellular concentration. This reaggregation cannot establish that margin numerically.
Saved-score accuracy does not establish new-compound performance
Model evaluation depends on what is supposed to be new. Matching the 213-row score table to the Figshare split metadata, version 1, gave 170 training rows and 43 test rows (2). I used the final paper's scores rather than mixing them with the older Figshare Table S3, whose values differ.
Table 3. Audit of saved scores and public split metadata. AP is not an independent performance estimate.
| Reaggregated item | Result |
|---|---|
| Test rows with IC50 <10 µM | 24 / 43 |
| Test positive fraction | 0.558 |
| Base identifiers present in both training and test sets | 5 |
| Chemical series in the test set | 12 |
| Test series also present in training | 12 |
| AP of saved calibrated scores | 0.847 |
Average precision (AP) sums precision values in score order, weighted by increments in recall; ties were grouped. The value 0.847 is not an independent evaluation. The paper's Methods explicitly states that the test set was used to calibrate the final model. Labels used for calibration therefore reappear in this saved-score AP.
Nor does it reproduce the paper's individual-model AUPRC values of 0.79 for narrow search and 0.78 for wide search. It describes saved scores averaged after calibration. Performance on new data requires an evaluation set unused for training, selection or calibration (1, Model calibration and toxicity scoring).
The split unit also limits interpretation. Base identifiers were created by removing suffixes, following the official score aggregation; I did not independently verify molecular identity. Five base identifiers occur on both sides, and all 12 test chemical series appear in training. The split evaluates measurements within known series rather than directly demonstrating generalization to new series. A new-series use case calls for series-based separation, with distinct calibration and final evaluation sets.
One training metadata row reports IC50 as “>0.032 µM”. That lower bound cannot determine whether the value is below 10 µM, so the audit records it as unknown. None of the 43 test rows is ambiguous at this threshold. The audit does not establish how that training row was ultimately handled during model fitting.
Respiration and AR degradation do not improve equally
The reaggregation confirms lower saved scores, improved respiratory activity at 0.1–1 µM and a changed AR-degradation EC50. The study's strength lies in connecting off-target proteomic changes to functional assays and molecular redesign.
Weaker respiratory impairment does not mean unchanged AR potency. Results from different cells and conditions cannot define a clinical therapeutic window, and a low toxicity score does not establish candidate safety.
Data and code availability
Download code, input CSVs and figures. Aggregation and six computational tests require only the Python standard library; redrawing figures requires matplotlib. The ZIP includes instructions in REPRODUCE.md and source URLs and file hashes in input-provenance.json.
Inputs were extracted from the paper's supplementary data (3): Supplementary Dataset 5, Source Data Figure 5, Source Data Figure 6, and the split metadata. The package contains extracted numerical inputs, not redistributed original tables, figures or models. Figures were independently drawn from the public values. I statically inspected the official repository (4) at commit 1caec1e916a770d04c316f0aa913c1e39e31f4ec.
This is an exploratory reaggregation after inspecting public materials. It does not reproduce raw-proteome processing, retraining, calibration, series-held-out evaluation or clinical safety validation.
References
- Basu S, Yu JSL, Bosak J, Bagal SK, Crafter C, Fallan C, et al. Proteome-guided drug discovery maps and mitigates therapeutic degrader toxicity. Nature Chemical Biology. 2026 Oct 9. Published online. doi:10.1038/s41589-026-02347-2.
- Ralser Laboratory. Proteomic drug discovery: split metadata, version 1. Figshare. 2025. doi:10.6084/m9.figshare.28578113.
- Basu S, Yu JSL, Bosak J, Bagal SK, Crafter C, Fallan C, et al. Supplementary Dataset 5 and Source Data for Figures 5 and 6. Supplement to: Proteome-guided drug discovery maps and mitigates therapeutic degrader toxicity. Nature Chemical Biology. 2026. Supplementary files.
- Ralser Laboratory. Proteomic-drug-discovery [source code]. Commit 1caec1e916a770d04c316f0aa913c1e39e31f4ec. GitHub repository.