How to read a Spearman of 0.74 for human half-life: checking Iambic's claim with public data and plain baselines
Public half-life data and simple baselines clarify Enchant comparison claims, test-set variation, five-molecule prior knowledge, and derived-clearance limits.
On this page
Introduction
Sources were checked on October 20, 2026. This analysis uses public datasets and standard machine-learning baselines. It does not evaluate Enchant itself. Enchant predictions were unavailable; the results concern properties of public data and the performance attainable by simple baselines.
AI drug-discovery company Iambic Therapeutics began Nasdaq trading under IAM on October 15, 2026, raising approximately $150 million at $16 per share (1). Its October 2024 announcement claimed that the Enchant platform could predict clinical properties from early drug-discovery data (2, 3). A central figure was human pharmacokinetic half-life prediction: Spearman correlation 0.74, compared with a previous best of 0.58. The materials also claimed predictive power with human data for only five molecules.
How should we read the difference between 0.74 and 0.58? I examined the comparison conditions using public benchmark data and original baseline calculations.
What is publicly reported?
The 2024 announcement and white paper state the following (2, 3):
- Evaluation used the Obach human PK dataset. Half-life Spearman was 0.74 with the full preclinical dataset and the full Obach dataset.
- The previous best was 0.58, linked to TDC's Half_Life_Obach benchmark. A third-party benchmarklist snapshot dated May 28, 2026, reported leaderboard best performance of 0.576 (4, 5).
- With less than 1% of the Obach human data, five molecules, the announcement describes “meaningful predictive power” and the white paper “strong predictive power.” They attribute this to transfer learning from preclinical experimental data and state that competing approaches cannot form predictive models with so little training data.
Some evaluation details are missing from the white-paper body: split procedure, test-set size, random seeds, and numerical five-molecule performance. They may appear in figure images, but I could not read them from the text. A table of other Obach PK parameters was also an image whose contents I did not verify. This examination concerns the 2024 materials; I did not establish whether later versions updated them.
The comparison benchmark uses a scaffold split, grouping structurally similar molecular frameworks together, with 20% held out for testing. TDC explains using Spearman because properties also depend on factors beyond chemical structure (5). The fixed test set contains 135 of 667 drugs. Random seeds change only training/validation allocation, according to TDC source-code inspection during review; I did not use PyTDC. The reported leaderboard standard deviation, approximately 0.025 for the top result according to the third-party aggregation, therefore does not include changes in test-set membership.
Data
Inputs are three TDC-distributed files (6):
- Half-life: 667 drugs, representing terminal half-lives after human intravenous administration compiled by Obach and colleagues (7). The fixed TDC test set has 135 drugs, leaving 532 for training/validation.
- Steady-state distribution volume, Vss: 1,130 drugs from Lombardo and colleagues, in L/kg (8).
Collapsing stereoisomers and salts to parent compounds left 658 half-life compounds. Nine duplicate groups had median absolute log-half-life difference 0.16, approximately 1.4-fold, and maximum 0.64, approximately 4.3-fold. Murcko scaffolds formed 444 groups, including 365 singletons; the largest, a benzene-only framework, contained 57 compounds. The 135 fixed-test drugs had no parent-compound overlap with the 532 training/validation drugs. The half-life and volume datasets shared 621 compounds.
How certain is the difference between 0.74 and 0.58?
For 135 test drugs, approximate 95% intervals were 0.64–0.82 for Spearman 0.74 and 0.44–0.69 for 0.58, using Fisher z with the Bonett–Wright standard error (9). Because the white paper does not specify evaluation size, I also calculated intervals for all 667 drugs: 0.70–0.78 and 0.52–0.63. Cross-validation predictions are dependent, so actual intervals for that setting would be wider.
Paired evaluation on the same test set can estimate a difference more precisely. I assumed correlations between the two sets of predicted ranks and calculated approximate dependent-correlation difference intervals using Zou's method (10). That method is based on Pearson-correlation theory and is applied approximately to Spearman here.
Table 1. Approximate 95% intervals for a correlation difference of 0.16 under assumed prediction-rank correlations.
| Correlation between predicted ranks, assumed | Difference interval with 135 test drugs | Difference interval with 667 test drugs |
|---|---|---|
| 0.3 | 0.02–0.31 | 0.10–0.23 |
| 0.5 | 0.03–0.29 | 0.10–0.22 |
| 0.7 | 0.06–0.27 | 0.11–0.21 |
| 0.9 | 0.10–0.24 | 0.13–0.19 |
None of these assumed cases readily supports a zero difference. With 135 drugs, however, lower bounds of 0.02–0.10 remain close to zero. More fundamentally, the intervals assume an observed difference of 0.16 on the same test data; public materials do not establish that premise.
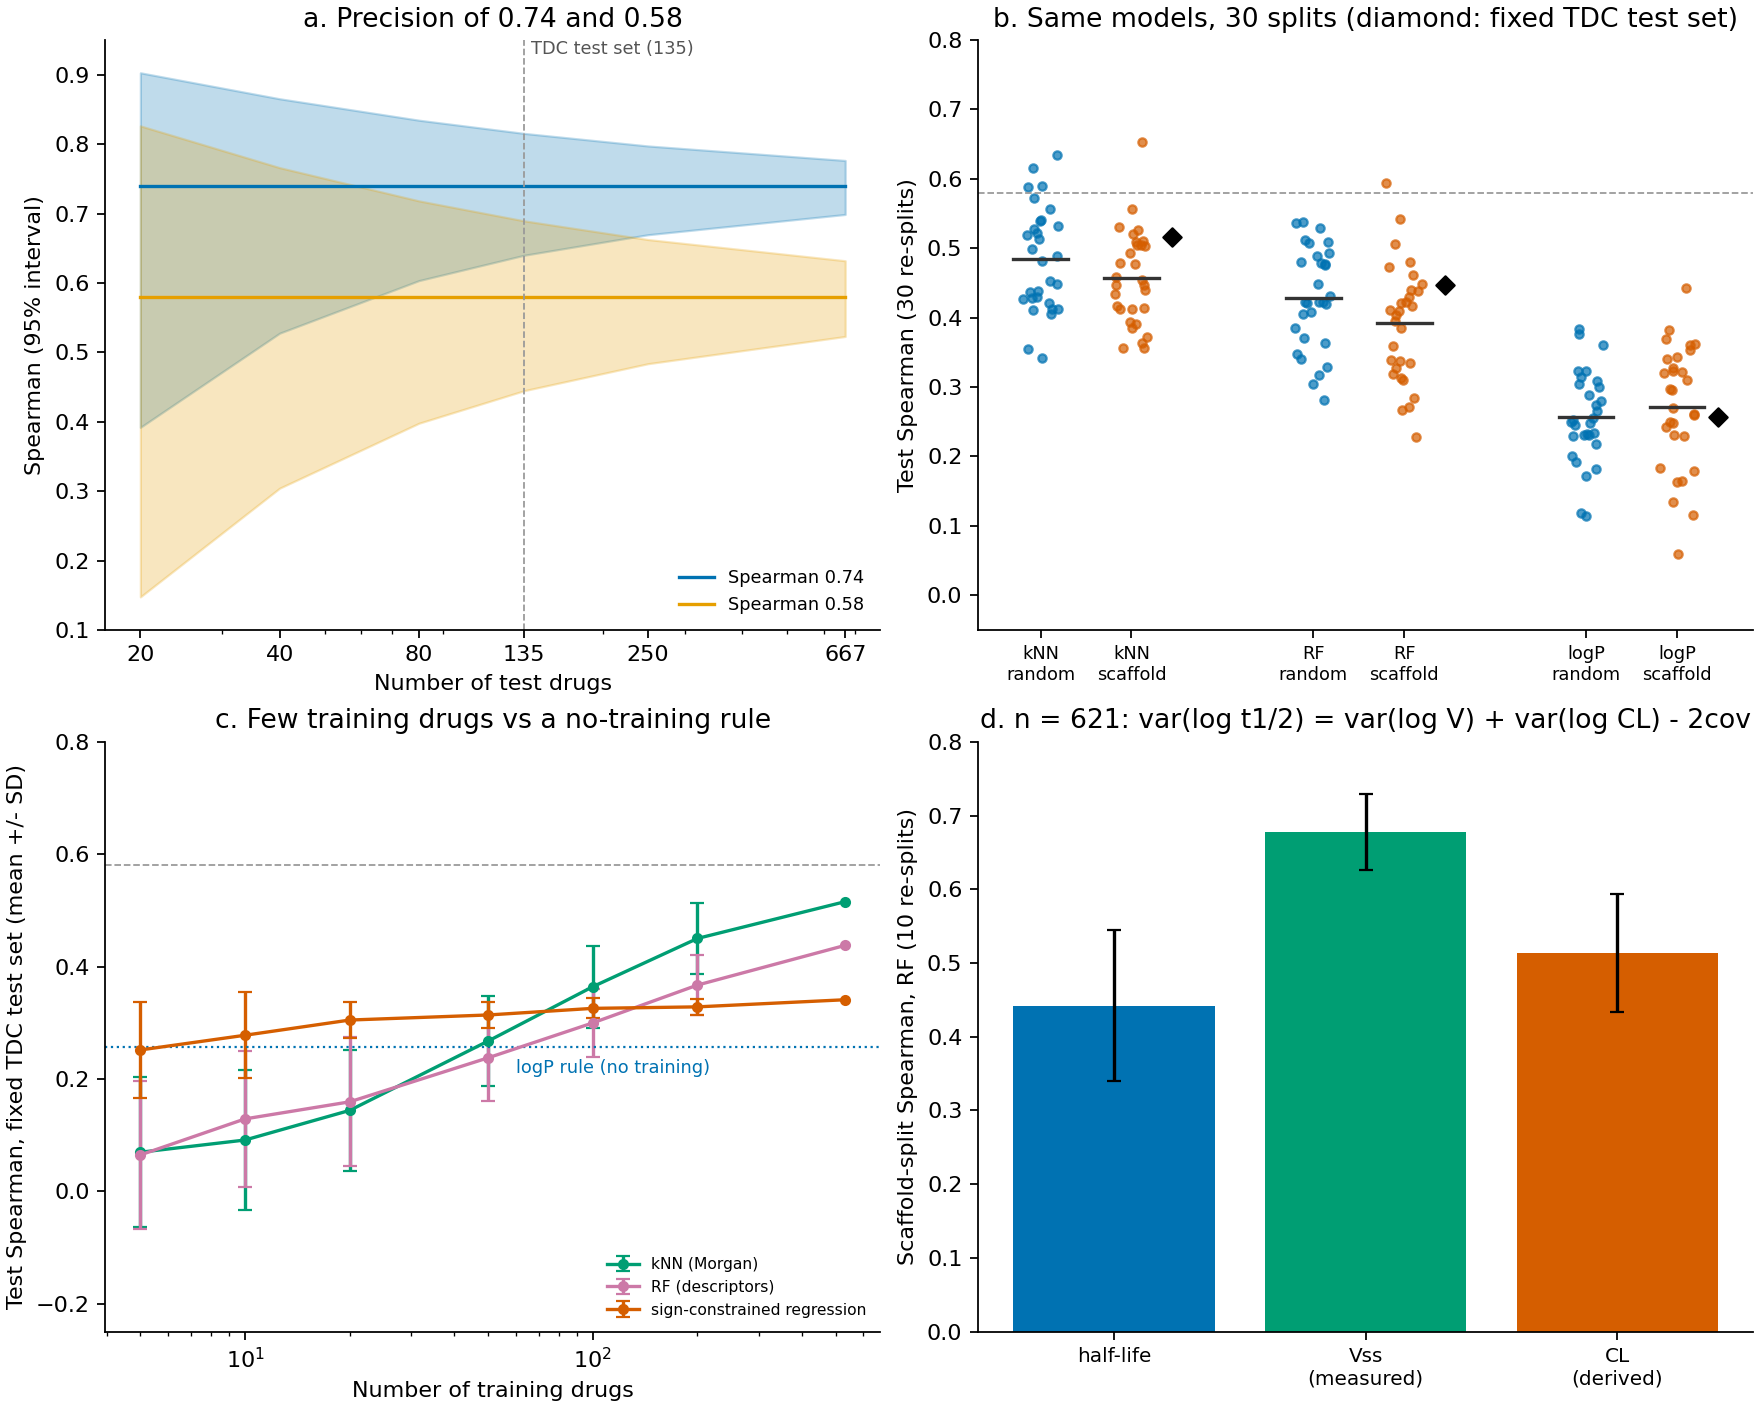
Figure 1. (a) Spearman 95% intervals for 0.74 and 0.58 by test-drug count; dashed line marks the 135-drug TDC test set. (b) Test Spearman for nearest neighbors, random forest, and a logP-only rule across 30 random and scaffold splits; horizontal bars are means, diamonds are fixed-test TDC results, and the dashed line is 0.58. (c) Fixed-test Spearman by training-drug count, mean ± standard deviation over 100 subsamples per size; the rightmost point uses all 532 drugs and the dotted line is the logP rule. (d) Random-forest test Spearman for half-life, measured Vss, and derived CL over 10 scaffold splits, mean ± standard deviation.
Outputs: results/summary.json, results/split_baselines.csv, and results/learning_curve.csv.
How far do simple baselines reach?
I used five nearest neighbors based on Morgan fingerprints, with Tanimoto-similarity-weighted averaging, and a 300-tree random forest using 13 descriptors, including lipophilicity, polar surface area, molecular weight, hydrogen-bond counts, and acidic/basic substructure counts. Both are standard untuned scikit-learn implementations. They are neither state-of-the-art models nor estimates of a gap to the state of the art.
The fixed TDC test set
Models used the 532 training/validation drugs and were evaluated on the fixed 135-drug test set.
Table 2. Fixed-test baseline and untrained-rule performance.
| Method | Test Spearman, 95% interval |
|---|---|
| Nearest neighbors | 0.52 (0.37–0.65) |
| Random forest, predictions averaged across five seeds | 0.45 (0.29–0.58) |
| logP-only rule, no training | 0.26 (0.08–0.41) |
| Negative acidic-substructure count, no training | 0.26 (0.07–0.42) |
| Median by ionization class: acid, base, neutral, zwitterion; training/validation medians only | 0.28 (0.10–0.42) |
Intervals use 2,000 bootstrap resamples of test drugs. Nearest-neighbor 0.52 is below the third-party reported leaderboard best of 0.576, which lies within its interval. The random-forest versus nearest-neighbor difference was −0.07, with interval −0.22–0.07, not distinguishable at this test size. Maximum Tanimoto similarity from each test compound to a training compound had median 0.39, 10th percentile 0.23, and 90th percentile 0.66.
Split type and test-set membership
I repartitioned the 658 parent compounds 30 times each using random splits and a custom scaffold procedure patterned after TDC's group-size threshold and filling order, then evaluated the same baselines.
Table 3. Mean performance and minimum–maximum over 30 repartitions.
| Split | Nearest neighbors | Random forest | logP rule |
|---|---|---|---|
| Random | 0.48 (0.34–0.64) | 0.43 (0.28–0.54) | 0.26 (0.11–0.38) |
| Scaffold | 0.46 (0.36–0.65) | 0.39 (0.23–0.59) | 0.27 (0.06–0.44) |
The mean random-versus-scaffold difference was 0.03 for nearest neighbors, with a 95% interval across repartitions of −0.01–0.07, and 0.04 for random forest, 0.00–0.07. These average split-type effects are too small to explain 0.16. Test membership had a larger effect. Among scaffold splits, nearest neighbors exceeded 0.576 once in 30 runs, as did random forest; nearest neighbors did so four times with random splits. The same nearest-neighbor procedure ranged from 0.36 to 0.65 on different scaffold test sets.
Thus, placing results from different test sets side by side can introduce differences around 0.1 independent of model changes; standard deviations over these repartitions were 0.07–0.09. Evaluation on the same test set avoids this particular problem.
What does predictive power with five molecules mean?
I reduced training size while retaining the fixed TDC test set, taking 100 random subsamples per size. In addition to the simple models, I used a regression with prior coefficient signs: higher logP and stronger basicity favor longer half-life, while stronger acidity favors shorter half-life. Nonnegative least squares learns magnitudes for three sign-constrained features: logP, acidic-substructure presence, and basic-substructure presence.
Table 4. Mean fixed-test rank correlation by training-drug count.
| Training drugs | Nearest neighbors | Random forest | Sign-constrained regression |
|---|---|---|---|
| 5 | 0.07 | 0.06 | 0.25 |
| 20 | 0.14 | 0.16 | 0.30 |
| 100 | 0.36 | 0.30 | 0.33 |
| 532, all | 0.52 | 0.44, see note | 0.34 |
The full-data random forest here uses one seed, giving 0.44, rather than the five-seed prediction average of 0.45 above. For sign-constrained regression, constant predictions, approximately 9% of five-drug subsamples, were counted as zero rank information and included as zero in the mean.
With five drugs, the simple models learn little: mean 0.06–0.07 and standard deviation 0.13. This partly reflects the nearly constant predictions those procedures make with five points. Prior signs raise the mean to 0.25, approximately equal to the untrained logP rule's 0.26 rather than an improvement over it. The sign-constrained regression reaches 0.30 with 20 drugs and only 0.34 with the full dataset. Its performance reached or exceeded the rule in 58% of five-drug draws and 92% of 20-drug draws.
The rule selection was not fixed before examining results. LogP and acidic/basic descriptors are natural PK-informed candidates, and signs follow that knowledge. Across all 13 descriptors and all 658 compounds in results/rules_all_descriptors.csv, the largest absolute Spearman associations were logP 0.27 and acidic-substructure count −0.26, followed by aromatic-ring count 0.21, ring count 0.19, and basic-substructure count 0.17. Restricting inspection to the 532 training/validation drugs gives logP 0.27, acidic-substructure count −0.26, and ring count 0.24 as the leading values. LogP and acidity would still be selected; ring count was not included among prior-informed features.
For few-drug claims, a useful reference here is therefore approximately 0.25–0.28 from prior-informed rules, rather than zero. Enchant's five-molecule setting includes pretraining on preclinical data. These baselines do not reproduce its information conditions; they only illustrate a performance reference. Its numerical five-molecule result was not available, so I cannot determine whether it exceeds that reference. The sign-constrained regression also standardizes features using the unlabeled distribution of all 532 training/validation drugs, which is not strictly a setting containing only five available drugs.
What does half-life prediction capture?
Terminal half-life depends on terminal distribution volume Vz and clearance: t½ = ln2 × Vz / CL. For the 621 shared compounds, I substituted Vss and calculated CL = ln2 × Vss / t½. This is derived CL, not measured clearance. Since Vz is often larger than Vss, it tends to underestimate actual CL by the factor Vss/Vz. Half-life measurement error also propagates directly into the derived quantity.
The log-half-life variance decomposes algebraically:
- var(log t½) = 0.37, var(log Vss) = 0.40, var(log derived CL) = 0.42, and covariance of log Vss and log derived CL = 0.23, corresponding to correlation 0.55.
- Relative to half-life variance, the Vss covariance contribution was 47% and the derived-CL contribution 53%; they sum to 100% by identity.
Positive correlation between volume and clearance makes half-life variance, 0.37, much smaller than the sum of the individual variances, 0.82. Some positive correlation is mechanically induced because CL was derived using Vss. Measured clearance is needed to establish the biological relationship.
Table 5. Random-forest prediction of PK quantities over 10 scaffold splits.
| Predicted quantity | Test Spearman, mean and standard deviation |
|---|---|
| Vss, measured | 0.68 (0.05) |
| Derived CL | 0.51 (0.08) |
| Half-life | 0.44 (0.10) |
Measured Vss was easier to predict from structure. Predictability of derived CL partly inherits that of Vss, so these results do not establish that actual clearance is difficult to predict. They show that half-life ranks were harder to predict than Vss ranks. A high half-life Spearman cannot identify whether volume or clearance was predicted correctly.
For dosing, AUC is determined by bioavailability times dose divided by CL, whereas half-life influences interval and accumulation. A model predicting half-life primarily through volume could still mispredict exposure. That is an inference from PK relationships, not a result demonstrated by this analysis.
The Enchant white paper states that it tabulates other PK parameters (3). Separate clearance and volume results could address this question, but I could not establish their contents from the accessible text.
Discussion
I could not independently establish matching input information and evaluation splits for 0.74 and 0.58. The former reportedly includes preclinical pretraining; the comparator's training conditions remain unverified.
On this fixed test set, untrained lipophilicity and acid–base rules attained approximately 0.25–0.28 rank correlation. Median nearest-training-compound similarity was 0.39, so these results also depend on chemical distance to training compounds.
Spearman measures ranking. It does not show fold errors in predicted half-life or identify whether volume or clearance was wrong. Better ranking and accurate absolute values for exposure calculations are different results.
Data and code availability and limitations
The calculation code generates results/ and Figure 1 from the three TDC data sources in approximately 20 minutes. Data are not bundled because their license was listed as “Not Specified.” Obtain them from Harvard Dataverse and place them in data/: half_life_obach.tab, vdss_lombardo.tab, and half_life_obach/train_val.csv and test.csv from admet_group.zip. Verified dependency versions are pinned in requirements.txt.
python -m pip install -r requirements.txt
python half_life_analysis.py
- Enchant predictions were unavailable, so this does not measure its performance. Baselines are simple untuned implementations without pretraining.
- The custom scaffold procedure follows a reviewer-provided description of TDC group-size thresholds and filling order rather than directly using TDC code. Random-number generation differs, and I did not compare validation/test allocation conditions against PyTDC source. Test sizes were 132–133. Murcko scaffolds were generated from the largest salt-stripped fragment, differing from TDC preprocessing.
- Thirty repartitions repeatedly use the same 658 compounds; they are not independent experiments. Intervals describe repartition variability, not population inferential intervals.
- The leaderboard best of 0.576 comes from third-party aggregation. I did not verify the official leaderboard.
- Derived CL assumes Vz is close to Vss, although Vz is generally somewhat larger, and incorporates half-life measurement error. Measured clearance is available in the Obach and Lombardo supplements but was not used here.
- Acid/base classification uses coarse substructure rules without pKa. Collapsing stereoisomers to parent compounds removes distinctions between enantiomers with different PK.
- The five-drug sign-constrained regression assumes PK-informed signs; it does not establish performance attainable without prior knowledge.
- Obach data compile literature studies with heterogeneous half-life definitions and measurement conditions.
- White-paper table images were not read, and updates after the 2024 announcement were not checked.
References
- Iambic Therapeutics. Iambic Announces Pricing of Initial Public Offering. 2026 Oct 14. Company release; SEC Form 424B4.
- Iambic Therapeutics. Iambic Therapeutics Announces Enchant, an AI Platform that Predicts Clinical Outcomes from the Earliest Stages of Drug Discovery. 2024 Oct 29. Company release.
- Iambic Therapeutics. Enchant white paper. 2024 Oct. White paper.
- benchmarklist. TDC Half_Life_Obach. 2026 May 28 snapshot. Benchmark aggregation.
- Therapeutics Data Commons. ADMET benchmark group. Documentation. Accessed 2026 Oct 20.
- Therapeutics Data Commons. ADME datasets: Half_Life_Obach and VDss_Lombardo. Documentation. Distributed through Harvard Dataverse, doi:10.7910/DVN/21LKWG.
- Obach RS, Lombardo F, Waters NJ. Trend Analysis of a Database of Intravenous Pharmacokinetic Parameters in Humans for 670 Drug Compounds. Drug Metabolism and Disposition. 2008;36(7):1385–1405. doi:10.1124/dmd.108.020479.
- Lombardo F, Berellini G, Obach RS. Trend Analysis of a Database of Intravenous Pharmacokinetic Parameters in Humans for 1352 Drug Compounds. Drug Metabolism and Disposition. 2018;46(11):1466–1477. doi:10.1124/dmd.118.082966.
- Bonett DG, Wright TA. Sample size requirements for estimating Pearson, Kendall and Spearman correlations. Psychometrika. 2000;65(1):23–28. doi:10.1007/BF02294183.
- Zou GY. Toward using confidence intervals to compare correlations. Psychological Methods. 2007;12(4):399–413. doi:10.1037/1082-989X.12.4.399.