What does Beacon-2's human dose prediction actually predict? Decomposing dose projections with public ADME data
A Japanese technical note that rebuilds 'doses from measured in vitro ADME' for the 325 OpenADMET-ExpansionRx compounds with transparent PK equations, showing that dose ranks are driven mainly by HLM CLint, that a constant-dose baseline already reaches a 2.4-2.8-fold error, and that the benchmark excludes potency and clinical doses.
On this page
- Background and objective
- What the public report evaluates
- Data and calculation settings
- Dose ranking primarily follows HLM CLint
- Interpreting 0.79 correlation and 2.4-fold error
- What fixed potency excludes
- Measured-input dose is not clinical dose
- Discussion
- Limitations
- Data and code availability
- References
Background and objective
Materials checked on October 14, 2026. This analysis uses public data and textbook pharmacokinetic relationships.
Inductive Bio introduced Beacon-2 on September 17, 2026, describing a system that predicts efficacious human daily dose from chemical structure (1). In 325 OpenADMET-ExpansionRx compounds, the reported Spearman correlation between predicted dose and dose calculated from measured in vitro ADME was 0.79, with an average fold error of 2.4. Across 20 partner programs, mean correlation was 0.61; among pairs whose measured-input doses differed at least threefold, the lower-dose compound was selected correctly more than 81% of the time.
Dose combines clearance, binding, distribution, absorption, potency and an exposure target. I used public data to examine which inputs a successful dose ranking may primarily reflect.
What the public report evaluates
Beacon-2 combines ADMET–PK predictions, potency prediction through FEP or a co-folding affinity model, and a PK/PD dose calculation (1). Its alternative rat-allometry configuration suggests that the default uses human liver microsomal clearance and an Øie–Tozer distribution-volume model. Wang and colleagues and Page are cited as foundations for dose projection (2, 3).
The ExpansionRx evaluation uses 325 test compounds with complete measured ADME. Because potency was unavailable, all compounds were assigned 10 nM. The reference is a dose calculated by putting measured ADME through the same PK/PD module, rather than an observed clinical dose (1).
The exact dose equation, assay inputs, exposure target and definition of average fold error were not disclosed. I interpret the last quantity as absolute average fold error, AAFE, based on mean absolute logarithmic error. A signed average fold error would mean something different. My transparent simplification of Page's framework is not Inductive's equation and does not reproduce its benchmark.
Data and calculation settings
I used the full CC BY 4.0 OpenADMET-ExpansionRx release (4). Among 2,282 test compounds, 335 had human liver microsomal intrinsic clearance, HLM CLint, and mouse plasma protein binding, MPPB, within measurement ranges. Excluding nine zero-clearance entries, which cannot be logged, and requiring LogD and Caco-2 permeability and efflux values left 325. This might overlap the developer's set, but neither identity of the sets nor use of permeability in Inductive's calculation can be established publicly.
Of the test compounds, 228 had out-of-range HLM CLint: 213 below 4.5 and 15 above 252.5. With other required inputs available, these numbers were 59 and two. Exclusion therefore disproportionately affects slow-metabolism compounds. Interpreting those compounds as lower-dose candidates depends on assumptions such as setting A.
The model uses mouse plasma unbound fraction as a surrogate because human binding is unavailable; a well-stirred liver model with hepatic flow 20.7 mL/min/kg and blood/plasma ratio 1; bioavailability as absorption fraction times hepatic escape; and an unbound IC90 target equal to nine times an IC50 of 10 nM. Dosing is once daily at 70 kg.
Table 1. Exposure targets and corrections.
| Setting | Target | Assumptions or corrections |
|---|---|---|
| A | Mean unbound concentration, Cavg,u | Fa=1; no microsomal-binding correction |
| A + fu,mic | Same | LogD-based microsomal-binding correction (5) |
| A without plasma-binding correction | Same | Omit plasma binding in the well-stirred model, following Page's treatment of bases |
| A + Fa | Same | Illustrative absorption fraction from Caco-2 permeability |
| A′ | Same | Both fu,mic and Fa |
| B | Minimum unbound concentration, Cmin,u | First-order absorption, ka=1/h; distribution volume 1 L/kg, with 3 L/kg sensitivity |
Dose ranking primarily follows HLM CLint
In setting A, hepatic first-pass extraction and the well-stirred model give oral CL/F proportional to fu×CLint. Targeting unbound rather than total concentration introduces division by fu, which cancels. Dose is therefore proportional to HLM CLint. This familiar oral-unbound-AUC relationship is not a new discovery. With fixed potency, ranking dose under these assumptions is equivalent to ranking clearance; the calculated correlation was 1.000.
Table 2. Dose and HLM CLint under different assumptions.
| Setting | Spearman with HLM CLint | SD of log10 dose | Median mg/day at molecular weight 450 |
|---|---|---|---|
| A | 1.00 | 0.48 | 94 |
| A + fu,mic | 0.99 | 0.52 | 113 |
| A without plasma-binding correction | 0.91 | 0.81 | 764 |
| A + Fa | 0.94 | 0.47 | 112 |
| A′ (fu,mic + Fa) | 0.95 | 0.51 | 128 |
| B (volume 1 L/kg) | 0.80 | 1.17 | 763 |
| B (volume 3 L/kg) | 0.95 | 0.63 | 188 |
In setting B, high clearance requires large once-daily doses to maintain the minimum concentration. At 1 L/kg and molecular weight 450, 46% exceeded 1 g/day and the highest 5% exceeded approximately 190 g/day. These are extreme illustrative outputs, not practical doses. Changing frequency or formulation is a different design question. In 128 compounds for which muscle binding, MGMB, allowed Øie–Tozer volume calculation, setting B's correlation with HLM CLint was 0.87.
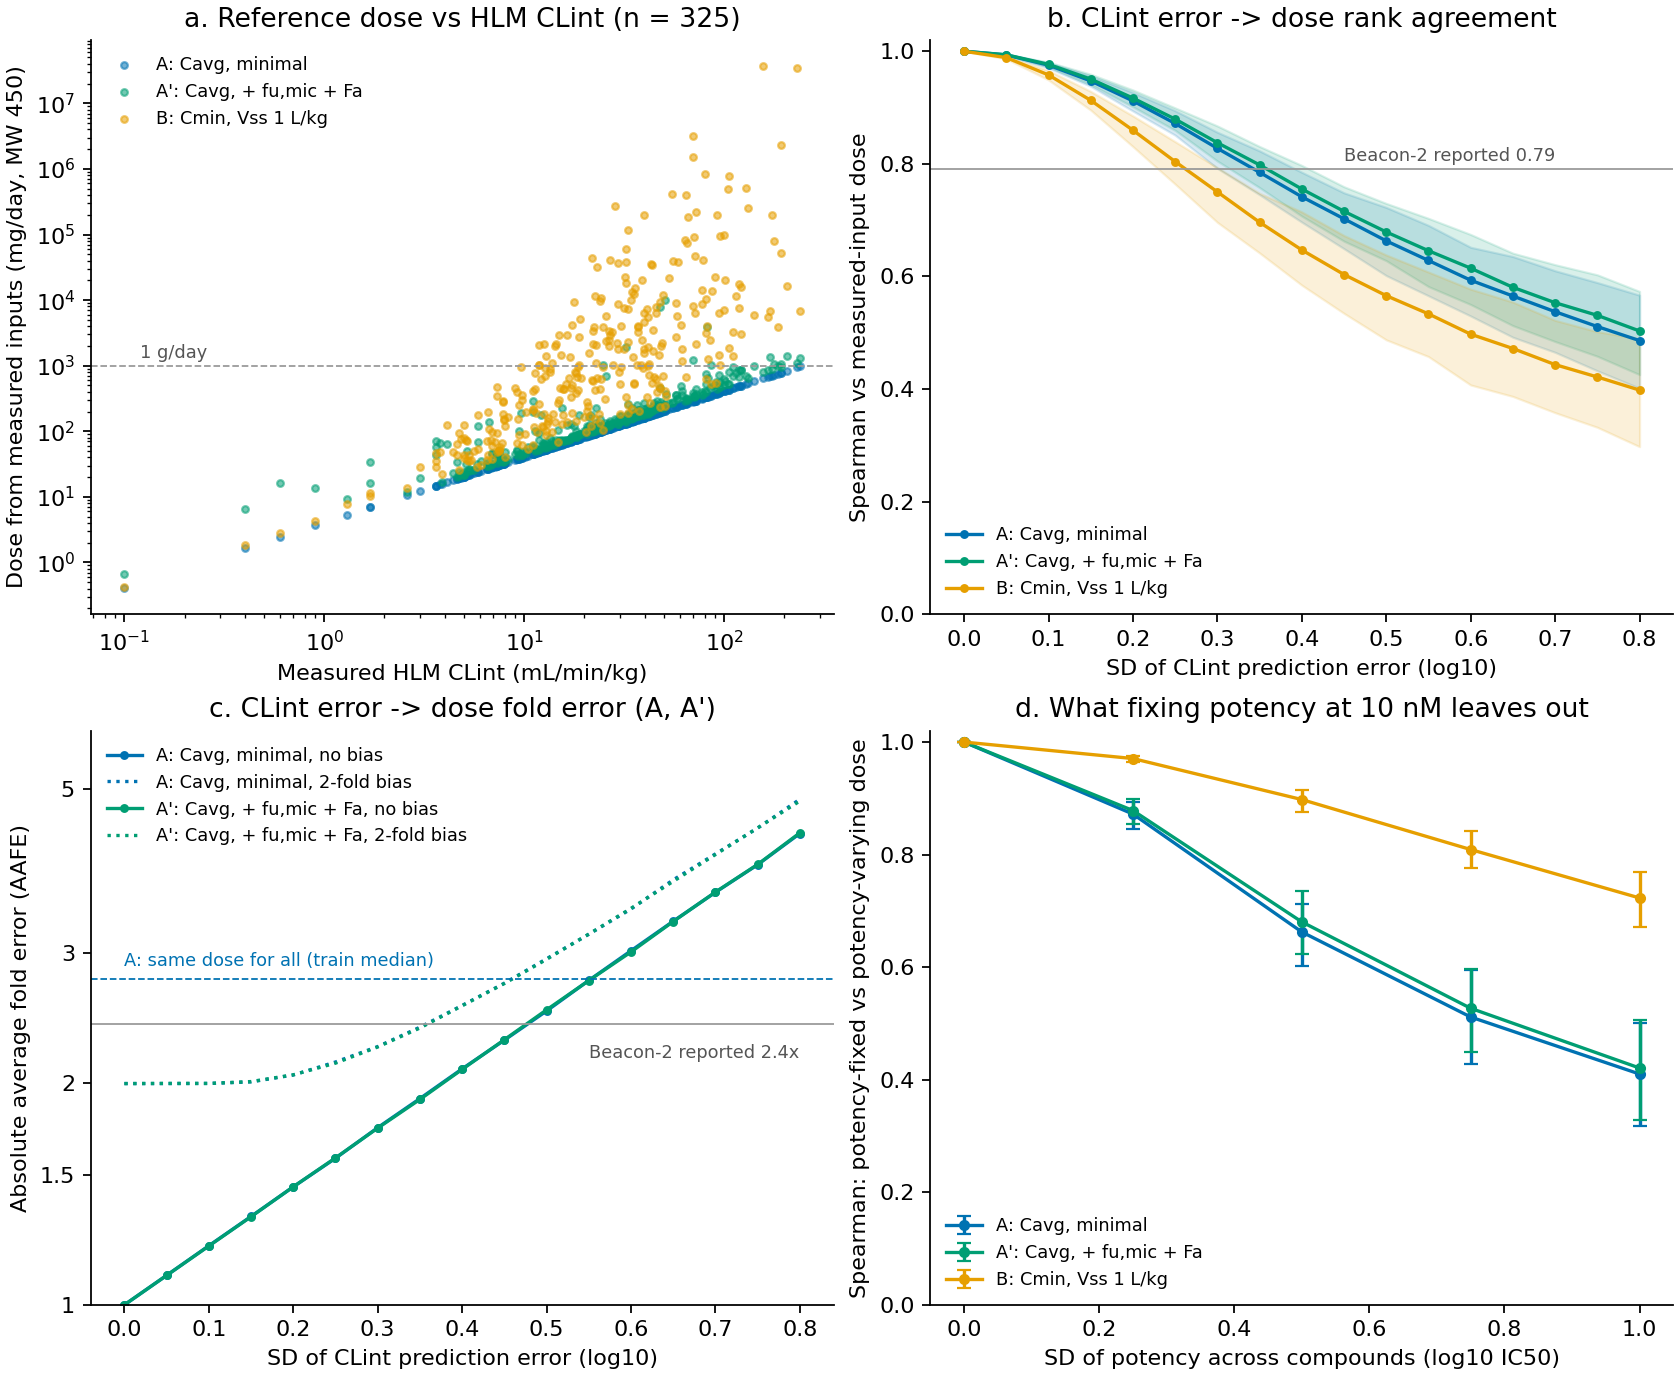
Figure 1. (a) Measured-input calculated dose at molecular weight 450 versus HLM CLint, n=325. Blue: A; green: A′; orange: B at 1 L/kg. Dashed line: 1 g/day. (b) Dose-ranking correlation after log-normal CLint prediction error; horizontal axis is error SD in log10 units. Bands cover 95% of 500 error repetitions, excluding compound-sampling uncertainty. Horizontal line: reported Beacon-2 correlation 0.79. (c) AAFE for A and A′, which nearly overlap. Solid lines have no bias; dotted lines add a common approximately twofold bias, 0.3 log10 units. Blue dashed line: setting A with the training-set median dose assigned to every compound. Setting B's much larger errors are described in the text. (d) Correlation between fixed-potency and variable-potency measured-input doses as log10 IC50 variability increases; this is not Beacon-2 performance. Error bars cover 95% of 500 repetitions.
Outputs are results/summary.json, results/error_propagation.csv and results/potency_sweep.csv.
Interpreting 0.79 correlation and 2.4-fold error
Rank
For n=325, a correlation of 0.79 has an approximate 95% interval of 0.74–0.83 using Fisher's z and the Bonett–Wright standard error. In setting A, simulated CLint error SD of approximately 0.34 log10 units, about 2.2-fold, produced dose correlation 0.79; the interval corresponded to approximately 0.29–0.40. Setting A′ required approximately 0.36.
In setting B, even a perfect HLM CLint ranking correlates only 0.80 with dose, because dose also depends on volume and binding. For comparison, I used other measurements directly as ranking scores. These are descriptive correlations within the same compounds, not prospective model baselines.
Table 3. Other measured properties versus calculated dose ranking.
| Measured property used directly | A | A′ | B |
|---|---|---|---|
| LogD | 0.63 (0.56–0.69) | 0.61 | 0.23 |
| Mouse liver microsomal CLint, n=278 | 0.64 | 0.63 | 0.44 |
Parentheses denote a bootstrap 95% interval. LogD itself correlated 0.63 with HLM CLint in this set. A structure-trained simple predictive model feeding the dose equation was not evaluated.
For pairs differing at least threefold in calculated dose, setting A at error corresponding to correlation 0.79 selected the lower dose approximately 94% of the time. At error corresponding to 0.61, rates were approximately 84% in A and 77% in B. The developer's greater-than-81% result is broadly compatible with that correlation, but this is not replication across its partner programs.
Absolute error
AAFE depends on the dispersion of reference doses. Assigning one constant to every compound gave:
Table 4. AAFE for constant dose predictions.
| Setting | Training-set median | Test-set median, known only retrospectively and optimal among constant predictions |
|---|---|---|
| A | 2.77-fold | 2.38-fold |
| A′ | 3.02-fold | 2.47-fold |
| B (volume 1 L/kg) | 14.3-fold | 7.98-fold |
Under a definition close to A, 2.4-fold is comparable to a constant prediction. This does not establish how Inductive's undisclosed reference is distributed.
In A, the unbiased error generating correlation 0.79 gave AAFE 1.88-fold. A common twofold bias increased it to 2.36-fold, approximately matching both reported numbers. A calibrated regression shrinking predictions toward the mean instead gave approximately 1.67-fold at correlation 0.79. In B, error corresponding to 0.79 produced approximately 5.2-fold AAFE.
The pair of metrics therefore depends on the reference definition, bias and shrinkage. A 2.4-fold error may include systematic bias as well as ranking errors under an A-like construction. Public reference-dose and error distributions would be needed to distinguish these possibilities.
What fixed potency excludes
Changing a common potency rescales every dose equally. Spearman correlation and AAFE are consequently independent of the particular 10 nM value when both prediction and reference use it; only absolute mg/day changes.
I varied compound-specific potency and compared fixed-potency with variable-potency measured-input dose rankings. At log10 potency SD 0.5, approximately a 100-fold central 95% span, correlations were 0.66 in A and 0.90 in B. At SD 1.0, they were 0.41 and 0.72. Narrow ADME-driven dose distributions are more sensitive to potency variation. These are assumed variability scenarios, without ADME–potency correlations, rather than estimates for a particular program.
Where potency is measured after synthesis, evaluating the ADME contribution separately can be useful. Fixed-potency evaluation is a limitation of scope, not an intrinsic error. Before synthesis, however, predicted potency adds uncertainty. The developer reports correlation 0.72 for its fine-tuned co-folding example; this separate number does not resolve its dose uncertainty.
Measured-input dose is not clinical dose
In vitro-to-human extrapolation error affects both sides of a measured-versus-predicted-input comparison and can remain invisible. Inductive explicitly describes this evaluation as against measured in vitro inputs (1).
Page compared dose predictions from in vitro data and PK models against actual doses normalized by Cmin or Cmax. Depending on dataset, 45–68% fell within threefold and 82–92% within tenfold (3). Wang and colleagues used an early-in-vitro-input PBPK framework for 18 Genentech compounds, reporting useful ranking by unbound Cmin, Cmax and AUC relative to individual in vitro measurements (2).
Beacon-2's benchmark tests proximity between doses calculated from predicted and measured ADME. Accuracy of the latter against actual human requirements needs a separate validation. Page's threefold coverage was approximately half to two-thirds across the reported datasets.
Discussion
Dose is a meaningful common unit for comparing tradeoffs among properties. Wang and colleagues support combining measurements through PK rather than treating each independently (2). But the unit does not itself establish the validity of every input or extrapolation.
Inductive's Mac1 example compares optimization by predicted dose with optimization by potency using the same model to score results. It is not wet-lab validation. Additional reported checks include QED, blinded medicinal-chemist preference of 87% and a rat-based alternative PK configuration (1).
Under my transparent equations, the ExpansionRx correlation of 0.79 could largely reflect HLM CLint prediction. Inductive's undisclosed equation and inputs prevent identifying that contribution directly. Fixed-potency dose ranking and full clinical-dose prediction remain different evaluations.
Limitations
The equations are not Inductive's, and these results do not reproduce Beacon-2. Mouse binding substitutes for human binding; fu cancels in A. Absorption from Caco-2 and a microsomal protein concentration of 0.5 mg/mL are illustrative. No pKa-based acid/base correction was possible.
Prediction errors were assumed log-normal and independent of compound identity, with independent CLint and fu errors. Actual errors can be biased and correlated across chemistry and endpoints. Excluding censored measurements preferentially removes slow metabolism. Restoring them at assay bounds changes setting A log-dose SD from 0.48 to 0.51 and retrospective constant-median AAFE from 2.38 to 2.66, n=386.
The full ExpansionRx data were released in January 2026. Public information does not establish whether Beacon-2 ADMET training excluded these test compounds.
Data and code availability
The calculation code generates results/ and Figure 1 from training, test and raw public CSVs in approximately six minutes. Obtain the data from the Hugging Face dataset, subject to access terms, and place them in data/. Checked dependency versions are pinned in requirements.txt.
python -m pip install -r requirements.txt
python dose_decomposition.py
References
- Rich A. Beacon-2: Completing the reward function for chemical optimization in drug discovery. Inductive Bio; 2026 Sep 17. Announcement.
- Wang Y, Wang W, Broccatelli F, Kenny JR, Wright MR, Sorenson J, et al. Human-Focused Multiparameter Optimization Scores for Rank Ordering Compounds during Early Drug Discovery: Validation of PBPK Models Based on Clinical PK Data. Journal of Medicinal Chemistry. 2025;68(16):17960–17970. doi:10.1021/acs.jmedchem.5c01707.
- Page KM. Validation of Early Human Dose Prediction: A Key Metric for Compound Progression in Drug Discovery. Molecular Pharmaceutics. 2016;13(2):609–620. doi:10.1021/acs.molpharmaceut.5b00840.
- OpenADMET, Expansion Therapeutics. OpenADMET-ExpansionRx Challenge full dataset [Dataset]. CC BY 4.0. Hugging Face. Accessed 2026 Oct 14.
- Hallifax D, Houston JB. BINDING OF DRUGS TO HEPATIC MICROSOMES: COMMENT AND ASSESSMENT OF CURRENT PREDICTION METHODOLOGY WITH RECOMMENDATION FOR IMPROVEMENT. Drug Metabolism and Disposition. 2006;34(4):724–726. doi:10.1124/dmd.105.007658.