Reading an affinity-prediction R² of 0.43 against the measurement-noise ceiling
ChEMBL cross-document IC50 differences yield conditional R² ceiling scenarios, with duplicate handling, assay heterogeneity and calibration limitations.
On this page
In October 2026, Bindwell announced Atomwell, trained on 76 million measurements extracted from papers and patents using an LLM. Its announcement compares three models on 1,885 IC50 values from held-out documents (1): Atomwell R² 0.434; Nesso-1, released by Valence Labs, R² 0.237 (2); and the structure-based Boltz-2 model R² 0.034. These are reported scores, not model runs performed for this article.
Here R² is one minus mean squared error divided by the measured total variance. It can be negative; one indicates perfect predictions and zero is equivalent to predicting the observed mean. Unobserved independent measurement error prevents even perfect latent-value predictions from attaining an expected R² of one.
To interpret 0.434, I collected cross-document IC50 reports for the same compounds and targets in ChEMBL. I then calculated conditional noise-ceiling scenarios. These require both an independent-error model and transport of variance from ChEMBL to the unpublished benchmark. “Noise floor” below denotes the error component under those assumptions, not a universal irreducible limit. Atomwell’s evaluation data are unavailable, so this is not an independent validation of its performance.
Question and scope
The question is how closely one document’s IC50 predicts another document’s value for the same compound and target, and how that variability translates into hypothetical R² ceilings for held-out-document evaluation. The intended use is interpreting R², MSE and fraction of variance unexplained (FVU), not ranking models.
Methods
ChEMBL 37, released in May 2026, was accessed through its REST API (3). The dataset contains 123,300 IC50 records with pChEMBL values for 15 human single-protein targets. Here pIC50 is minus the base-ten logarithm of molar IC50, so a one-unit difference represents a tenfold concentration difference. Targets include eight kinases (EGFR, HER2, ABL1, JAK2, CDK2, BRAF, VEGFR2 and PI3Kα), four proteases (BACE1, thrombin, factor Xa and DPP4), plus HDAC1, PARP1 and hERG.
Within each document, repeated compound–target values were reduced to medians, leaving 104,759 records. There were 10,580 compound–target combinations reported in at least two documents, approximately 12% of combinations. For each combination, two documents were randomly selected to provide one difference with equal weight. This avoids disproportionate influence from frequently measured reference compounds. All 165,494 possible document pairs were additionally analyzed for sensitivity. Because pChEMBL values have two decimal places, differences were rounded accordingly: zero denotes exact agreement and an absolute difference of at least one denotes at least tenfold disagreement.
For the ceiling calculation, assume each report equals the same latent value plus independent, zero-mean error with equal variance. Half the variance of cross-document differences then estimates a single measurement’s error variance. The reported Atomwell MSE and R² imply total benchmark variance 0.885/(1−0.434)=1.56, assuming the stated SSE-based R² definition. Nesso-1 and Boltz-2 reports imply the same variance. A hypothetical ceiling is then 1 minus noise variance divided by 1.56.
Transportability is an additional assumption. Cross-assay systematic differences may be predictable when assay conditions are inputs; they are not necessarily irreducible noise. The 95% intervals use 2,000 compound-level bootstrap replicates and do not encompass all uncertainty in the transport assumption.
The analysis plan was fixed before computation. The planned primary analysis included exact matches, with a rule to describe substantial headroom when the ceiling was at least 0.9. Its result, 0.91, meets that rule. Excluding exact matches or ChEMBL duplicate flags and counting spikes were added after inspecting results. These alternative analyses aim to reduce nonindependent reuse but do not establish that all retained measurements are independent.
Exact agreement and duplicate handling
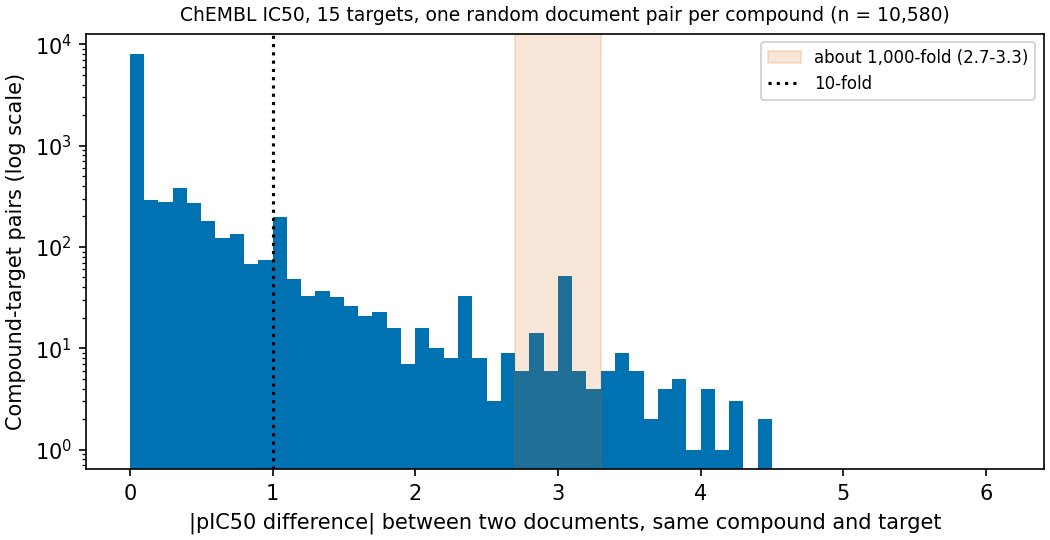
Figure 1. Differences for 10,580 document pairs. The vertical scale is logarithmic, and the zero-difference bar dominates.
Exact agreement occurs in 70.2% of pairs. Requotation is one explanation, but rounding and genuinely equal experimental results are also possible. Equality alone does not identify reuse. ChEMBL flags 15,396 of the 123,300 original records, or 12.5%, as potential duplicates.
Table 1. Conditional R² ceilings under alternative duplicate handling.
| Handling | Pairs | Difference SD (log units) | At least tenfold disagreement | R² ceiling scenario (95% interval) |
|---|---|---|---|---|
| Include exact matches (planned primary analysis) | 10,580 | 0.53 | 6.2% | 0.91 (0.90–0.92) |
| Exclude exact matches | 3,151 | 0.97 | 20.9% | 0.70 (0.67–0.72) |
| Exclude ChEMBL duplicate flags (post hoc) | 2,810 | 1.13 | 30.9% | 0.59 (0.56–0.62) |
Reused measurements create apparent agreement without independent replication. After exclusions, difference SD is around one log unit and 20–30% of retained pairs differ at least tenfold. However, removing exact matches also selects for disagreement and removes genuinely matching experiments, potentially inflating variability. Duplicate flags provide another imperfect filter. Thus 0.59–0.91 is a range of scenarios, not guaranteed bounds on the actual benchmark ceiling, and 0.59–0.70 does not certify independent-measurement limits.
Kramer and colleagues identified substantial reuse among apparent repeat public Ki measurements (4). Landrum and Riniker likewise documented noise when combining IC50 and Ki values across sources (5).
Peaks near tenfold and thousandfold differences
The distribution contains narrow peaks. A post hoc count estimates excess pairs relative to the average of neighboring bins.
Table 2. Post hoc counts of peaks in document differences.
| Difference (log units) | Approximate ratio | Pairs | Expected without peak | Excess (fraction of all pairs) |
|---|---|---|---|---|
| 1.0–1.1 | 10-fold | 197 | 61 | 136 (1.3%) |
| 2.3–2.4 | About 200-fold | 33 | 8 | 25 (0.2%) |
| 3.0–3.1 | 1,000-fold | 52 | 6 | 46 (0.4%) |
A thousandfold peak is compatible with confusion between nM and µM, but individual errors were not verified. Tenfold differences can result from transcription mistakes, assay conditions, censoring such as “greater than 10 µM,” or rounding. The 2.3-unit peak alone does not establish its cause; mixing natural and base-ten logarithms does not universally generate that difference.
A prespecified wider statistic compares the 2.7–3.3 interval against adjacent intervals and gives a 0.3% excess in the primary analysis. Bin choice changes the estimate; this is an alternative aggregation, not a rigorous lower bound. Removing approximately thousandfold differences raises the primary ceiling scenario from 0.91 to 0.93.
Bindwell also describes thousandfold unit errors in licensed CRO data. Of 10,972 values shared between its Datawell extraction pipeline and CRO data, 8,566 (78.1%) agree exactly. Human curation and LLM extraction can both leave label discrepancies.
Target-specific variation
For pairs excluding exact matches, I calculated ceilings using either benchmark variance 1.56 or the target’s own pIC50 variance. The latter changes with the chemical range represented within each target and remains conditional on the error assumptions.
Table 3. Target-specific R² ceiling scenarios.
| Target | Pairs | Benchmark-scaled ceiling (95% interval) | Within-target ceiling |
|---|---|---|---|
| BRAF | 305 | 0.91 (0.86–0.95) | 0.81 |
| PI3Kα | 92 | 0.89 (0.84–0.93) | 0.86 |
| EGFR | 580 | 0.73 (0.68–0.77) | 0.74 |
| JAK2 | 536 | 0.60 (0.52–0.67) | 0.26 |
| PARP1 | 85 | 0.52 (0.31–0.71) | 0.59 |
| hERG | 216 | 0.15 (−0.07–0.35) | 0.20 |
All 15 targets are provided in the downloadable CSV. JAK2 has the largest discrepancy between denominators: its within-target variance is only 0.85, giving 0.26 rather than 0.60. The same absolute variability consumes a larger fraction of a narrow range. hERG has low ceilings under both denominators and a cross-document difference SD of 1.6 log units. Differences between binding assays and patch-clamp measurements are a possible explanation, but assay methods were not checked here. Target-specific counts range from 36 to 580 and intervals are wide. Benchmark target composition can therefore matter substantially.
Interpreting the reported model scores
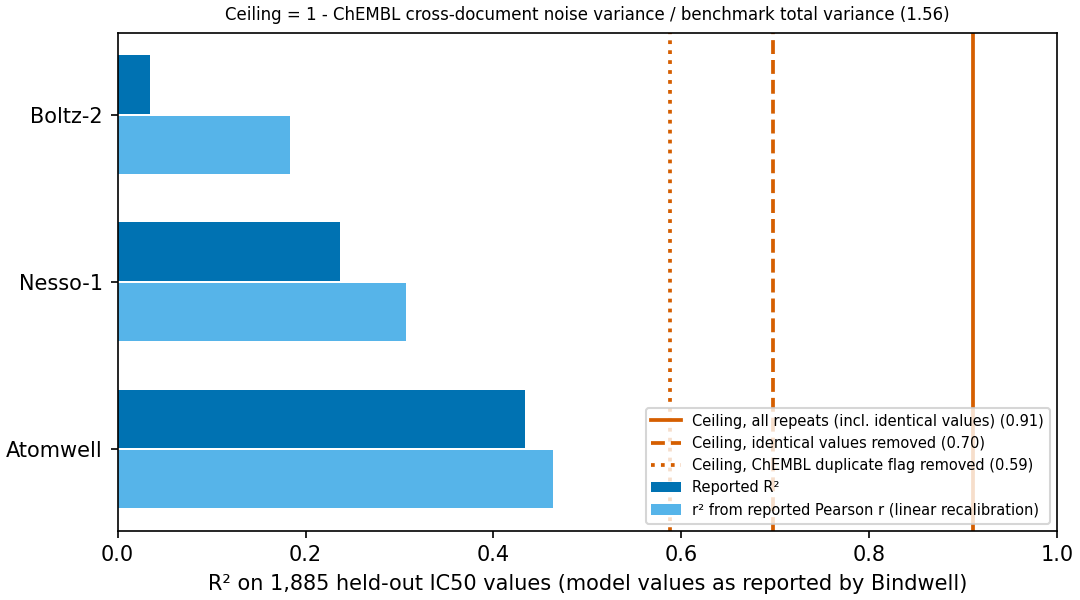
Figure 2. Reported R² (dark blue), squared Pearson correlations (light blue), and three ceiling scenarios from alternative duplicate handling (vertical lines).
Dividing Atomwell’s 0.434 by 0.59–0.70 gives 62–74%. This is a scenario-dependent ratio, not a measurement of its actual fraction of attainable performance.
For Boltz-2, Pearson r=0.429 gives r²=0.184. This equals R² after fitting an affine calibration with an intercept on the evaluation set itself. Differences between r² and reported R² are approximately 0.15 for Boltz-2, 0.07 for Nesso-1 and 0.03 for Atomwell. Part of the low Boltz-2 score is therefore scale mismatch, but calibration on the same evaluation data is optimistic and is not external validation. Pearson correlation describes linear association, not rank correlation. Comparisons must specify whether recalibration is allowed.
Bindwell fits out-of-distribution FVU as E+A/N^α+B/D^β, reporting E=0.104 and FVU=0.272 for the 9B model. The ChEMBL scenarios expressed as floors are 0.09 with exact matches, 0.30 without exact matches and 0.41 after duplicate flags. The 9B score lies below the latter two but above 0.09. E is a fitted scaling parameter, not a direct estimate of measurement noise.
These quantities concern different datasets. The blog’s FVU uses a 540,000-measurement validation set with undisclosed total variance and noise, while training includes 13 measurement types, including IC50. Lower validation variability, nonindependent reporting, or prediction of systematic assay effects could explain differences. The blog states that compounds do not overlap across its out-of-distribution split, so a reuse hypothesis would need a mechanism beyond compound overlap. The unpublished validation set prevents distinguishing these explanations.
Scope of the ceiling scenarios
Cross-document IC50 variability depends strongly on duplicate handling. Different assays may not measure the same latent quantity, violating a simple independent-error model. The 0.59–0.91 scenarios cannot be generalized to all affinity prediction or Atomwell’s actual limit.
It is unknown whether the 1,885 labels are individual measurements or document means, how noisy they are, or whether reuse or leakage occurs. The 15 well-studied targets are a selected sample and only IC50 is analyzed. Models receiving assay conditions may predict systematic differences such as substrate-concentration effects. Reporting dataset-specific replication information alongside scores would improve interpretation of 0.434; the present analysis demonstrates that need without establishing the hidden benchmark’s true ceiling.
Implementation checks
An independent base-R implementation reproduced the all-pairs count of 165,494, noise variance, tenfold-disagreement fraction and exact-match fraction within 1×10⁻⁶. Six synthetic-data tests cover noise-variance recovery and thousandfold-error detection. Repeated runs on SHA-256-fixed inputs produce byte-identical result files.
Data and code availability
Reproduction command: python acquire.py && python test_analysis.py && python analysis.py && python figures.py && Rscript validate.R. The environment uses Python 3.12 with numpy, pandas, matplotlib and requests, plus R 4.5.3 with jsonlite. The companion archive contains the analysis plan, code, input acquisition instructions and checksums, results and validation outputs.
References
1. Anand N, Goel R. The bitter lesson for biology. Bindwell. 2026 October 18. Article.
2. Valence Labs. Nesso-1 technical report. 2026. Report.
3. Zdrazil B, Felix E, Hunter F, Manners EJ, Blackshaw J, Corbett S, et al. The ChEMBL Database in 2023: a drug discovery platform spanning multiple bioactivity data types and time periods. Nucleic Acids Research. 2024;52:D1180–D1192. doi:10.1093/nar/gkad1004.
4. Kramer C, Kalliokoski T, Gedeck P, Vulpetti A. The experimental uncertainty of heterogeneous public Ki data. Journal of Medicinal Chemistry. 2012;55:5165–5173. doi:10.1021/jm300131x.
5. Landrum GA, Riniker S. Combining IC50 or Ki values from different sources is a source of significant noise. Journal of Chemical Information and Modeling. 2024;64:1560–1567. doi:10.1021/acs.jcim.4c00049.