How far RNA changes reflect protein changes after perturbation: a check with surface proteins in the same cells
Public CRISPR knockout data with RNA and surface proteins measured in the same cells were recomputed. The noise-corrected correlation between RNA and protein changes was 0.42, and for some knocked-out genes the protein fell while the gene's own mRNA barely changed.
On this page
Most perturbation-prediction models target changes in RNA, but many drug targets and surface molecules recognized by immune cells are proteins. I recomputed public CRISPR knockout data from melanoma cells in which RNA and surface proteins were measured in the same cells (Perturb-CITE-seq) and asked how closely knockout-induced changes in RNA and in protein correspond. For the knocked-out gene itself, in 5 of 16 gene-by-condition pairs in which the protein fell by 0.5 or more (two genes, CD274 and CD58), the mRNA fell by less than 0.1. PD-L1 (CD274) met this in all three conditions (this counting was chosen after seeing the results). For the indirect effects of knocking out other genes (13,251 pairs), the Pearson correlation between RNA and protein changes was 0.26, and 0.42 after correcting for measurement noise (0.40–0.52 across sensitivity analyses). I did not compute confidence intervals. The primary corrected correlation, 0.42, falls in the prespecified descriptive category “does not represent well”, and reading protein changes from RNA changes alone has limits. The correlation is an association within one data set, not the performance of a prediction model, and the results are restricted to 19 surface proteins, one patient-derived melanoma cell model and knockout perturbations.
Introduction
Among models that predict cellular responses to perturbation, GEARS and scGen are trained on single-cell RNA expression data and predict changes in RNA expression after a perturbation (1, 2). The Virtual Cell concept, which aims at simulating cells computationally, envisions multi-scale, multi-modal models (3). Yet many drug targets and many molecules that immune cells recognize on the cell surface are proteins. How far an RNA-based evaluation of a model can inform protein-level decisions depends on how closely RNA changes and protein changes correspond.
mRNA and protein levels correspond to a degree, but it is known that mRNA level alone often fails to account for protein level. Schwanhäusser et al. measured mRNA and protein abundance and half-lives together for more than 5,000 genes in mammalian cultured cells and reported that the two levels correlated better than previously thought, whereas half-lives showed no correlation and protein abundance was predominantly controlled at the level of translation (4). Liu et al. reviewed the relationship between mRNA and protein levels in several scenarios, from steady state to short-term adaptation, and concluded that transcript levels by themselves are not sufficient to predict protein levels in many scenarios (5). The review by Buccitelli and Selbach states that the two levels typically show reasonable correlation but that transcriptomics and proteomics provide non-redundant readouts (6). In an ovarian cancer xenograft model with 29 genes under drug treatment, differentially expressed mRNAs correlated better with their protein products than non-differentially expressed mRNAs (7). These concern comparisons of levels across genes or cells, or observations over time after drug treatment; how well changes induced by CRISPR disruption of a gene agree within the same cells is a separate question.
The data are the melanoma-cell Perturb-CITE-seq data published by Frangieh et al. (8). In Perturb-CITE-seq, genes are knocked out one at a time with CRISPR (disrupting gene function), and RNA and surface proteins are measured together in each single cell. The original study used protein measurements in addition to RNA to investigate mechanisms of immune evasion by cancer cells (8). It also noted that only some of the protein-level differences between conditions (control, IFNγ, co-culture) were observed at the level of the corresponding transcript, and stated that simultaneous RNA and protein detection is important (8, original Figure 3c). Papalexi et al., who studied regulators of PD-L1 with ECCITE-seq, likewise used simultaneous measurement to distinguish transcriptional from post-transcriptional regulation (9). Here, using the same data, I quantify the correspondence of changes for each knockout rather than differences between conditions.
The question of interest (QOI) is how well the change in the mRNA of a gene after CRISPR knockout corresponds to the change in the surface protein that gene encodes. Correspondence here means correlation or agreement within the same data, not predictive performance on held-out data. I separated two targets.
- (a) Direct target: the protein of the knocked-out gene itself.
- (b) Indirect effects: changes in measured proteins when other genes are knocked out.
The context of use (COU) is to provide a yardstick for judging perturbation predictions trained and evaluated on RNA alone when they are used for protein-level decisions (target expression, surface antigens, immune evasion). The performance of any specific model is not evaluated.
Methods
Data
Frangieh et al. performed a CRISPR knockout screen in one patient-derived melanoma cell model and cultured the cells in three conditions (8). The analyzed cells are those alive in each condition; in co-culture only cells that survived killing by T cells remain (8).
- Control (no treatment).
- Stimulation with IFNγ (interferon-γ, an immune signaling molecule).
- Co-culture with T cells that attack cancer cells.
I used the scPerturb release as input (10, 11). The data are licensed CC BY 4.0 and can be downloaded without registration.
- 218,331 cells.
- 20 surface proteins, measured by counting DNA tags attached to antibodies (antibody-derived tags, ADT). The measurement derives from CITE-seq (12).
- Four isotype controls (antibodies without a target), which serve as a background guide.
- Of the 20 proteins, 19 whose corresponding gene's RNA was measured were used.
Among the knocked-out genes, 236 retained pairs with 30 or more cells (results/all-pairs.csv).
Assignment of cells to knockouts used the scPerturb labels as they are. Frangieh et al. noted that detecting a guide RNA in a cell does not guarantee a successful perturbation and updated the assignments by the probability of success (8). I did not remove cells in which the perturbation had not worked, and I did not check whether the scPerturb release applies such a step.
Values and definition of change
- RNA: Each cell's counts were scaled to a total of 10,000 (CP10k) and transformed with log1p (add 1, then take the natural logarithm).
- Protein: ADT counts were normalized per cell by the centered log-ratio (CLR). CLR is log1p(count) minus the mean log1p count across that cell's 19 proteins. Stoeckius et al. treated ADT as compositional data within a cell and transformed it by CLR (12). Frangieh et al. used a different normalization (the log of the ratio to the count of the corresponding IgG control) (8), so the protein values here differ from the original normalization.
- Change: For each knockout and condition, cell means were taken, and the difference from the mean of control cells in the same condition was defined as the change. Pairs with fewer than 30 cells were excluded. RNA changes are differences in log1p and protein changes are differences in CLR; both are in natural-logarithm units and dimensionless. For an ordinary log ratio, −1 corresponds to a factor of about 0.37; the mean log1p differences and centered CLR differences here cannot be directly converted into a roughly 60% reduction in molecule numbers. However, a difference in RNA log1p is smaller than the relative change for genes with low expression. I do not report the baseline expression of each gene in this article, so RNA changes cannot be converted into relative changes.
Noise correction and decision rule
Measurement noise makes the correlation between RNA and protein changes look weaker than it is. I corrected the correlation as follows.
- Knockout cells and control cells were each randomly split into two halves (the seed was fixed at 20261020). The two halves share no cells.
- Agreement between the changes computed from each half (reliability) was calculated separately for RNA and protein. Reliability from half of the cells was converted to a value for all cells with the Spearman–Brown formula (13, 14), which gives the reliability of a measurement doubled in length from the half-sample value.
- The correlation was divided by the square root of the product of the two reliabilities (correction for attenuation (15)). This estimates the correlation that would be obtained without noise, and assumes the noise is independent.
- A "pair with a large protein change" was defined as one whose change was at least three times the noise standard deviation estimated from the difference between the halves.
The reliability here reflects only noise from sampling cells. Systematic differences that reproduce between halves (antibody specificity, quirks of normalization, and variation shared by RNA and protein when a knockout shifts cell state) count as signal and are not removed by the correction.
The decision rule fixed in advance was: a corrected correlation below 0.5 is described as "RNA changes do not represent protein changes well", 0.5 to 0.8 as "partly represent", and 0.8 or more as "represent well". The thresholds of 0.5 and 0.8 are cut points chosen for this analysis without a statistical basis.
Analysis plan and post hoc changes
- The analysis plan was fixed before computation (2026-10-20).
- The first computation did not split control cells. This inflates reliability, so the split was added. The corrected correlation changed from 0.422 to 0.423.
- Metrics and sensitivity analyses added after seeing the results are marked "post hoc". These are the threshold for a "clear protein decrease" in direct targets (a decrease of 0.5 or more in CLR), the counting restricted to those pairs, the two sensitivity analyses addressing the properties of CLR, the median of per-protein correlations, the centered correlation, and the correlation among pairs with large protein changes.
- CLR was computed over the 19 proteins that have a corresponding RNA. The plan said 20; CD279 (PDCD1) has no corresponding RNA and was excluded.
- The sensitivity analysis "guide RNA count of one or fewer" was planned as restriction to cells with a multiplicity of infection (MOI) of 1. In the implementation it is restricted to cells with one or fewer guides, and control cells include cells with no detected guide.
Implementation checks
- Independent recomputation: I read the file directly with h5py and rewrote the library-size calculation, CLR and group means in separate code. Direct-target values agreed within a maximum difference of 4.9×10⁻⁶, and the indirect-effect correlation (0.26475) and number of pairs (13,251) also agreed (
results/validation.json). - Unit tests: Four points were checked on synthetic data (
test_analysis.py). - The difference from the control in the same condition.
- The Spearman–Brown formula.
- Recovery of the true correlation by the attenuation correction.
- Each CLR row summing to 0.
- Reproducibility: Rerunning with the same seed gave byte-identical result files. Inputs are pinned by SHA-256.
Results
The knocked-out gene's own RNA and protein
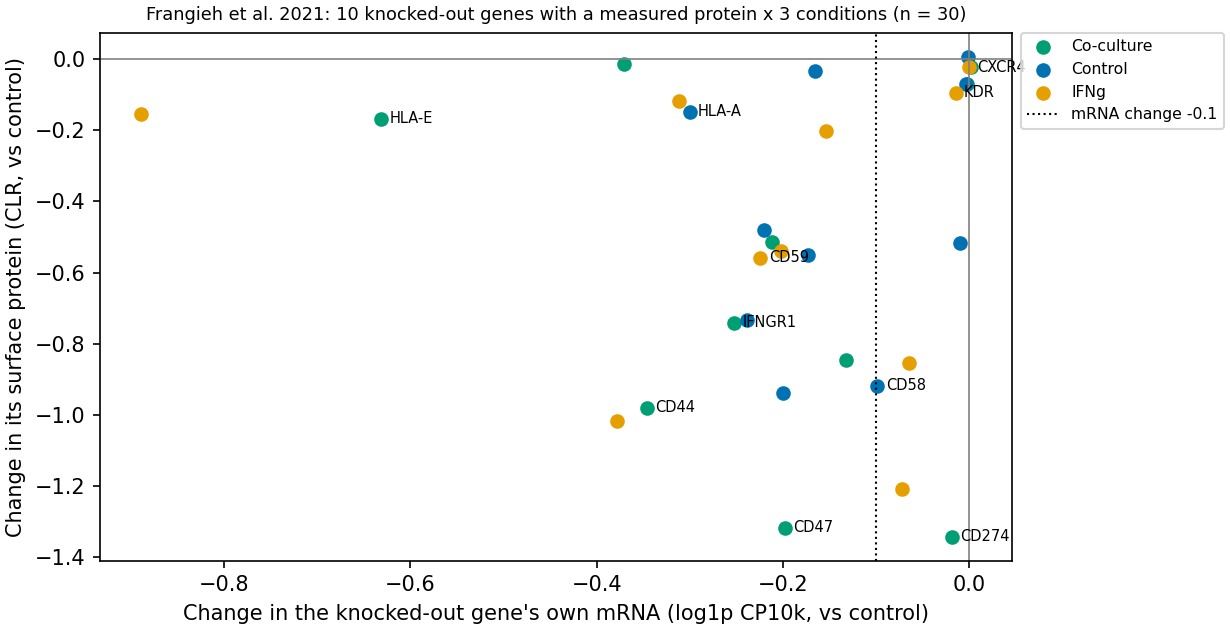
Figure 1. Change in the mRNA of the knocked-out gene and change in its protein. 10 genes × 3 conditions = 30 points (x axis: mRNA change, difference in log1p; y axis: protein change, difference in CLR; both in natural-logarithm units). The dotted line marks an mRNA change of −0.1.
Table 1 shows the values for each knocked-out gene (mean of the three conditions).
Table 1. Changes in mRNA and protein of the knocked-out gene itself (mean of three conditions)
| Knocked-out gene | mRNA change (mean of 3 conditions) | Protein change (mean of 3 conditions) |
|---|---|---|
| CD274 (PD-L1) | −0.03 | −1.02 |
| CD58 | −0.10 | −0.87 |
| CD47 | −0.26 | −1.09 |
| CD44 | −0.26 | −0.75 |
| CD59 | −0.22 | −0.52 |
| IFNGR1 (CD119) | −0.19 | −0.50 |
| HLA-A | −0.33 | −0.09 |
| HLA-E | −0.56 | −0.12 |
Notes: mRNA is the difference in log1p and protein is the difference in CLR. CXCR4 and KDR, whose changes were barely measurable, are omitted. The table shows means over three conditions; the counts below were determined per condition. PD-L1 is the protein encoded by the CD274 gene, IFNGR1 is interferon-γ receptor 1, and HLA is human leukocyte antigen. B2M is β2-microglobulin, a component of HLA class I molecules. Source: results/direct-targets.csv.
The counting and results are as follows.
- Planned metric: Of 30 pairs, the mRNA decreased by less than 0.1 in 11/30 (37%). This includes pairs in which the protein also did not change (CXCR4, KDR). I therefore added the following counting after seeing the results (post hoc).
- Scope: From 10 genes × 3 conditions = 30 pairs, the six pairs for CXCR4 and KDR were removed, leaving 24 pairs.
- Pairs with a clear protein decrease: There were 16/24 pairs (a CLR decrease of 0.5 or more; this threshold was also chosen post hoc).
- Pairs in which the mRNA hardly decreased: Among these 16 pairs, 5 (31%) had an mRNA decrease below 0.1. These were CD274 in all three conditions and CD58 in two conditions (decreases of 0.07 with IFNγ and 0.099 in control; the latter is just at the boundary).
- Counting by gene: Among the six genes that had pairs with a clear protein decrease (CD274, CD44, CD47, CD58, CD59, IFNGR1), two (CD274 and CD58) had conditions in which the mRNA hardly decreased. The three conditions are repeats of the same gene and not independent observations, so the 5 pairs cannot be counted as 5 independent examples. In the remaining 11 pairs, the mRNA decrease was 0.13–0.38, smaller than the protein decrease in the same pairs (0.5–1.3) (
results/direct-targets.csv). However, mRNA is on the log1p scale and protein on the CLR scale, so the magnitudes cannot be compared directly.
The reason the mRNA fell so little was not tested in this analysis. Possible explanations are as follows.
- Incomplete nonsense-mediated mRNA decay (NMD): CRISPR knockout introduces small deletions or insertions in DNA so that a premature stop codon appears and the protein cannot be made. If the machinery that degrades defective mRNA (NMD) does not work well enough, the mRNA level changes little. NMD efficiency varies with the position of the stop codon and is low downstream of the last exon junction (16). In addition, CRISPR-induced mutations have been reported to produce aberrant mRNAs or proteins in about half of the cell lines examined (17).
- Measurement: A measurement that counts the 3' end side of mRNA cannot see differences in the edited position.
- Mixed cells and misassignment: Unedited cells are mixed in, or guide RNAs (short RNAs that specify the CRISPR target) are misassigned to cells. Mixing unedited cells can attenuate both readouts, but log1p at low expression and compositional CLR need not respond proportionally to the same mixture fraction. A mean CLR decrease does not identify the fraction of cells lacking protein or the mRNA within those cells. Without per-cell distributions and editing states, this analysis does not determine whether mixing alone explains the discrepancy.
- Condition-dependent induction: The influence of induction by conditions such as IFNγ.
Under any of these explanations, looking at RNA alone makes these knockouts appear not to have worked.
HLA-A and HLA-E are the opposite examples: the mRNA fell but the protein hardly changed.
- HLA-E: The mean protein signal did not exceed the mean of the isotype controls (
results/protein-background.csv), so the protein is probably not measured above background. Methods that estimate and correct ADT background using isotype controls and empty droplets have been proposed (18); "exceeding the isotype-control mean" here is a simpler guide than those. - HLA-A: This would be explained if the antibody recognizes not only HLA-A but also other HLA class I molecules (HLA-B, HLA-C). The original paper writes MHC class I together as "HLA-A,B,C" (8). I did not check the antibody clone for this feature in the supplementary tables, so whether it measures HLA-A alone is unconfirmed.
For CXCR4 and KDR, neither RNA nor protein changed much. The KDR protein was also at background level, and its expression in these cells appears to be low to begin with.
Indirect effects of knocking out other genes
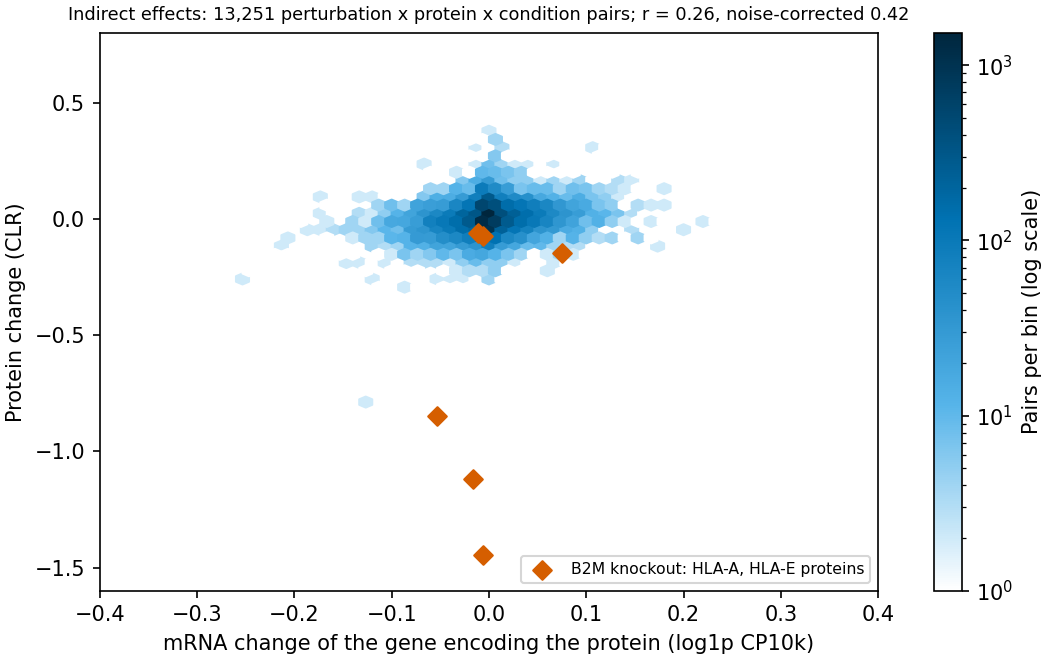
Figure 2. Indirect effects: change in mRNA and change in protein. For pairs of a knocked-out gene and the protein of another gene (13,251 pairs), the mRNA change (x axis) and the protein change (y axis) are plotted. Color indicates the density of pairs. Red diamonds show the HLA-A and HLA-E proteins when B2M was knocked out. Eighteen pairs outside the x-axis range (−0.4 to 0.4) are not shown. Units are the same as in Figure 1.
The correlation here is the Pearson correlation computed over 13,251 pooled pairs: knockout × 19 proteins × 3 conditions, restricted to pairs with 30 or more cells and excluding the 30 direct-target pairs (236 knocked-out genes). Because pairs that share the same knockout or the same control are included, the pairs are not independent of one another. Table 2 gives the results.
Table 2. Main analysis of indirect effects
| Metric (main analysis, 13,251 pairs) | Value |
|---|---|
| Correlation between RNA and protein changes | 0.26 |
| Split-half reliability (RNA/protein, converted to all cells) | 0.62/0.64 |
| Correlation corrected for attenuation | 0.42 |
| Pairs with a large protein change (at least 3 × noise) | 576 pairs |
| Of these, proportion with the same direction of mRNA change (50% by chance) | 67% |
| Correlation among pairs with a large protein change | 0.49 |
Notes: The pairs with agreeing direction numbered 387/576. Source: results/indirect-summary.csv. The 50% chance comparison assumes independent signs and balanced positive/negative marginal frequencies; it is not an estimated null distribution for these data.
The corrected correlation of 0.42 falls on the "does not represent well" side of the rule fixed in advance. Across the pooled data, only one post hoc sensitivity analysis (0.52) exceeded 0.5. When split by condition, co-culture gave 0.49 in the main analysis (CLR) and 0.49–0.56 across the other settings, some of which exceeded 0.5 (results/indirect-summary.csv). The 0.5 is a cut point of the rule, and the difference between 0.42 and 0.52 lies within the range that moves with analytic choices. The slope from regressing the protein change on the RNA change was 0.39.
The effect of how the data were aggregated was as follows.
- After subtracting the mean for each protein × condition (centering), the correlation was 0.27, unchanged. Average differences between proteins do not create the correlation.
- When the correlation was computed separately for each protein × condition, the median was 0.15. For a single protein, most knockouts produce small changes, and the correlation is lower still.
The corrected correlations by condition were 0.49 in control, 0.34 with IFNγ and 0.49 in co-culture. In control, the RNA reliability was low at 0.25. The changes themselves were small, and the corrected value is uncertain. I attached no interval to the differences between conditions, so whether they differ cannot be judged.
Table 3 shows the sensitivity analyses.
Table 3. Corrected correlation in the sensitivity analyses
| Setting | Corrected correlation |
|---|---|
| Main analysis (CLR, all cells) | 0.42 |
| Cells with 1 or fewer guide RNAs (control includes cells with no detected guide) | 0.40 |
| Protein normalized by total ADT | 0.44 |
| Protein normalized by total RNA counts (post hoc) | 0.48 |
| Restricted to the 14 proteins above background (post hoc) | 0.52 |
Notes: "Above background" means the protein's mean exceeds the mean of the isotype controls. Source: results/indirect-summary.csv.
The two post hoc sensitivity analyses were added because of a property of CLR. CLR is referenced to the mean of 19 proteins, so when one protein falls strongly, other proteins appear to rise. Indeed, when B2M was knocked out, HLA-A fell while many of the 17 proteins other than HLA-A and HLA-E rose in CLR (condition-wise medians 0.04–0.09, maximum 0.34). The corrected correlation was 0.48 after normalization by total RNA counts and 0.52 when limited to the 14 proteins above background. The corrected correlations range from 0.40 to 0.52, and their squares range from 0.16 to 0.27. Under independent-error and other correction assumptions, this is an indication of a pooled latent linear association, not held-out explained variance or a ceiling on prediction performance.
The shared variation that reproduces between halves can also include the effect of a knockout shifting cell state, such as cell cycle or cell complexity (UMI count), which moves RNA and protein together. Frangieh et al. treated these as covariates (8); I did not adjust for them. Because this contribution cannot be separated, 0.42 cannot be read as the strength of the gene-by-gene correspondence from transcription to translation itself.
When B2M was knocked out, the HLA-A protein (as measured by its antibody) fell by 0.85–1.45 in CLR, whereas the HLA-A mRNA change was −0.05 to −0.01. B2M is a component of HLA class I molecules, and loss of MHC class I presentation through B2M mutation is known as a clinical mechanism of resistance to immunotherapy, as the original paper also states (8). One interpretation is therefore that, after B2M knockout, HLA-A RNA is still produced but the protein is no longer detected at the surface. The mechanism itself was not tested in this analysis. The effect is not visible in the HLA-A RNA. This pair is one example consistent with the interpretation that disagreement between RNA and protein can arise in post-transcriptional processes. Excluding the B2M pairs left the uncorrected correlation at 0.27, essentially unchanged (results/b2m.csv, results/all-pairs.csv).
Discussion
What an RNA-only evaluation misses
As a matter of fact, in these data the corrected correlation ranged from 0.40 to 0.52 and its square was 0.16–0.27. These squared values indicate a latent linear association pooled across 19 proteins under the correction assumptions; they are not held-out explained variance. Among the 576 pairs with large protein changes, the sign of the mRNA change did not agree in 189. This count includes pairs in which the mRNA change stayed within noise, and it does not distinguish "the mRNA did not move" from "the mRNA moved in the opposite direction".
As interpretation, what can be said is that in these data the linear correspondence from RNA change to protein change is partial. What was measured is a correlation within the same data, not a prediction error for held-out knockouts. The accuracy of fitted functions, such as ones with a different slope for each protein or nonlinear ones, was not evaluated. Whether the weak correspondence arises from biological differences such as post-translational control, from measurement differences due to antibodies or normalization, or from shared variation when a knockout shifts cell state cannot be separated in these data.
Using an RNA-only prediction as is for protein-determined decisions, such as immune evasion or expression of the target of an antibody drug, is not supported, at least in these data. However, this article does not evaluate any specific model; the statement means only that the same limitation would remain even if a model reproduced the RNA changes correctly.
That the mRNA of the target gene does not fall does not mean the knockout failed to work: in two of the six genes whose protein fell (CD274 and CD58), there were conditions in which the mRNA hardly fell. Using the change in the target's mRNA as the "size of the effect" in an evaluation metric overlooks effects such as those of these two genes. In the other four genes the mRNA also fell by 0.1 or more, so this is not a property of all genes.
The protein side also has measurement limits. Only about 20 surface proteins are measured by antibodies, and they are affected by antibody specificity and background. The position of this analysis is not to decide whether RNA or protein is "correct", but to show where the two disagree when both are measured.
Comparison with earlier studies
Frangieh et al. reported that only some of the protein differences between conditions were seen in RNA, while stating that genes affecting susceptibility to killing by T cells are broadly concordantly regulated at the protein and RNA levels (8). The present results do not contradict these two statements: for CD47, CD58 and IFNGR1 the RNA and protein decreased in the same direction, but the magnitudes corresponded only partly. The original paper compares conditions and this article addresses changes for each knockout, so the numbers are not directly comparable.
Koussounadis et al. reported that, for 29 genes in drug-treated xenografts, differentially expressed mRNAs correlated better with their protein products (7). That the correlation among pairs with large protein changes in this article (0.49, uncorrected) is higher than the overall value (0.26, uncorrected) is similar in direction. However, Koussounadis et al. selected by mRNA change whereas this article selected by protein change. With the axis of selection reversed and the systems different, this is neither agreement nor disagreement.
Papalexi et al. studied regulators of PD-L1 with simultaneous RNA and protein measurement, distinguished transcriptional from post-transcriptional regulation, and developed mixscape, which removes cells in which the perturbation did not work (9). This article has no such removal, and I did not evaluate how removal would change the size of the effects.
The scope of the literature check is as follows. I read the full text of Frangieh et al. For the other cited papers, I checked the abstract and bibliographic information.
What the results change
For reading the source study, among the grounds on which Frangieh et al. stress simultaneous measurement, the correspondence with RNA changes for the 19 surface proteins is estimated here at 0.40–0.52 after correction. The values, however, are for a CLR normalization different from the original and for labels whose assignments were not updated.
An evaluation that compares perturbation-prediction models by how well they reproduce RNA changes does not guarantee the ranking for questions about surface proteins. Under the correction assumptions, the squared correlation for the pooled simple linear association was 0.16–0.27. This is, however, a single relationship pooled over proteins; relationships estimated for each protein or condition were not examined.
A design that confirms the knockout efficiency of a direct target by mRNA would miss genes such as CD274 and CD58. In these data, for two of the six genes whose protein fell, protein measurement was needed as the indicator of efficiency. With so few genes, however, a rule that decides in advance which genes can be confirmed by mRNA cannot be derived from these data.
The corrected correlation by condition ranged from 0.34 to 0.49, and in co-culture some normalizations exceeded 0.5. If the correspondence from RNA to protein differs by condition, a correspondence estimated in one condition cannot be transferred to another. However, I attached no interval to the differences between conditions, so I cannot say that they differ.
Limitations
- Generalization: These are results from one patient-derived melanoma cell model. It is unknown whether they apply to other patients, other cell types, intracellular proteins, modifications such as phosphorylation, or perturbations other than knockout (inhibitors, CRISPRa).
- Type of evaluation: The correlations and agreement rates are associations within the same data, not predictive performance on held-out data.
- Selection of targets: The 19 proteins are biased toward immune-related surface molecules.
- Antibody specificity: Antibodies may recognize other molecules (for example HLA-A). The CITE-seq antibody clones were not checked.
- Normalization and scale: Values change with the protein normalization method (the range is shown in the sensitivity analyses). The original paper used a ratio to IgG controls, which differs from the CLR here. The difference in RNA log1p depends on expression level and cannot be compared directly in size with the difference in protein CLR.
- Shared variation: The correction removes only sampling noise. Shared variation from a knockout shifting cell state can be included in the correlation.
- Selection in co-culture: The co-culture cells are those that survived killing by T cells, so changes in that condition can include the influence of selection.
- Timing: RNA and protein were measured at the same time point, so the time lag (RNA changes first and protein later) cannot be assessed.
- Uncertainty: Confidence intervals for the direction agreement rate and the correlations were not computed. Pairs share knockouts and controls and are not independent, so a naive interval is unsuitable. Reliability was estimated from a single random split. The differences between conditions also have no interval.
- Thresholds: The 0.5 for a clear protein decrease, the 0.1 for an mRNA that did not fall, the factor of 3 for a large change, and the 0.5 and 0.8 of the decision rule are arbitrary criteria. The count of 5/16 depends on them, and the CD58 decrease in control (0.099) lies just inside the threshold. The 5 pairs include repeats of 2 genes.
- Knockout efficiency and assignment: Whether cells were edited was not verified, guide RNA assignments are the scPerturb labels as they are, and cells in which the perturbation did not work were not removed. How the effect sizes would change if they were removed was not evaluated.
- Scope of the literature check: Only the full text of Frangieh et al. was read. Statements about other papers are limited to their abstracts.
Conclusion
In these data (one patient-derived melanoma cell model, CRISPR knockout, 19 surface proteins), changes in RNA reflected changes in protein only to the extent that the rule fixed in advance describes as "does not represent well". For the knocked-out gene itself, in two of the six genes whose protein fell clearly (CD274 and CD58), there were conditions in which the mRNA fell by less than 0.1 (5 of 16 pairs). The target's mRNA can fail as an indicator of effect. For indirect effects, the corrected correlation was 0.42 (0.40–0.52 in sensitivity analyses, up to 0.56 in co-culture alone), below the 0.5 fixed in advance in the main analysis. This is an association within the same data, not the performance of a prediction model. No uncertainty intervals are attached, and the results are limited to one cell model and one measurement platform.
Data and code availability
The analysis plan, the code for acquisition, aggregation, testing, figures and independent recomputation, the SHA-256 of the inputs, the result tables and the validation results are included in the companion material. The input h5ad files (about 1.5 GB) are not included and are downloaded from scPerturb on Zenodo (CC BY 4.0) (11). The rerun is performed in this order.
python acquire.py && python test_analysis.py && python analysis.py && python figures.py && python validate.py
The environment is Python 3.12 with anndata, h5py, numpy, scipy, pandas, matplotlib and requests. The random seed was fixed at 20261020. The figures were produced in this analysis and no figures from the original paper were reproduced.
References
- Roohani Y, Huang K, Leskovec J. Predicting transcriptional outcomes of novel multigene perturbations with GEARS. Nat Biotechnol. 2024;42(6):927–935. doi:10.1038/s41587-023-01905-6.
- Lotfollahi M, Wolf FA, Theis FJ. scGen predicts single-cell perturbation responses. Nat Methods. 2019;16(8):715–721. doi:10.1038/s41592-019-0494-8.
- Bunne C, Roohani Y, Rosen Y, Gupta A, Zhang X, Roed M, et al. How to build the virtual cell with artificial intelligence: priorities and opportunities. Cell. 2024;187(25):7045–7063. doi:10.1016/j.cell.2024.11.015.
- Schwanhäusser B, Busse D, Li N, Dittmar G, Schuchhardt J, Wolf J, et al. Global quantification of mammalian gene expression control. Nature. 2011;473(7347):337–342. doi:10.1038/nature10098.
- Liu Y, Beyer A, Aebersold R. On the dependency of cellular protein levels on mRNA abundance. Cell. 2016;165(3):535–550. doi:10.1016/j.cell.2016.03.014.
- Buccitelli C, Selbach M. mRNAs, proteins and the emerging principles of gene expression control. Nat Rev Genet. 2020;21(10):630–644. doi:10.1038/s41576-020-0258-4.
- Koussounadis A, Langdon SP, Um IH, Harrison DJ, Smith VA. Relationship between differentially expressed mRNA and mRNA-protein correlations in a xenograft model system. Sci Rep. 2015;5:10775. doi:10.1038/srep10775.
- Frangieh CJ, Melms JC, Thakore PI, Geiger-Schuller KR, Ho P, Luoma AM, et al. Multimodal pooled Perturb-CITE-seq screens in patient models define mechanisms of cancer immune evasion. Nat Genet. 2021;53(3):332–341. doi:10.1038/s41588-021-00779-1.
- Papalexi E, Mimitou EP, Butler AW, Foster S, Bracken B, Mauck WM, et al. Characterizing the molecular regulation of inhibitory immune checkpoints with multimodal single-cell screens. Nat Genet. 2021;53(3):322–331. doi:10.1038/s41588-021-00778-2.
- Peidli S, Green TD, Shen C, Gross T, Min J, Garda S, et al. scPerturb: harmonized single-cell perturbation data. Nat Methods. 2024;21(3):531–540. doi:10.1038/s41592-023-02144-y.
- Peidli S, Green TD, Shen C, Gross T, Min J, Taylor-King JP, et al. scPerturb single-cell perturbation data: RNA and protein h5ad files [Dataset]. Zenodo; 2022. Version 1.0. doi:10.5281/zenodo.7041849. Licence: CC BY 4.0.
- Stoeckius M, Hafemeister C, Stephenson W, Houck-Loomis B, Chattopadhyay PK, Swerdlow H, et al. Simultaneous epitope and transcriptome measurement in single cells. Nat Methods. 2017;14(9):865–868. doi:10.1038/nmeth.4380.
- Spearman C. Correlation calculated from faulty data. Br J Psychol. 1910;3(3):271–295. doi:10.1111/j.2044-8295.1910.tb00206.x.
- Brown W. Some experimental results in the correlation of mental abilities. Br J Psychol. 1910;3(3):296–322. doi:10.1111/j.2044-8295.1910.tb00207.x.
- Spearman C. The proof and measurement of association between two things. Am J Psychol. 1904;15(1):72–101. doi:10.2307/1412159.
- Lindeboom RGH, Supek F, Lehner B. The rules and impact of nonsense-mediated mRNA decay in human cancers. Nat Genet. 2016;48(10):1112–1118. doi:10.1038/ng.3664.
- Tuladhar R, Yeu Y, Piazza JT, Tan Z, Clemenceau JR, Wu X, et al. CRISPR-Cas9-based mutagenesis frequently provokes on-target mRNA misregulation. Nat Commun. 2019;10(1):4056. doi:10.1038/s41467-019-12028-5.
- Mulè MP, Martins AJ, Tsang JS. Normalizing and denoising protein expression data from droplet-based single cell profiling. Nat Commun. 2022;13(1):2099. doi:10.1038/s41467-022-29356-8.