What an M2 macrophage label conceals
Two-donor single-cell RNA data reveal differences between M2a and M2c stimulation conditions that disappear under a shared M2 label.
On this page
A decrease in M2 macrophages may sound favorable in cancer immunology: fewer immunosuppressive cells could allow T cells to act. But what were those cells actually doing?
The Immunity Perspective Embracing macrophage complexity for research and translation, published online on October 16, 2026, revisits frameworks that describe macrophages by fixed subsets, binary activation states or single markers. According to its abstract, macrophage identity emerges from developmental origin, tissue niche, epigenetic history, local environmental cues and disease-associated signals. The proposed alternative describes a macrophage state as a weighted combination of gene-program activities; for therapy, it calls for defining disease-associated states, identifying surface-accessible entry points into them and rewiring the underlying programs. This is a Perspective on research and translation, not an efficacy trial. I read only the public abstract, not the full text, so what I say about the Perspective is limited to the abstract (1).
The limitations of M1/M2 terminology are not new. The 2014 experimental guidelines already recommended specifying cell origin and stimulation conditions (2). In the same year, a review argued that the M1/M2 dichotomy needed revision (3), and a study of 299 human macrophage transcriptomes described a spectrum of activation states extending beyond the two poles (4). From the abstract, my reading is that the Perspective matters because it moves beyond adding categories to asking which functions an intervention should preserve or change. I have not checked this reading against the full text.
I reaggregated public human macrophage single-cell RNA data to compare two stimulation conditions that both fall under M2 and examine information lost when they are merged. I also ask how far a gene-panel score can be read as a proxy for function, by comparing it with the source study's functional measurements.
Different stimuli under the same M2 label
The input was GSE199378: blood monocytes from two healthy donors differentiated into macrophages and exposed to the stimuli below. The original study was published by Modak et al. in 2022; these measurements were not newly generated by the 2026 Perspective. The main question of Modak et al. was whether CD206-positive macrophages cross-present tumor antigen and contribute to antitumor immunity (5).
Table 1. Stimulation conditions and cell counts by donor.
| Original label used here | Stimulus | Donor 1 cells | Donor 2 cells |
|---|---|---|---|
| M1 | LPS + IFNγ | 3,884 | 4,537 |
| M2a | IL-4 + IL-13 | 1,407 | 4,756 |
| M2c | IL-10 | 3,631 | 3,014 |
There were 21,229 cells but only two independent donors. According to GEO, cells were differentiated with macrophage colony-stimulating factor, M-CSF, for six days and stimulated for 24 h. LPS denotes lipopolysaccharide, IFNγ interferon gamma, and IL interleukin. The Methods of the original paper likewise state that macrophages for single-cell RNA analysis were collected 24 h after the differentiation cytokines were added, whereas macrophages for functional experiments were differentiated with M-CSF for 5 days, stimulated for 48 h and collected on day 7 (5). Because the stimulation durations differ, the RNA and functional measurements should not be treated as simultaneous readouts.
I used the original quality-controlled, scran-normalized (6) log1p expression values. The original paper concatenated the six samples, normalized them together, and reports that the two replicates clustered together for each of the three conditions in a UMAP (5). I did not recluster or apply additional batch correction. Many cells do not substitute for many donors. Cells from the same individual are not statistically independent, and tests that treat cells as the unit inflate false positives (7, 8). I therefore report no cell-level p values and describe the data with two donors as the unit.
Keeping the two conditions separate
Before opening the expression matrix, I specified six small panels containing 26 genes: IFN-related genes, antigen-processing genes, costimulatory ligands, checkpoint ligands, type 2-related genes and uptake receptors.
These are panels I selected for comparison, not a reconstruction of the 2026 Perspective's program list. They neither identify new regulatory circuits nor assume that the panels act independently. The costimulatory-ligand, checkpoint-ligand and uptake-receptor panels overlap with receptor genes discussed by Modak et al. (CD86, ICOSLG, CD274, PDCD1LG2, MRC1, CD163 and others) (5). The selection preceded opening the matrix but not knowledge of the original report, so differences in these panels are a re-expression of the same data, not independent findings. The type 2-related panel was chosen as genes expected to be high under IL-4 and IL-13 stimulation; separating that condition is an anticipated result, not an independent mechanistic discovery or evidence of functional difference. The measured expression difference itself is not guaranteed by a definition.
Table 2. Prespecified comparison panels.
| Panel | Genes used |
|---|---|
| IFN-related | STAT1, IRF1, GBP1, CXCL9, CXCL10, IDO1 |
| Antigen processing | HLA-A, HLA-B, B2M, TAP1, TAP2, PSMB8 |
| Costimulatory ligands | CD80, CD86, ICOSLG |
| Checkpoint ligands | CD274, PDCD1LG2 |
| Type 2-related | CCL17, CCL18, CCL22, ALOX15, TGM2 |
| Uptake receptors | MRC1, CD163, MERTK, MSR1 |
I calculated mean log1p expression for each donor–stimulus combination, standardized each gene using the six sample means with equal weights, and averaged the resulting z scores within each panel. Equal weighting prevents samples with more cells from dominating the reference scale.
\[ S_{ds,P}=\frac{1}{|P|}\sum_{g\in P}\frac{\bar{x}_{ds,g}-\mu_g}{\sigma_g} \]
Here, \(d\) denotes donor and \(s\) stimulus. For each gene, \(\mu_g\) and \(\sigma_g\) are the mean and standard deviation of the six sample means; the standard-deviation denominator is 6. Zero represents this dataset's average, not absence of function. Because all samples define the scale, this is descriptive visualization rather than prediction for an unseen donor. The scale also depends on the six-sample composition, including M1. Large M1–M2 gene differences enlarge the standardization denominator and make M2a–M2c differences relatively small. “Close” therefore refers to this scaling and within-panel averaging, not functional equivalence or a distance invariant to removing M1.
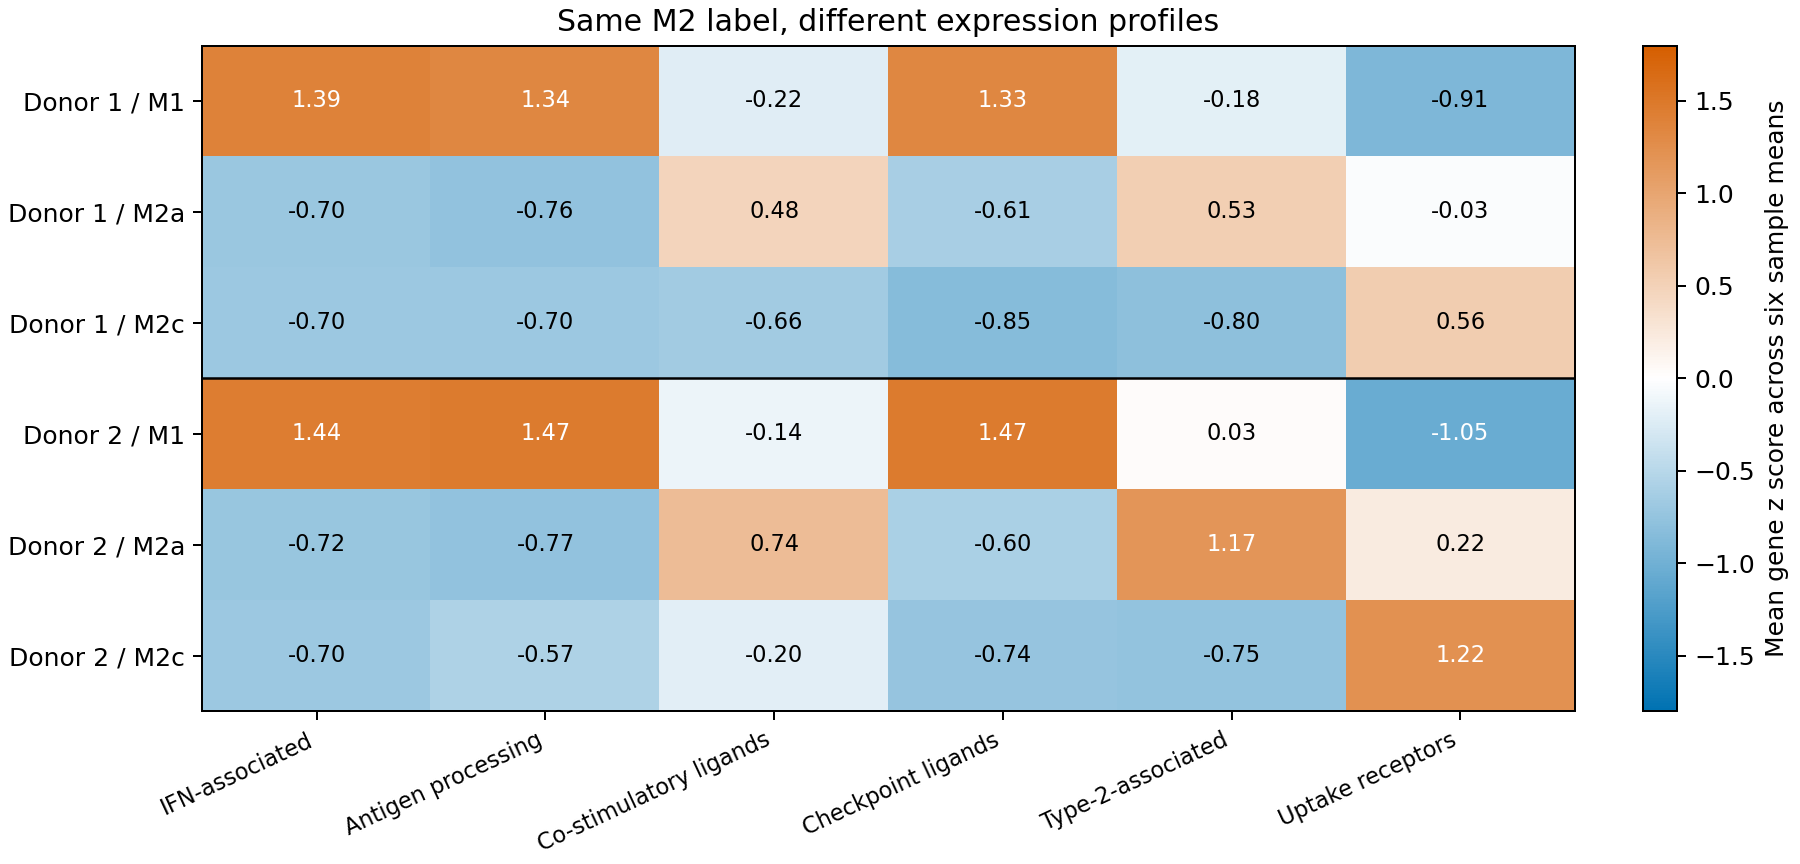
Figure 1. Mean panel z scores across two donors and three stimulation conditions, standardized with equal weights for six samples. Scores are not absolute functional activities.
For M2a minus M2c, costimulatory-ligand scores were higher by 1.14 in donor 1 and 0.95 in donor 2. Type 2-related scores were higher by 1.33 and 1.92, whereas uptake-receptor differences were −0.59 and −1.01. M2a was not uniformly more activated across panels.
Checkpoint-ligand scores were also higher in M2a, by 0.23 and 0.14. Higher costimulation-related RNA did not mean lower inhibition-related RNA. These patterns cannot determine the direction of an antitumor effect. Modak et al. report lower PD-L1 and PD-L2 expression in M2a than in M1 (5). Here, the checkpoint-ligand panel was 1.33 and 1.47 in M1 and −0.61 and −0.60 in M2a, in the same direction. Relative to M2c, M2a is slightly higher.
For the IFN-related, antigen-processing and checkpoint-ligand panels, the M2a–M2c difference (0.0 to 0.23 in absolute value) is far smaller than the M2a–M1 difference (about 1.9 to 2.2). On these three axes, the M2 grouping holds as a coarse approximation. Relatively larger M2a–M2c differences occur on the costimulation, type 2 and uptake-receptor axes; smaller differences remain on the others. What the M2 grouping conceals depends on which axis is examined.
Removing one gene at a time preserved the direction of the costimulation, checkpoint, type 2 and uptake-receptor differences in every case. IFN-related differences were smaller and reversed in 2 of 12 cases. There is little basis for emphasizing the sign of such small differences. The distributed tables also retain unstandardized gene means and detection fractions.
An unchanged M2 fraction can conceal a changing composition
Consider a hypothetical pool combining each donor's M2a and M2c samples. If the M2a fraction is \(p\), its mean panel score is
\[ S_{\mathrm{M2}}(p)=pS_{\mathrm{M2a}}+(1-p)S_{\mathrm{M2c}} \]
This is a static reweighting of two observed conditions, not an experiment changing cells with a drug or a model of temporal evolution.
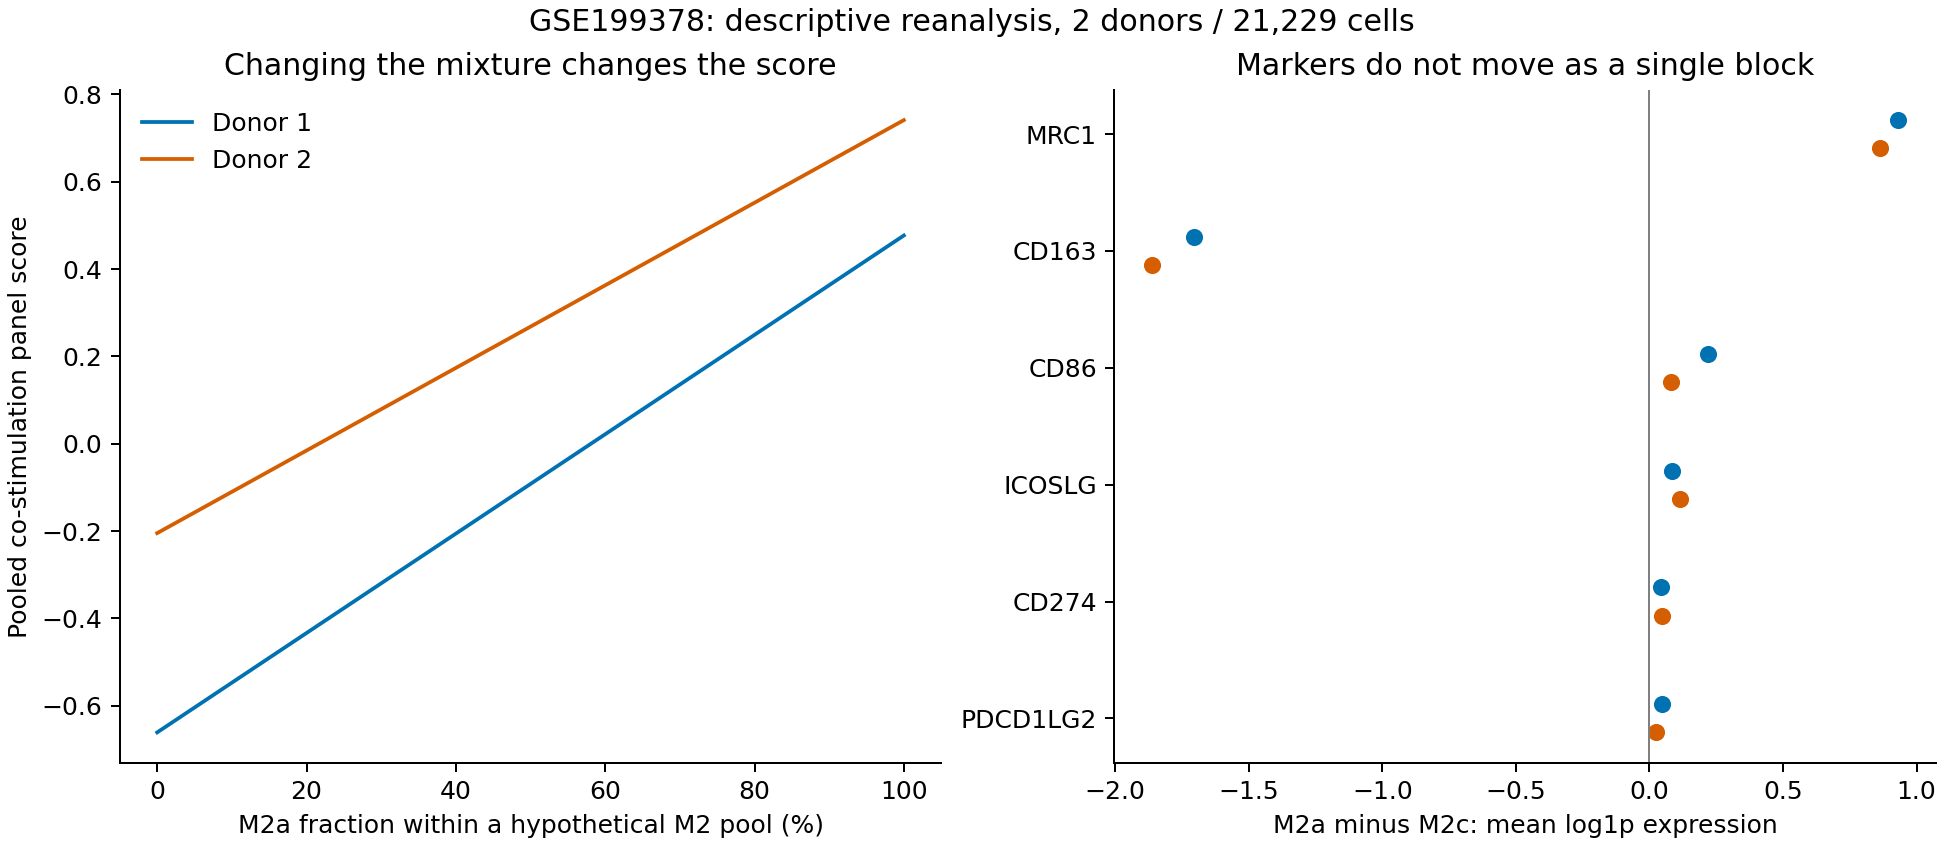
Figure 2. Left: static reweighting of observed M2a and M2c conditions. Right: donor-specific differences in mean gene expression. The figure estimates neither state transitions nor intervention effects.
All cells in this hypothetical pool are M2 at every \(p\). Nevertheless, composition alone moves the costimulatory-ligand score by 1.14 in donor 1 and 0.95 in donor 2. This follows from the equation: the range covered as \(p\) moves from 0 to 1 simply equals the difference between the two conditions. The data show the difference between the two conditions, not the range over which \(p\) varies in real tissue. A record stating no change in the M2 fraction would lose this difference.
MRC1 in the right-hand panel encodes CD206, whereas CD163 encodes a different receptor. Both appear in descriptions of M2, but their differences have opposite signs in these conditions. Even the combined uptake-receptor panel does not preserve every single-marker difference. Replacing a label with a panel is not a complete solution.
Before and after treatment, both composition and expression within a state may change. Separating them requires comparisons maintaining state definitions or experiments that track changes. Cross-sectional measurements under different stimuli here do not show that M2c cells became M2a cells.
Functional measurements beyond RNA
The original 2022 paper examined antigen cross-presentation as well as expression: presentation of internalized antigen to T cells through major histocompatibility complex class I. With soluble long TyrD peptide, M2a showed stronger cross-presentation than M1 or M2c. The fraction of cells carrying the TyrD/HLA-A2 complex was 13% ± 3.9% in M2a (n = 4–5 donors, mean ± SEM), 6.2% ± 1.4% in M1 and 2.6% ± 1.3% in M2c. IFNγ from TyrD-specific T58 cells in coculture was 467 ± 79.9 pg/mL with M2a, 109 ± 15.6 pg/mL with M1 and 110 ± 22.3 pg/mL with M2c (n = 3–4 donors). With antigen derived from UV-induced apoptotic cells of the melanoma line COLO829, T58 IFNγ in no subset differed from control, remaining at about 15 pg/mL or below, near the lower limit of quantification (n = 4 donors). These measurements appear in Figure 4 of the original paper (5).
This conditionality matters. Calling M2a antitumor would merely create another fixed label. Antigen form, presentation process and measured T-cell response must remain part of the description. The two RNA donors are not the donor count of the functional experiments. This analysis does not regress functional effect sizes on RNA differences.
The original paper also measured uptake. All three subsets took up fluorescently labeled long TyrD peptide efficiently, and M2a had lower integrated fluorescence intensity than M1 or M2c. Even so, cross-presentation was strongest in M2a. For apoptotic cells, M2a and M2c had higher integrated intensity than M1, yet no T-cell response to that antigen was detected (5). The RNA uptake-receptor panel was highest in M2c, then M2a, then M1 (the same order in both donors). That order matched neither uptake intensity (lowest in M2a) nor the order of cross-presentation (strongest in M2a). Uptake amount, presentation efficiency and T-cell response do not line up in one direction.
Surface markers may provide an entry point for intervention without identifying cells that all have the same function. These two RNA donors do not quantitatively separate changes in cell abundance, state and antigen-presentation function. M1/M2 labels alone do not determine which functions remain or disappear. The original paper's antitumor conclusion rests on associations between expression and survival in TCGA data and on comparisons between groups of 4–7 mice in tumor models. It is not a causal test of an intervention (5).
Discussion
What the M2 grouping conceals depended on the axis. On the IFN-related, antigen-processing and checkpoint-ligand panels, the M2a–M2c difference is far smaller than the difference from M1. On the costimulation, type 2 and uptake-receptor panels the difference is large and its sign is not constant. A single M2 label collapses these differences into a fraction. Yet part of the panel differences reflects genes responding to the stimulus, and does not imply functional difference. The original paper measures functions including cross-presentation and uptake, but those experiments cannot be treated as matched measurements of the RNA samples used here.
This changes how the Perspective's framework is read. Its abstract describes macrophage states as weighted combinations of program activities, and the present data fit that description naturally, because the closeness of the two conditions varies by axis within the same M2 label. At the same time, the choice of programs itself shapes the description. The six panels here were drawn partly from genes discussed in the original paper and partly from genes expected to respond to the stimuli, so M2a and M2c can look close or far apart depending on the choice. If program-based descriptions are used to evaluate an intervention, the definition of the programs and the evidence linking them to functional measurements must be presented together.
This also bears on how related claims are read. A report that M2 macrophages decreased cannot be read as an antitumor change without knowing how M2 was defined, in which culture condition or tissue. A change in fraction can include both a change in composition and a change in expression within a state. The present cross-sectional data cannot separate the two.
The main obstacle to estimating a score–function relationship is not small sample size alone: RNA and function are not available as matched observations from the same donors and times. Comparing condition-level mean rankings does not validate a relationship predicting one donor's cross-presentation from that donor's score.
Limitations
This analysis describes cultured cells from two healthy donors under three stimulation conditions. It includes neither unstimulated M0 cells, tissue-resident cells nor dose or time series. It estimates no population-wide donor effect, treatment benefit, toxicity or transition rate. I report neither cell-level p values nor population confidence intervals. Each donor–stimulus combination is a separate sample, so the effect of the stimulus cannot be separated from differences in sample handling.
The layer named counts in the public h5ad file was identical to X and did not contain integer unique molecular identifier counts. I therefore used it as documented normalized log1p expression, rather than assuming that its name indicated raw counts or fitting a count-based differential-expression model.
Conclusion
Merging M2a and M2c into one M2 collapses differences on three axes: costimulatory ligands, type 2-related genes and uptake receptors. For costimulatory ligands, composition alone moves the score by about 1 (1.14 in donor 1 and 0.95 in donor 2). On the IFN-related, antigen-processing and checkpoint-ligand axes the two conditions are close, and the grouping is a coarse approximation on this dataset's scale. What is lost depends on the axis. Whether these differences mean differences in function cannot be established from these data. The original cross-presentation assay showed a difference with soluble antigen but not with cell-derived antigen, which gives no basis for using RNA scores as a proxy for function. With two donors, this remains a description.
Data and code availability
The analysis code, input excerpt for 26 genes, donor-level summaries, sensitivity analyses and reproduction instructions are provided, including provenance, processing scope and the original file's SHA-256. Figure 4 and Methods of the original paper and existing summary CSVs were rechecked on October 29, 2026. Panel names aid interpretation; the scores are not validated measurements of function.
References
- Ginhoux F, Mulder K, Arcila-Barrera S, Amit I. Embracing macrophage complexity for research and translation. Immunity. Published online 2026 Oct 16. doi:10.1016/j.immuni.2026.09.015. Perspective; public abstract only, full text not read.
- Murray PJ, Allen JE, Biswas SK, Fisher EA, Gilroy DW, Goerdt S, et al. Macrophage activation and polarization: nomenclature and experimental guidelines. Immunity. 2014;41(1):14–20.
- Martinez FO, Gordon S. The M1 and M2 paradigm of macrophage activation: time for reassessment. F1000Prime Rep. 2014;6:13. doi:10.12703/P6-13.
- Xue J, Schmidt SV, Sander J, Draffehn A, Krebs W, Quester I, et al. Transcriptome-based network analysis reveals a spectrum model of human macrophage activation. Immunity. 2014;40(2):274–288. doi:10.1016/j.immuni.2014.01.006.
- Modak M, Mattes AK, Reiss D, Skronska-Wasek W, Langlois R, Sabarth N, et al. CD206+ tumor-associated macrophages cross-present tumor antigen and drive antitumor immunity. JCI Insight. 2022;7(11):e155022. Data: GSE199378.
- Lun ATL, Bach K, Marioni JC. Pooling across cells to normalize single-cell RNA sequencing data with many zero counts. Genome Biol. 2016;17:75. doi:10.1186/s13059-016-0947-7.
- Zimmerman KD, Espeland MA, Langefeld CD. A practical solution to pseudoreplication bias in single-cell studies. Nat Commun. 2021;12(1):738. doi:10.1038/s41467-021-21038-1.
- Squair JW, Gautier M, Kathe C, Anderson MA, James ND, Hutson TH, et al. Confronting false discoveries in single-cell differential expression. Nat Commun. 2021;12(1):5692. doi:10.1038/s41467-021-25960-2.