What should batch correction preserve? A design diagnostic with CytoVI
A semi-synthetic experiment on public measurements from two healthy bone-marrow donors contrasts crossed and confounded artificial batches. Fixed CytoVI runs separate coarse cell-label readability from within-type reference contrasts; this is not a disease-preservation validation.
On this page
- Background and objective
- Cell-type preservation and within-type differences
- Crossed versus confounded donor–batch designs
- Fully confounded causes cannot be separated from these observations
- Comparing decoded contrasts with the retained reference
- Coarse labels and within-type contrasts need separate diagnostics
- Discussion
- Data and code availability
- References
Background and objective
Combining cells measured separately requires more than removing batch differences. Removing disease or donor differences can undermine the comparison, while apparent preservation of those differences can coexist with residual technical shifts.
CytoVI is a generative model for antibody-based single-cell measurements, including flow cytometry, mass cytometry and CITE-seq. Its September 30, 2026 paper demonstrates integration, missing-protein imputation and differential-expression analysis (1). Here I examine whether a measurement design permits checking what should be removed and what should remain.
I added known artificial batch shifts to public bone-marrow measurements also used in the original work and fitted CytoVI. This semi-synthetic experiment uses two healthy donors. It does not demonstrate preservation of patient disease differences.
Cell-type preservation and within-type differences
CytoVI infers latent representations and reconstructs measurements conditional on covariates such as batch. Corrected representations and protein expression decoded at a common batch are estimates, distinct from original measurements (2).
Retaining T-cell, B-cell and monocyte distinctions matters, but does not establish preservation of patient-associated differences within a T-cell type. Coarse labels and within-type contrasts require separate checks. Where labels come from manual gating on measured markers, label agreement is not an independent clinical ground truth either. An integration metric must be related to the biological comparison it is intended to support.
Crossed versus confounded donor–batch designs
I used the public Levine 32-dimensional bone-marrow CyTOF dataset (3). Its FCS file contains 265,627 cells, 32 proteins and two healthy donors. Fourteen manual gating labels cover 104,184 cells; 161,443 are unassigned. I independently checked total and donor-specific counts from the FCS.
A fixed random seed selected up to 150 cells per donor–type combination, yielding 4,109 cells: 2,100 from donor 1 and 2,009 from donor 2. This sampling aids type-specific diagnostics and does not represent original bone-marrow cell proportions. Unassigned cells were excluded from fitting.
Marker values in the distributed FCS are already arcsinh-transformed and were not transformed again. I standardized the 32 proteins within the selected set and added +0.8 standardized units to eight markers in artificial batch 1: CD4, CD8, CD19, CD20, CD34, CD38, CD14 and HLA-DR.
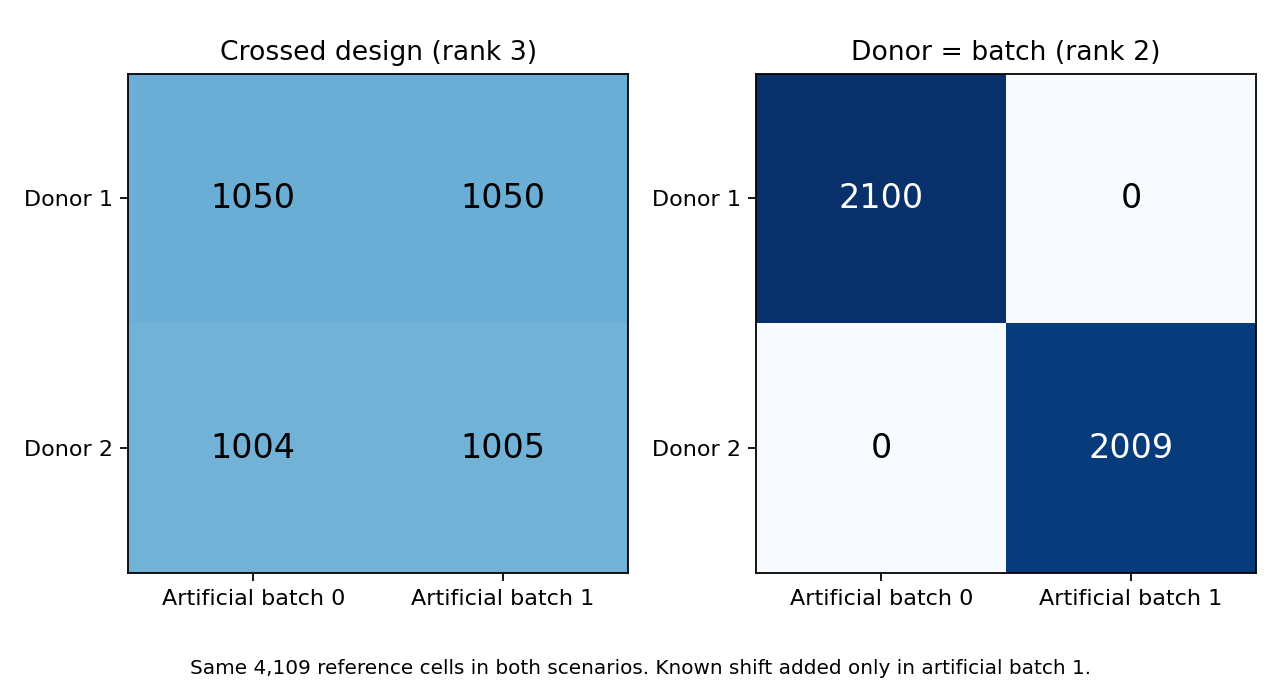
Figure 1. Both designs use the same reference cells. Left: each donor–type group is split approximately equally across two artificial batches. Right: donor 1 is assigned to batch 0 and donor 2 to batch 1. Counts denote cells, not independent donors or experimental replicates.
Pre-injection measurements were retained as the reference. Their donor differences can themselves include technical effects and sampling error. The quantity to preserve here is the difference present before the added shift, not error-free biological truth or a disease effect.
Fully confounded causes cannot be separated from these observations
For a simplified protein measurement:
\[ x=\mu+\delta_D D+\delta_B B+\varepsilon \]
Here \(D\) indicates donor 2 and \(B\) batch 1. Measuring both donors in both batches makes these columns distinct. Measuring only donor 2 in batch 1 instead gives \(D=B\): observations identify the sum \(\delta_D+\delta_B\), not its separate components. The intercept–donor–batch design matrix had rank 3 in the crossed design and rank 2 under full confounding.
A deeper model adds no measurement information. Assumptions or external references can supply a decomposition, but these observations alone cannot validate it. An oracle subtracting the known artificial shift succeeds because it has injection information unavailable in ordinary analysis.
Comparing decoded contrasts with the retained reference
I fitted scvi-tools 1.4.2 CytoVI with two seeds per design, using 32 proteins, a 10-dimensional latent space, 64 hidden nodes, normal likelihood and latent distribution, no mixture prior and 120 training epochs. Neither donor nor cell-type labels were supplied. Decoding used artificial batch 0 and averaged 20 latent samples (4).
This does not reproduce the original paper's settings or benchmark. It is one small fixed configuration, without optimization or a demonstration of sufficient convergence. Diagnostics use the same 4,109 cells, including 3,699 assigned to training and 410 to validation.
Within each of 14 equally weighted cell types, I calculated the donor-2 minus donor-1 difference across 32 proteins. Let \(d\) denote the reference contrast and \(\hat d\) the corrected contrast:
\[ \mathrm{RMSE}=\sqrt{\operatorname{mean}\bigl((\hat d-d)^2\bigr)},\qquad c=\frac{\sum d\hat d}{\sum d^2} \]
RMSE measures discrepancy from the reference. The coefficient \(c\) projects onto the reference direction: 1 matches its magnitude and 0 has no component in that direction. A value of 1 can still coexist with orthogonal error, so RMSE remains necessary. Negative values and values above 1 are possible; this is not a 0–100% conservation rate.
Table 1. Within-type donor contrasts compared with the retained reference.
| Design | Correction | Contrast RMSE | Reference-direction coefficient |
|---|---|---|---|
| Crossed | Simple batch-mean alignment | 0.00003 | 1.000 |
| Crossed | CytoVI seed 0 / 1 | 0.250 / 0.245 | 0.540 / 0.551 |
| Fully confounded | Simple batch-mean alignment | 0.349 | 0.386 |
| Fully confounded | CytoVI seed 0 / 1 | 0.406 / 0.413 | 0.122 / 0.108 |
| Both designs | Oracle subtracting known shift | 0 | 1 |
A constant additive shift favors simple mean alignment by construction. These results do not establish its superiority for complex real batches. CytoVI decoding also denoises; not every discrepancy from the noisy reference can be attributed to removal of biological information.
In the crossed design, uncorrected donor-contrast RMSE was already approximately 0.00061, with projection near 1. Almost equal shifts in both donors cancel when their difference is taken. Yet cell-level RMSE against the reference remained approximately 0.283. Neither contrast preservation nor batch removal alone suffices to judge correction.
Coarse labels and within-type contrasts need separate diagnostics
After examining the main analysis, I added a 15-nearest-neighbor classifier for manual cell labels, assessed by five-fold macro recall. CytoVI uses its 10-dimensional latent representation; other methods use 32 protein dimensions. This is not a fair ranking of model performance across matched representations. Classifier labels are evaluated within folds, but CytoVI has already used expression from evaluation cells during its training workflow. This is a transductive diagnostic within the same dataset, not evaluation on external donors.
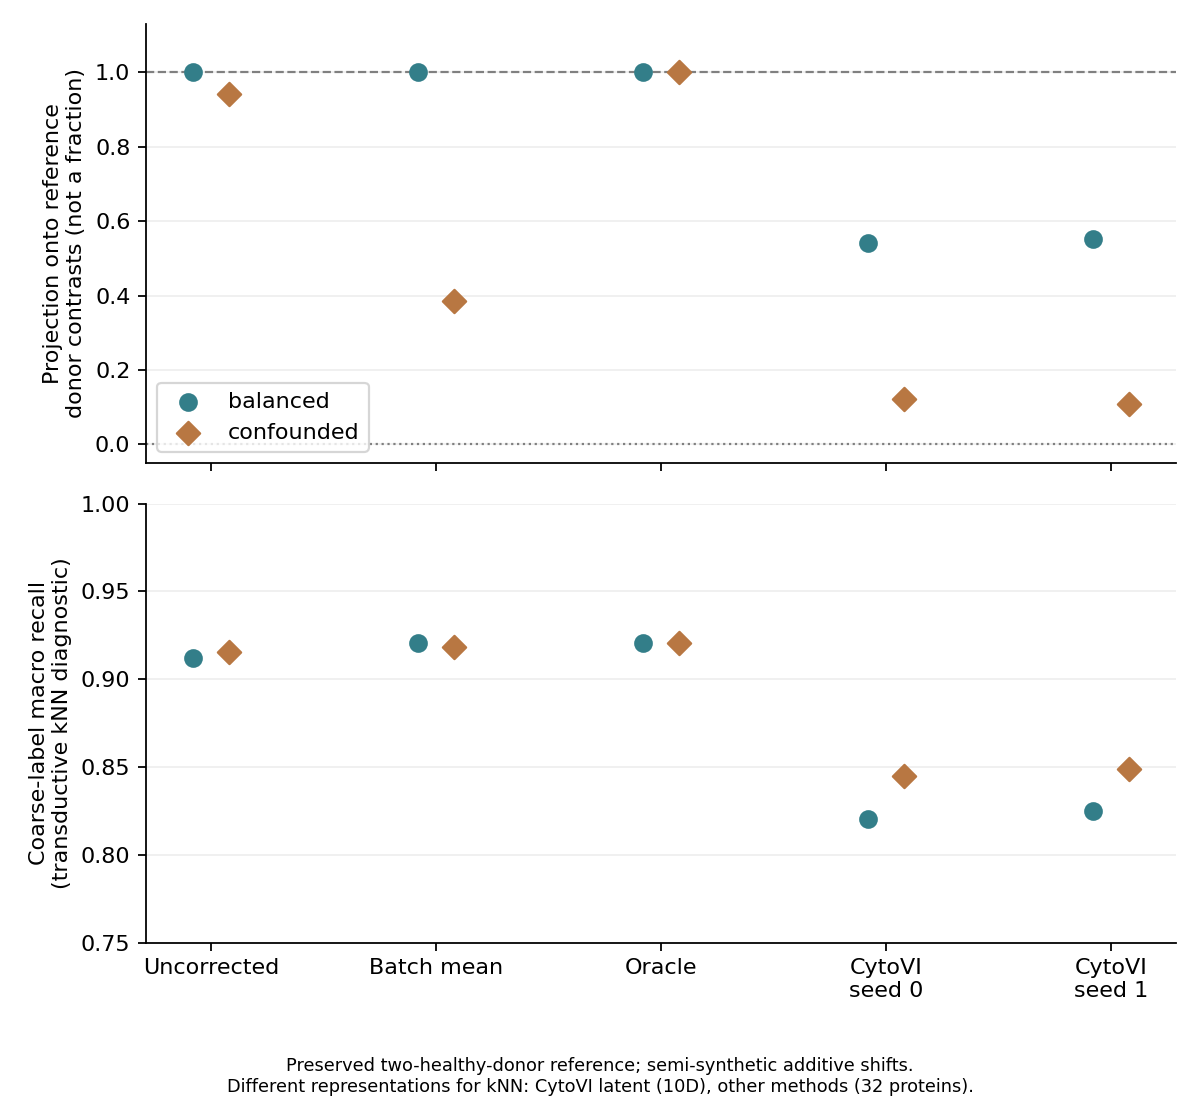
Figure 2. Top: reference-direction projection. Bottom: macro recall of coarse cell labels. Seeds repeat optimization, not independent biology. The oracle knows the injected shift.
CytoVI macro recall was 0.820–0.825 in the crossed design and 0.845–0.849 under full confounding. Within-type donor projections instead changed from approximately 0.54–0.55 to 0.11–0.12. Improved coarse-label readability therefore does not establish preservation of the intended reference contrast.
This does not prove that removing these two donors' differences is a biological error. How much observed donor variation should count as noise is a separate question. The retained semi-synthetic reference makes this check possible; real fully confounded data cannot support the same judgment without additional measurements or justified external references.
Discussion
When disease samples occur only in one batch and controls only in another, observations alone cannot separate group and batch effects. Mixing groups in an integrated plot does not demonstrate preservation of disease differences.
Coarse cell-type preservation does not establish preservation of within-type group differences or rare-population proportions. More cells and more independent patients or donors supply different information.
Access to the original paper's clinical CLL flow data requires an application. I neither obtained those data nor reproduced clinical results. This experiment concerns artificial shifts added to public healthy bone-marrow measurements (original Data availability).
Data and code availability
Download code, reference inputs, saved outputs and original figures. numpy and scikit-learn suffice to rerun saved-output diagnostics and ten tests. Instructions also cover extraction from the approximately 44 MB public FCS and refitting with scvi-tools 1.4.2. Trained weights, original-paper figures and the original FCS are not included.
input-provenance.json records source revisions, SHA-256 hashes and input/output hashes; REPRODUCE.md records settings and scope. Main settings were fixed before fitting, while coarse-label diagnostics were added after results were examined. This is an exploratory audit after reviewing public materials, not a preregistered clinical study. Saved-output calculations are reproducible, but refitting in another environment need not yield identical floating-point values.
The experiment does not validate CytoVI's general superiority, all batch mechanisms, unannotated cells, true disease differences, diagnostic performance or generalization to independent patients. A changed reference contrast and removal of a clinically important difference remain distinct conclusions.
References
- Ingelfinger F, Levy N, Ergen C, Bakulin A, Becker A, Boyeau P, et al. CytoVI: deep generative modeling of antibody-based single cell data. Nature Methods. 2026;23(10):2054–2065. doi:10.1038/s41592-026-03224-5.
- scvi-tools developers. CytoVI: model description. User guide. Accessed 2026 Oct 14; analysis used scvi-tools 1.4.2.
- Weber LM. Clustering benchmark data: 32-dimensional data set from Levine et al. (2015) [Dataset and preparation code]. Revision c6737786dcff3a50145993efed451a2af55e0a00. GitHub. Accessed 2026 Oct 14.
- scvi-tools developers. scvi.external.CYTOVI: API reference. Documentation. Accessed 2026 Oct 14; analysis used scvi-tools 1.4.2.