How much of a cell’s signaling history can we reconstruct?
IRIS response classification and reconstructed signaling histories: a threshold analysis of 130,000 predictions and a review of experimental validation.
On this page
- RNA records responses rather than inputs themselves
- Histories reconstructed by ordering different cells
- Carryover from earlier stimulation
- Reclassifying the released predictions
- Testing predictions through changes in culture conditions
- Different signaling histories can produce similar RNA
- Data and code availability
- References
Measuring a cell once might reveal what happened to it before the measurement. That sounds as though RNA contains an experimental notebook. Such a record would be useful for studying responses that persist after a drug is removed or the sequence of signals that directs differentiation. Classifying a present response, however, is different from reconstructing past inputs.
The IRIS paper published in Nature Methods in September 2026 provides a concrete case. An MIT overview followed in October. Its particularly useful feature is the experimental work that changes differentiation conditions on the basis of inferred responses (1, 2).
RNA records responses rather than inputs themselves
IRIS learns expression patterns associated with pathway stimulation or inhibition from single-cell RNA sequencing. Its conditional variational autoencoder framework uses scANVI to integrate batches in a latent space and classify responses to individual pathways.
The experimental design covers six pathways, but the main embryonic-atlas analysis uses five: TGF-β, FGF, BMP, RA and WNT. Hedgehog stimulation involved too few cells in the initial mouse embryonic stem-cell data for adequate evaluation. Binary classification of five pathways gives 32 combinations. The six-pathway design and the 32 combinations therefore describe different parts of the study.
Training data include mouse and human stem cells exposed to combinations of signals at different stages toward endoderm and mesoderm. The task is harder than selecting markers for one cell type. Evaluation includes holding out entire screens, training on endoderm and evaluating on mesoderm, and transfer across species. These are more demanding tests than a random split of a large cell collection (1; original Fig. 2 and Methods).
Nevertheless, the reference labels originate from experimentally assigned stimulation conditions. Adding a compound, activating an intracellular pathway at the moment of measurement, and retaining its transcriptional response are different events. If RNA persists after stimulation ends, it can contain information about past stimulation. The same persistence can produce a false positive when the question concerns current stimulation.
Histories reconstructed by ordering different cells
The developmental analysis does not follow the same cell over several days. Different cells collected from embryos are ordered along inferred differentiation trajectories using cell annotations and expression. Predicted signaling responses are then overlaid on those trajectories to examine which combinations occur earlier or later. The Methods explicitly describe selecting diffusion components consistent with known cell types and marker order.
The reconstructed sequences in cardiac and endodermal lineages agree with established differentiation protocols. This supports a population-level reconstruction along a developmental trajectory. It does not independently verify every historical event: part of the interpretation depends on the validity of the inferred trajectory (1; original Fig. 3 and “Inferring signaling histories”).
“WNT response appears earlier along this trajectory” differs from “this cell received WNT yesterday.” The latter also requires information that distinguishes elapsed time from response decay.
Carryover from earlier stimulation
The authors examine carryover in human mesoderm data containing successive stimulation steps. They compare subsequent false-positive rates between cells stimulated through the same pathway in the preceding step and cells without that preceding stimulation.
The effects differ by pathway. Prior stimulation increases false positives for BMP, WNT and TGF-β, decreases them for RA, and has no significant effect for FGF. Most pathway false-positive rates are below 0.3, but even the direction varies (original Supplementary Fig. 6).
This demonstrates an influence of preceding stimulation on current classification. It does not establish that the timing, strength and number of previous exposures can be distinguished. Persistent RNA after drug washout could reflect residual drug, delayed decay of downstream responses, or an altered cell state. Those explanations require different experiments. IRIS does not thereby become an estimator of patients’ dosing histories or drug concentrations.
Reclassifying the released predictions
I extracted the 130,000 rows with complete predictions for all five pathways from Figure 3 Source Data and recalculated positive fractions at thresholds of 0.25, 0.50 and 0.75. This is an aggregation of released predictions, without retraining IRIS or reprocessing raw RNA sequencing.
The inspected worksheet contains 139,331 data rows. In its final 9,331 rows, cell identifiers and predictions are blank while the developmental-stage column still contains values. Because the alignment of columns could not be established adequately, the calculation uses only the five predictions within each complete row and does not join developmental stage or cell type. It is not a reconstruction of all 139,331 cells described in the paper.
A positive fraction is the proportion of rows at or above a threshold. The alternative thresholds are sensitivity scenarios, not experimentally validated replacements.
Table 1. Positive fractions and classification changes under alternative thresholds.
| Pathway | Threshold 0.25 | Threshold 0.50 | Threshold 0.75 | Classification changes between 0.25 and 0.75 |
|---|---|---|---|---|
| TGF-β | 37.9% | 36.5% | 35.0% | 2.9% |
| FGF | 61.8% | 52.4% | 43.5% | 18.3% |
| BMP | 46.0% | 42.3% | 38.6% | 7.4% |
| RA | 41.1% | 37.5% | 34.1% | 7.0% |
| WNT | 63.5% | 56.4% | 48.8% | 14.7% |
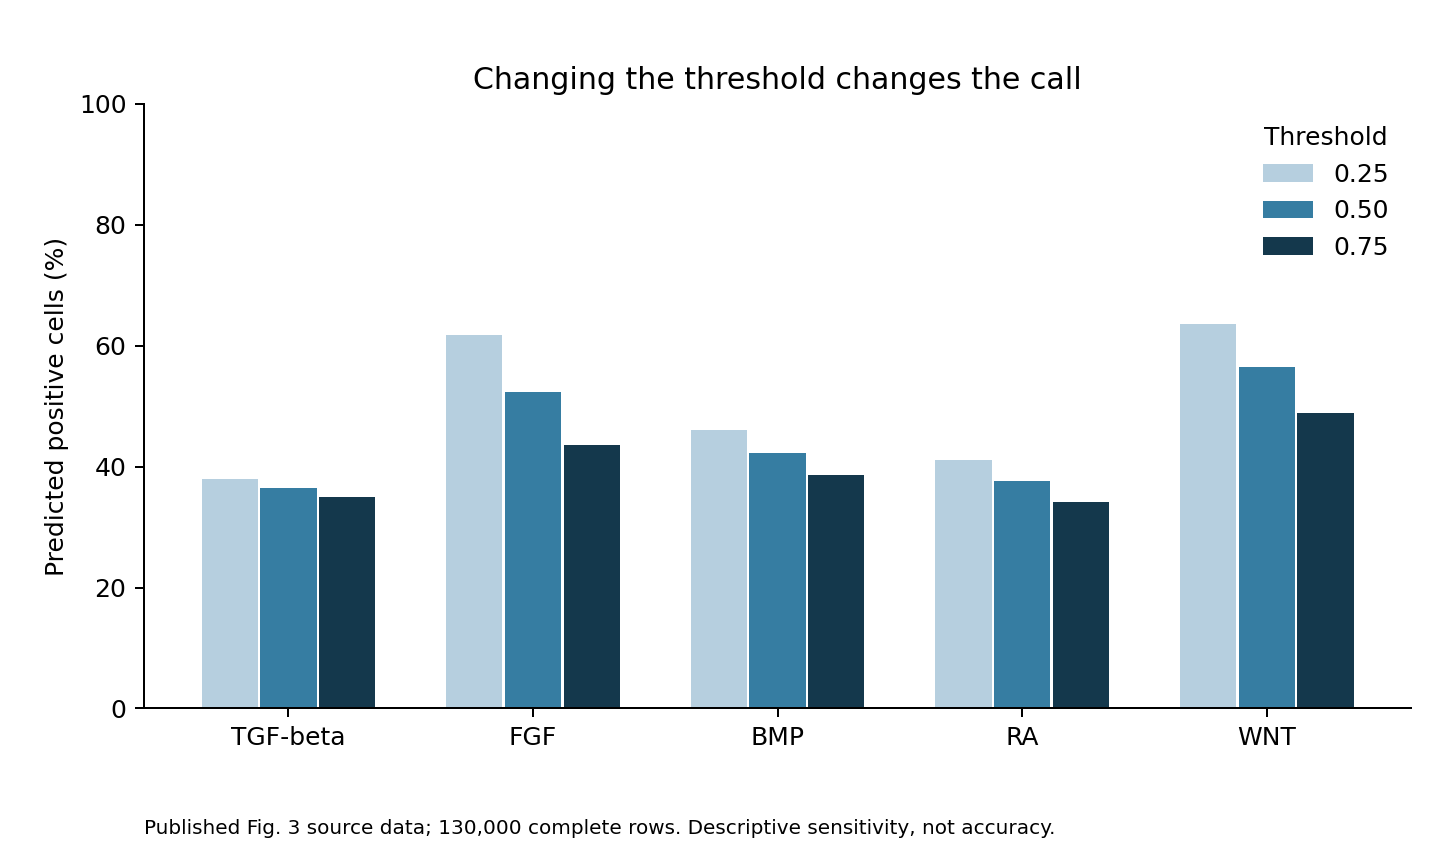
Figure 1. Threshold sensitivity in the same 130,000 complete prediction rows. Changes describe classification sensitivity, not errors against reference labels.
At least one pathway changes classification in 54,000 rows, or 41.5%. This counts each row once even if several pathways change; it is not a sum of pathway-specific percentages.
FGF and WNT particularly benefit from retaining continuous predictions alongside binary labels. The result does not mean that 41.5% of predictions are wrong. No stimulation ground truth is available for this comparison. It is neither an error rate nor a confidence interval, but a descriptive sensitivity analysis dependent on atlas composition. Embryos were not used as independent units for statistical inference.
An output of 0.8 also does not mean twice the stimulation concentration associated with 0.4. The paper reports spatial probability gradients consistent with known morphogen gradients, but that is not concentration calibration. Classification confidence, stimulus intensity and response duration cannot automatically be represented by the same number.
Testing predictions through changes in culture conditions
Original Fig. 4 connects inferred responses to intervention. Applying IRIS to mouse foregut data predicts frequent WNT and BMP responses in respiratory mesenchyme. In cultured embryonic foregut, WNT activation expands the expression domains of Tbx4 and Foxf1, whereas WNT inhibition eliminates Tbx4 expression.
The authors also change the protocol for producing respiratory mesenchyme from human stem cells. The previous seven-day protocol stimulates WNT during its final 24 hours; the modified protocol begins on day 4 and stimulates for longer.
Concentration changes as well. The Methods specify CHIR at 2 µM for the final day in the previous protocol and 3 µM for three days in the modified protocol. Other pathway conditions are maintained, but the comparison does not isolate the effect of starting time from duration and concentration.
More WNT is not uniformly better. High activity reduces FOXF1 expression, whereas intermediate activity better preserves major markers. Improvement across multiple hES and hiPS cell lines supports reproducibility across lines. Evaluation, however, focuses on differentiation markers rather than full functional equivalence to respiratory mesenchyme in vivo. The authors also state that WNT adjustment alone is insufficient.
The study does not virtually test every possible history and establish an optimal protocol. It uses an atlas to narrow candidates and then tests interventions in culture. That sequence is itself a substantial strength.
Different signaling histories can produce similar RNA
Similar RNA does not establish that a brief strong signal and a prolonged weak signal were the same input. Without response-decay information, recent weak stimulation may also be difficult to distinguish from stronger stimulation further in the past. Measuring more genes need not remove this nonuniqueness.
IRIS combines inference of stimulation-associated responses with a separately inferred ordering of cells. Its protocol improvements are additionally tested by changing stimulation experimentally. Present-response classification, historical reconstruction and intervention effects each need to be judged against their own evidence.
Data and code availability
The aggregation code and input counts contain counts for threshold combinations, source information and SHA-256 hashes, aggregation and plotting scripts, and validation tests. They reproduce summaries from public predictions rather than providing trained weights or copies of the original figures. REPRODUCE.md explains extraction from the original Excel file. The source worksheet is Fig3ab_atlas in Source Data Fig. 3. The figure in this article is an independent aggregation of those released predictions.
References
1. Hutchins NT, Meziane M, Lu C, Mitalipova M, Fischer DS, Li P. Reconstructing signaling histories of single cells via perturbation screens and transfer learning. Nature Methods. 2026;23:1973–1983. doi:10.1038/s41592-026-03213-8.
2. Massachusetts Institute of Technology. AI model decodes the language cells use to communicate. MIT News. 2026 October 15. Article.