What can public RNA-seq say about "reverting cancer cells to normal"?
A Japanese note re-reading a reported reversion of colorectal cancer cells after triple knockdown of three genes chosen by a Boolean network model, using the public RNA-seq data and a pre-fixed analysis plan. It checks whether the targets were expressed and knocked down, how specific the enterocyte program was, and how consistent the lines were. It does not evaluate the paper's other experiments or any therapy.
On this page
Background and objective
Literature checked on October 12, 2026. I distinguish the papers' reports, my interpretation and my reanalysis of public RNA-seq counts. I do not adjudicate the mouse experiments, western blots or predictive accuracy of the network model.
Social-media descriptions of KAIST colorectal-cancer research have referred to a molecular switch returning cancer cells to normal. The papers instead use terms such as normal-like. Two related studies are Gong and colleagues and Shin and colleagues (1, 2). This article reanalyzes the former's public cell-line counts; the latter is discussed separately below. Gong and colleagues inferred a Boolean network from single-cell data and reported that simultaneous MYB, HDAC2 and FOXA2 knockdown induces normal-like enterocyte differentiation.
The question is how far the public RNA measurements support that transition, rather than whether a model-guided experiment forms an appealing narrative.
Boolean models identify candidate control targets
A Boolean network represents each gene as on or off. For state \(x(t)\in\{0,1\}^N\), a logical rule updates each node from its regulators:
\[ x_i(t+1)=f_i\bigl(x_{\mathrm{pa}(i)}(t)\bigr). \]
In this finite deterministic setting, states eventually enter recurrent trajectories, or attractors, which are interpreted as stable cell states. This model was inferred from normal intestinal differentiation; it does not explicitly contain a cancer-cell attractor. Control targets are nodes fixed to 0 or 1 to favor enterocyte-like attractors. Candidates were selected using network control and cosine similarity to an enterocyte state. Complete node fixing under synchronous updates differs from partial shRNA knockdown.
The paper reports 48 unperturbed attractors, approximately 12.5% enterocyte-like, versus four attractors all classified as enterocyte-like after joint control of MYB, HDAC2 and FOXA2. This percentage counts attractors; it is not a differentiation probability or basin-size estimate. These are properties of an inferred binary model. Whether experimental cells undergo the corresponding change requires separate evidence.
What the paper reports experimentally
The authors introduced shRNAs targeting the three genes into HCT116, CACO2 and HT29 colorectal-cancer lines. They reported greater proliferation reduction than with single knockdowns in vitro, using three replicates and t tests. Stable knockdown cells implanted subcutaneously in nude mice produced lower tumor volumes and weights, n=5. This is not treatment of an already established tumor.
They also reported RNA-seq positioning near normal tissue in a comparison with TCGA tumors and adjacent normal tissue, and increased KRT19, KRT20 and VDR proteins. Cell-line RNA-seq is available as GEO GSE327208, with two controls and two knockdown replicates per line (3). It became public in April 2026; a May correction updated data information (4). The paper discloses that the senior author is an inventor on related patents and a director and shareholder of a related company.
Public RNA-seq reanalysis
The questions are whether each target was expressed and decreased, whether an intestinal program increased specifically, whether proliferation programs decreased, and whether changes agreed across lines. Intended use is research interpretation of the public evidence, not therapeutic efficacy or drug-development decisions. Both mistaking growth-related secondary changes for differentiation and overlooking an intestinal signal are possible errors.
I fixed a written plan and its hash before calculation, after viewing raw counts for nine genes, as disclosed in the plan. Counts were converted to counts per million, CPM. Gene-wise log2 ratios compare two-replicate mean CPM values after adding 0.5. A set score is the mean log2 ratio across its genes. Expression-stratified random sets of equal size were sampled 10,000 times to obtain a descriptive z score. Cell-type sets from Tabula Sapiens and PanglaoDB via Enrichr and MSigDB Hallmark were used (5); specificity was assessed by the mature-enterocyte set's rank among 469 Tabula Sapiens sets.
I did not test individual genes with only two replicates per condition. Target engagement here concerns mRNA only; shRNA effects can also involve translation, so protein effects cannot be determined. The original Figure 6A was not independently verified. Unexpressed is an operational label meaning mean control CPM below 2.
Target mRNA changes
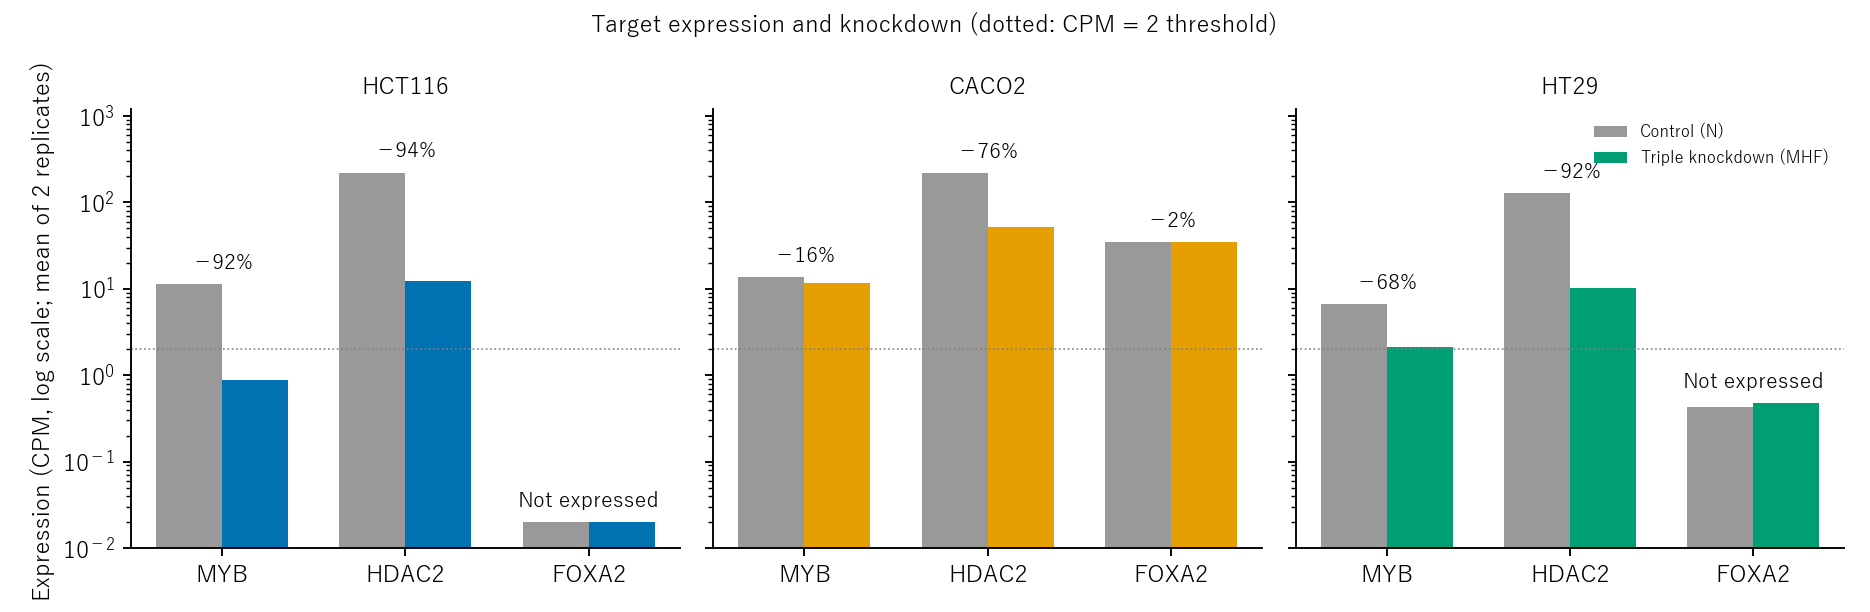
Figure 1. Target mRNA expression and reduction.
Table 1. Target mRNA changes and expression status.
| Cell line | MYB | HDAC2 | FOXA2 |
|---|---|---|---|
| HCT116 | −92% | −94% | Below expression cutoff, CPM 0.02 |
| CACO2 | −16% | −76% | −2%, expressed |
| HT29 | −68%, replicate values −46%/−92% | −92% | Below expression cutoff, CPM 0.43 |
FOXA2 mRNA was scarce in HCT116 and HT29. The RNA measurements therefore cannot establish its contribution to the intervention in those lines. Reduced MYB and HDAC2 were observed, but this does not equate the experiment to a two-target intervention at the protein or broader functional level. In CACO2, FOXA2 barely decreased and MYB decreased only 16%. No line showed strong mRNA reduction of all three expressed targets.
Enterocyte signals differ in strength and specificity
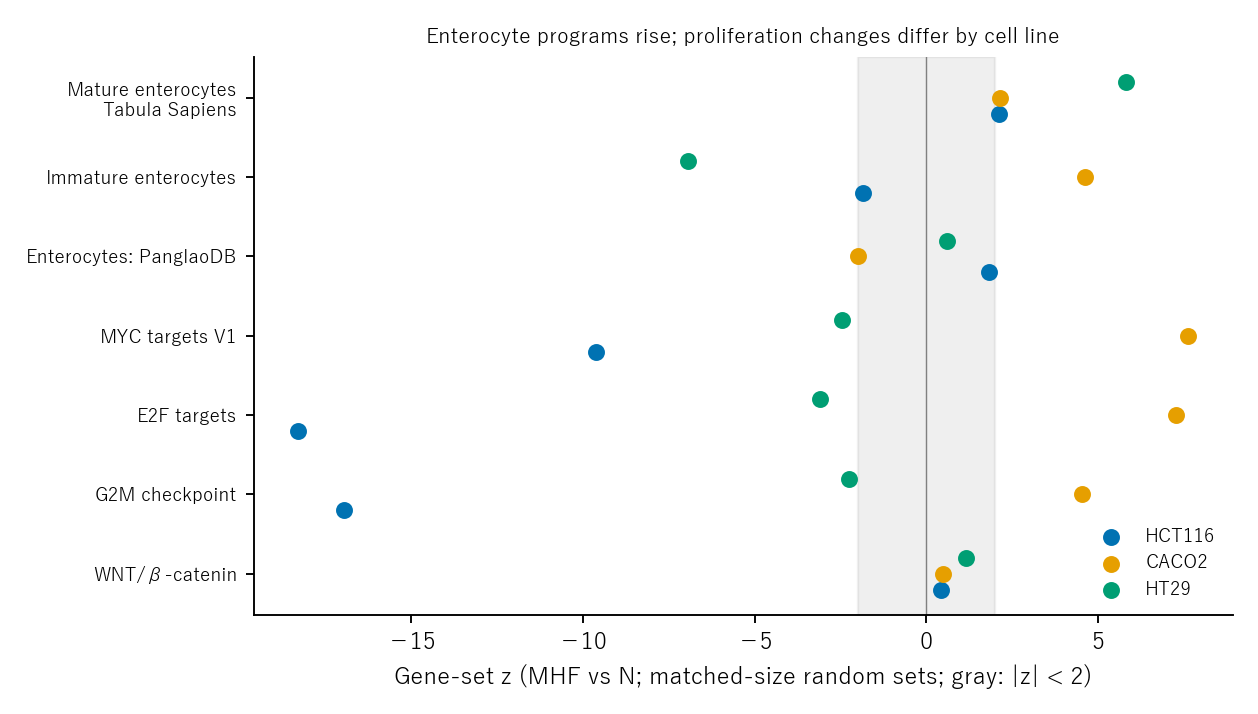
Figure 2. Gene-set scores across cell lines.
Mature-enterocyte sets increased in all three lines, with z approximately 2.2, 2.1 and 5.8 for HCT116, CACO2 and HT29. The planned rule, z>2 and p<0.05 in all three, was formally met. HCT116 and CACO2 p values of 0.035–0.036 were close to the threshold. The random-gene null does not preserve gene coexpression and can overstate significance. CACO2 replicate-specific scores also differed in sign, +0.15 and −0.06.
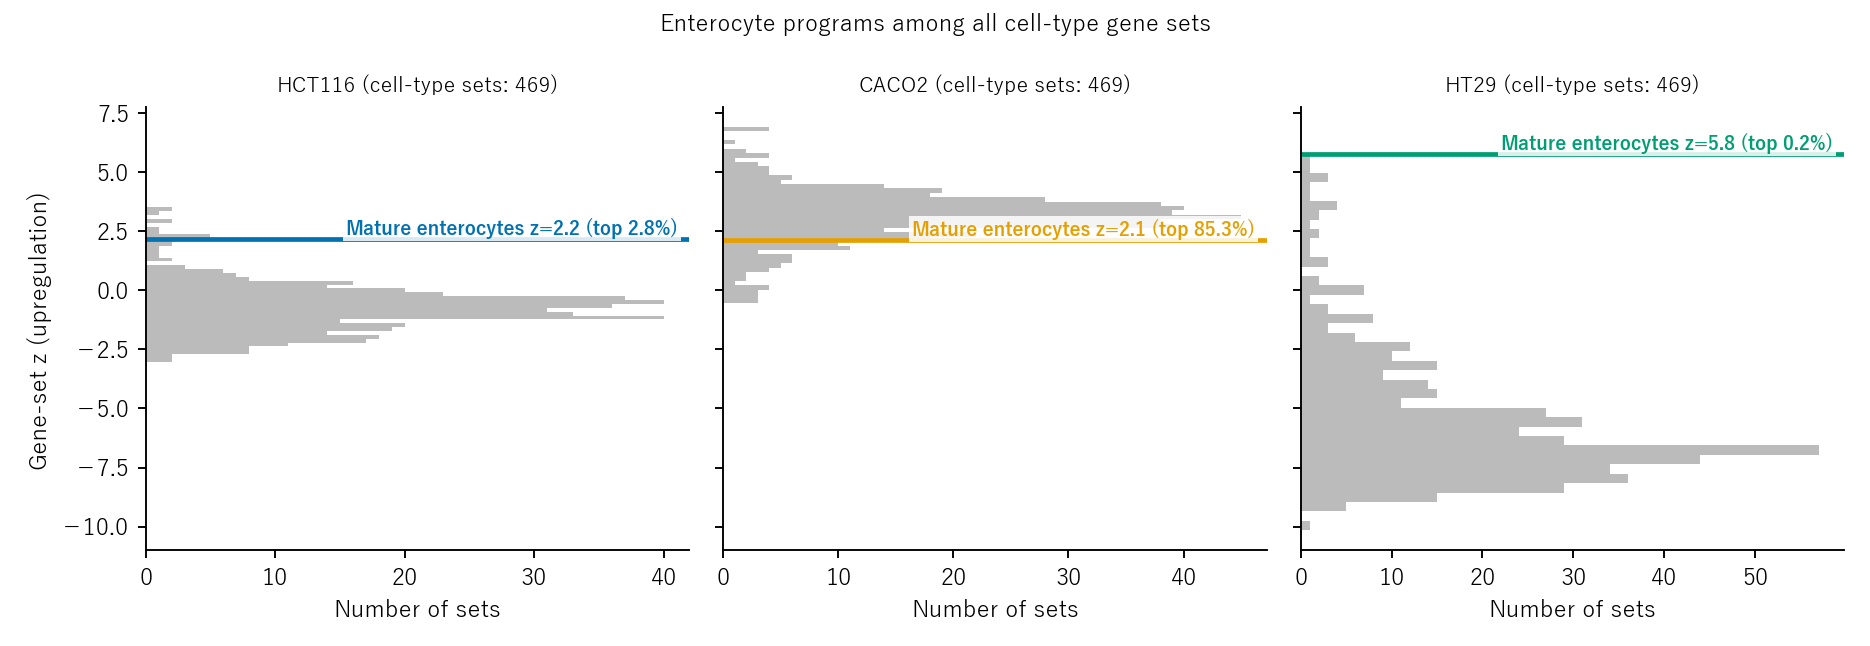
Figure 3. Mature-enterocyte rank among all 469 cell-type sets.
The mature-enterocyte set ranked first in HT29, top 0.2%, thirteenth in HCT116, top 2.8%, and 400th in CACO2, top 85.3%. HCT116 and CACO2 had similar z values, 2.16 and 2.15; their different ranks reflect different distributions of other set scores. HCT116's distribution was narrower, whereas CACO2 had many scores around +2 to +4. Strong relative specificity was clearest in HT29. CACO2's highest sets included tracheal mucus-secreting cells and hepatocytes.
Proliferation programs do not agree across lines
MYC-target, E2F-target and G2M-checkpoint z scores decreased in HCT116, −9.6, −18.3 and −17.0, and HT29, −2.4, −3.1 and −2.3, but increased in CACO2, +7.6, +7.3 and +4.5. The CACO2 counts therefore do not show a concurrent reduction in these proliferation programs alongside the intestinal signal.
HT29's decreases were largely associated with the second knockdown replicate, MHF_2, which also showed stronger MYB reduction, −92% versus −46%. This single-sample exploratory observation is not causal. Matching control and knockdown replicate numbers is not a confirmed biological pairing, so replicate-specific ratios cannot be interpreted as paired experiments.
Cross-line agreement
Spearman correlations of gene-wise log2 changes were 0.054 for HCT116–CACO2, 0.276 for HCT116–HT29 and 0.011 for CACO2–HT29. This does not test the paper's claim that treated lines become close in a normal-cell/embryonic-stem-cell signature plane. I used a different gene-wise-change comparison and leave the original projection claim unverified.
Summary of RNA evidence
Table 2. Original claims and scope of this reanalysis.
| Claim | Public RNA-seq assessment |
|---|---|
| Three targets were knocked down simultaneously | FOXA2 mRNA was below the expression cutoff in HCT116 and HT29; MYB and FOXA2 barely decreased in CACO2. No line showed strong decreases in all three; protein effects unverified |
| Enterocyte programs increased | Increased in all three, near threshold in some; relative specificity clearest in HT29 |
| Proliferation decreased with differentiation | Proliferation programs decreased in two lines and increased in one |
| All lines converged to a similar normal-like state | Unverified; low correlations of gene-wise changes use a different metric from the original claim |
The counts support partial enterocyte-like expression signals across the three lines. They do not alone establish restoration to normal cells after joint suppression of all three targets.
Discussion
A central issue is correspondence between model context and experiment. The model was inferred from normal intestinal single-cell data, where FOXA2 was selected as a factor blocking enterocyte differentiation. Two experimental cancer lines expressed little FOXA2 mRNA.
In the source GSE125970, FOXA2 was detected, UMI>0, in 23% of colonic stem cells and 14% of transit-amplifying cells, compared with approximately 60% for MYB and 76–84% for HDAC2. In colonic enterocytes it was 4%. Rectal stem and transit-amplifying cells showed 48% and 57%. The model combines colon and rectum, making regional differences relevant without establishing a causal explanation.
Sparse FOXA2 mRNA does not establish equivalence between a three-node fixed-state model and the shRNA experiment. The contrast with two-node control remains unverified here. The authors compared double knockdowns such as MYB+HDAC2 with triple knockdown in normal NCM-460 cells and reported agreement with predicted changes; I did not extract those figure values. The three cancer lines were examined with the triple intervention.
As in my earlier hidden-mediator article, observed-gene network edges need not be direct molecular interactions. Moving an attractor in a binary model and changing a real cell state require an explicit link, including evidence that the intended state variables were manipulated.
What was checked in the USP7 paper
KAIST's February 2025 molecular-switch announcement appears to correspond to Shin and colleagues' REVERT study, inferred from its title. The circulating social-media phrasing does not reliably identify which paper was intended. I read the USP7 paper but did not reanalyze its data.
The authors selected USP7 using shared MYC/YY1 targets, DepMap CRISPR dependency and increases in normal-colon signatures from LINCS L1000. They then exposed patient-derived colorectal-cancer organoids to the USP7 inhibitor P22077, 5–20 µM for ten days. Reported findings included smaller organoids, reduced MYC/MAPK and stem-related programs, and increased genes associated with normal colonic epithelium and negative regulation of proliferation.
The authors interpret these as support for a more normal state. From the examined text, I could not establish a drug-treated normal-organoid control, replicate counts or the location of bulk RNA-seq data. Single-cell data are identified as GSE283167, and code is public. Calling inhibitor treatment knockdown is also an intervention-label mismatch. The paper declares no conflicts. Its bulk-response claims were not independently tested here.
Limitations
There are three lines and two replicates per condition. Individual-gene tests were not performed, and replicate variability cannot be estimated precisely. Target assessment is restricted to mRNA.
Independent code with 20,000 randomizations reproduced 12 set scores, three lines times four sets, within 0.2, without changing the decision rule. Examples were HCT116 enterocyte scores 2.10 and 2.12, CACO2 2.16 and 2.14, and HT29 5.77 and 5.81.
The public resolution of the original Figure 6A did not permit quantitative western-blot assessment. Supplementary access required CAPTCHA verification and was not bypassed. Values in Figure 3C and Table S4 for two-node perturbations were likewise not verified.
This dataset contains no normal-colon reference, and I did not reproduce the original TCGA comparison. Bulk RNA cannot separate differentiation from changes secondary to growth arrest. Cell-type gene sets are approximations and the random-set null ignores coexpression. Mouse experiments, protein effects and network predictive accuracy remain outside this reanalysis; the USP7 discussion is restricted to the text checked.
Although the planned rule was met, near-threshold scores, weak specificity in one line and replicate disagreement lead me to interpret the evidence cautiously. That interpretation adds judgment beyond the original rule. I have no conflicts with the authors or related companies.
Data and code availability
The analysis ZIP contains the plan, code, results and figure code. GEO counts, Enrichr sets and MSigDB Hallmark inputs are not redistributed; download scripts and retrieved SHA-256 hashes are included. Run python fetch_data.py && python analysis.py && python figures.py with numpy, scipy and matplotlib, approximately three minutes with fixed seeds.
foxa2_source_check.py downloads two GEO files, approximately 36 MB, to check the model-source FOXA2 observations. Gene-set resources may change; reruns report hash differences when downloaded versions differ.
References
- Gong JR, Lee CK, Kim HM, Kim J, Jeon J, Park S, et al. Control of Cellular Differentiation Trajectories for Cancer Reversion. Advanced Science. 2025;12(3):2402132. doi:10.1002/advs.202402132.
- Shin D, Gong JR, Jeong SD, Cho Y, Kim HP, Kim TY, et al. Attractor Landscape Analysis Reveals a Reversion Switch in the Transition of Colorectal Tumorigenesis. Advanced Science. 2025;12(8):2412503. doi:10.1002/advs.202412503.
- National Center for Biotechnology Information. GSE327208 [RNA-seq dataset]. Gene Expression Omnibus. Accession.
- Correction to “Control of Cellular Differentiation Trajectories for Cancer Reversion”. Advanced Science. 2026;13(36):e75708. doi:10.1002/advs.75708.
- Enrichr, Tabula Sapiens, PanglaoDB and MSigDB. Cell-type and Hallmark gene-set resources [Gene sets]. Versions and retrieved-file SHA-256 hashes recorded in the analysis distribution. Enrichr libraries; MSigDB Hallmark.