Unobserved mediators do not disappear from a network
A Japanese essay on the difference between edges inferred from observed variables and the molecular interactions behind them. It links the mathematics of eliminating a mediator, a reproducible synthetic example, chemical-mediated microbial interactions, single-cell gene regulatory networks and mechanism assessment in drug discovery. It makes no claim about any real organism or drug.
On this page
- Direct effects, mediation and confounding
- Eliminating a mediator leaves memory
- A good fit need not identify the mediator's rate
- Evidence from microbial models
- RNA-only regulatory networks have the same problem
- Can time series alone reveal a hidden mediator?
- Mediator assumptions change pharmacological extrapolation
- A correct total effect does not identify the intervention target
- Reproduce the example and its limits
- References
Literature checked on October 8, 2026.
Two bacterial populations move together. One rises, then the other follows. Infer a network from their time series and an arrow might appear from bacterium A to bacterium B.
What if a metabolite released by A lies between them? Leaving a metabolite column out of the observations does not remove the molecular process.
An unobserved mediator does not disappear from the causal network. Its column disappears from the data table, but its effects remain. Some parameters describing those effects can no longer be determined from the columns that remain.
Eric Kernfeld's discussion of unobserved layers in biological network inference points out what RNA-only measurements miss: proteins, modifications, complexes, hormones and chromatin states. Here I connect that problem to time-series mathematics, chemical-mediated microbial interactions, single-cell regulatory networks and drug mechanism evaluation. The distinction between prediction and mechanistic inference is developed in an earlier article. This continuation asks what an unmeasured variable prevents us from determining.
Direct effects, mediation and confounding
First, the terminology.
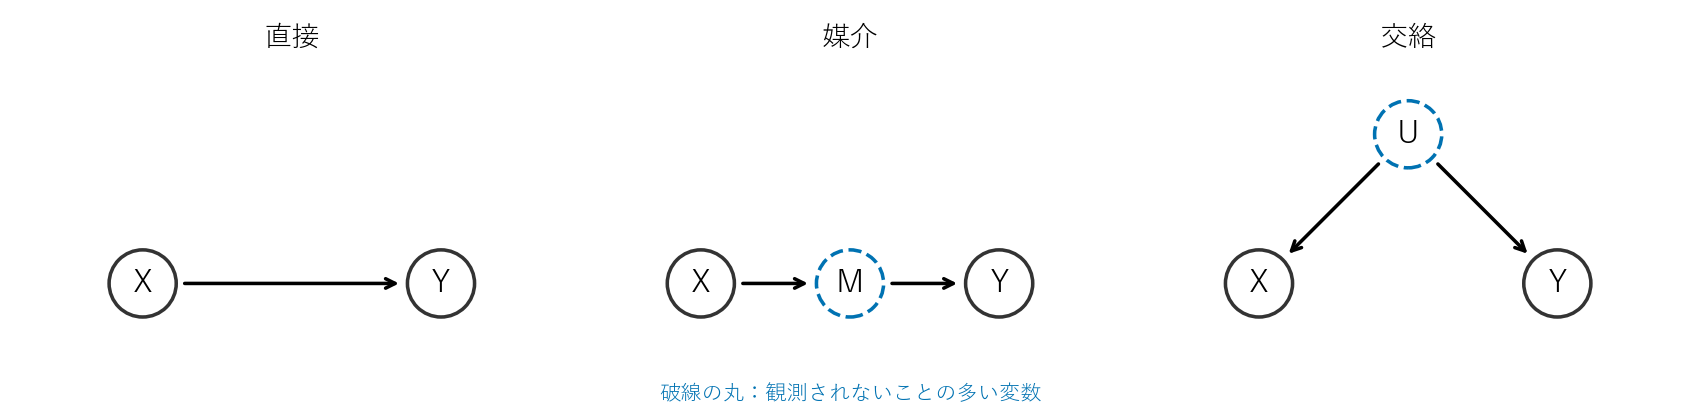
- Total effect: the change in Y caused by intervening on X, through all pathways.
- Direct effect: the change in Y from changing X while holding M fixed.
- Indirect or mediated effect: the part operating through X changing M and M changing Y.
In the mediation diagram, an effect reaches Y through M. This is causal: intervening on X changes Y. The total effect exists even without measuring M, but it does not establish a direct action from X to Y.
In the confounding diagram, \(U\) is a common cause of X and Y. X and Y can be associated without adjustment for U, yet intervening on X need not change Y.
The observed relationship between two variables does not generally distinguish these structures (Runge et al. 2019). Confusing mediation with confounded association can lead to choosing the wrong experimental intervention.
“Direct” here means direct relative to a specified variable set and temporal resolution. An edge means something different in a model representing a whole cell by one state variable than in one representing its intracellular protein reactions.
Eliminating a mediator leaves memory
Consider a simple dynamic model. Let \(x(t)\) be an upstream population or input, \(m(t)\) an unobserved metabolite and \(y(t)\) a downstream response:
\[ \frac{dm}{dt}=a\,x(t)-\lambda\, m(t), \qquad \frac{dy}{dt}=b\,m(t)-\gamma\, y(t). \]
There is no direct x-to-y term. All influence passes through m. Solving for m nevertheless gives
\[ m(t)=e^{-\lambda t}m(0)+a\int_0^t e^{-\lambda(t-s)}x(s)\,ds \]
and hence
\[ \frac{dy}{dt}=-\gamma\, y(t)+b\,e^{-\lambda t}m(0) +ab\int_0^t e^{-\lambda(t-s)}x(s)\,ds \]
Removing m from the equation leaves a term through which past x affects y. This follows algebraically from the linear model.
If metabolite removal is much faster than variation in x, and the initial transient has passed (\(t \gg 1/\lambda\)), a quasi-steady-state approximation gives
\[ m(t)\approx\frac{a}{\lambda}\,x(t),\qquad \frac{dy}{dt}\approx\frac{ab}{\lambda}\,x(t)-\gamma\, y(t) \]
The coarse model appears to contain a direct x → y action. Yet \(ab/\lambda\) is an effective coefficient combining production, action and removal, rather than a direct molecular interaction constant. Approximation validity depends on the ratio between mediator and input time scales. Sampling intervals determine whether deviations are visible. Coarse observations can make even a slow mediator appear direct.
Pharmacology contains related forms. The reduced equation \(dy/dt = (ab/\lambda)\,x - \gamma\,y\) is a linear indirect-response model in which input stimulates response production and delay arises from response turnover, \(k_{out}\) or \(\gamma\) here (Dayneka et al. 1993). It approaches an instantaneous direct-effect model only if \(\gamma\) is also sufficiently fast. The mediator equation has the same delay form as an effect compartment between drug concentration and the site of action (Sheiner et al. 1979). In the classical effect compartment, however, inflow and outflow share \(k_{e0}\): changing it changes delay without changing the steady level. Here inflow \(a\) and removal \(\lambda\) are independent, so changing \(\lambda\) also changes the steady level. Delay-induced loops in input–response relationships are known as hysteresis.
A good fit need not identify the mediator's rate
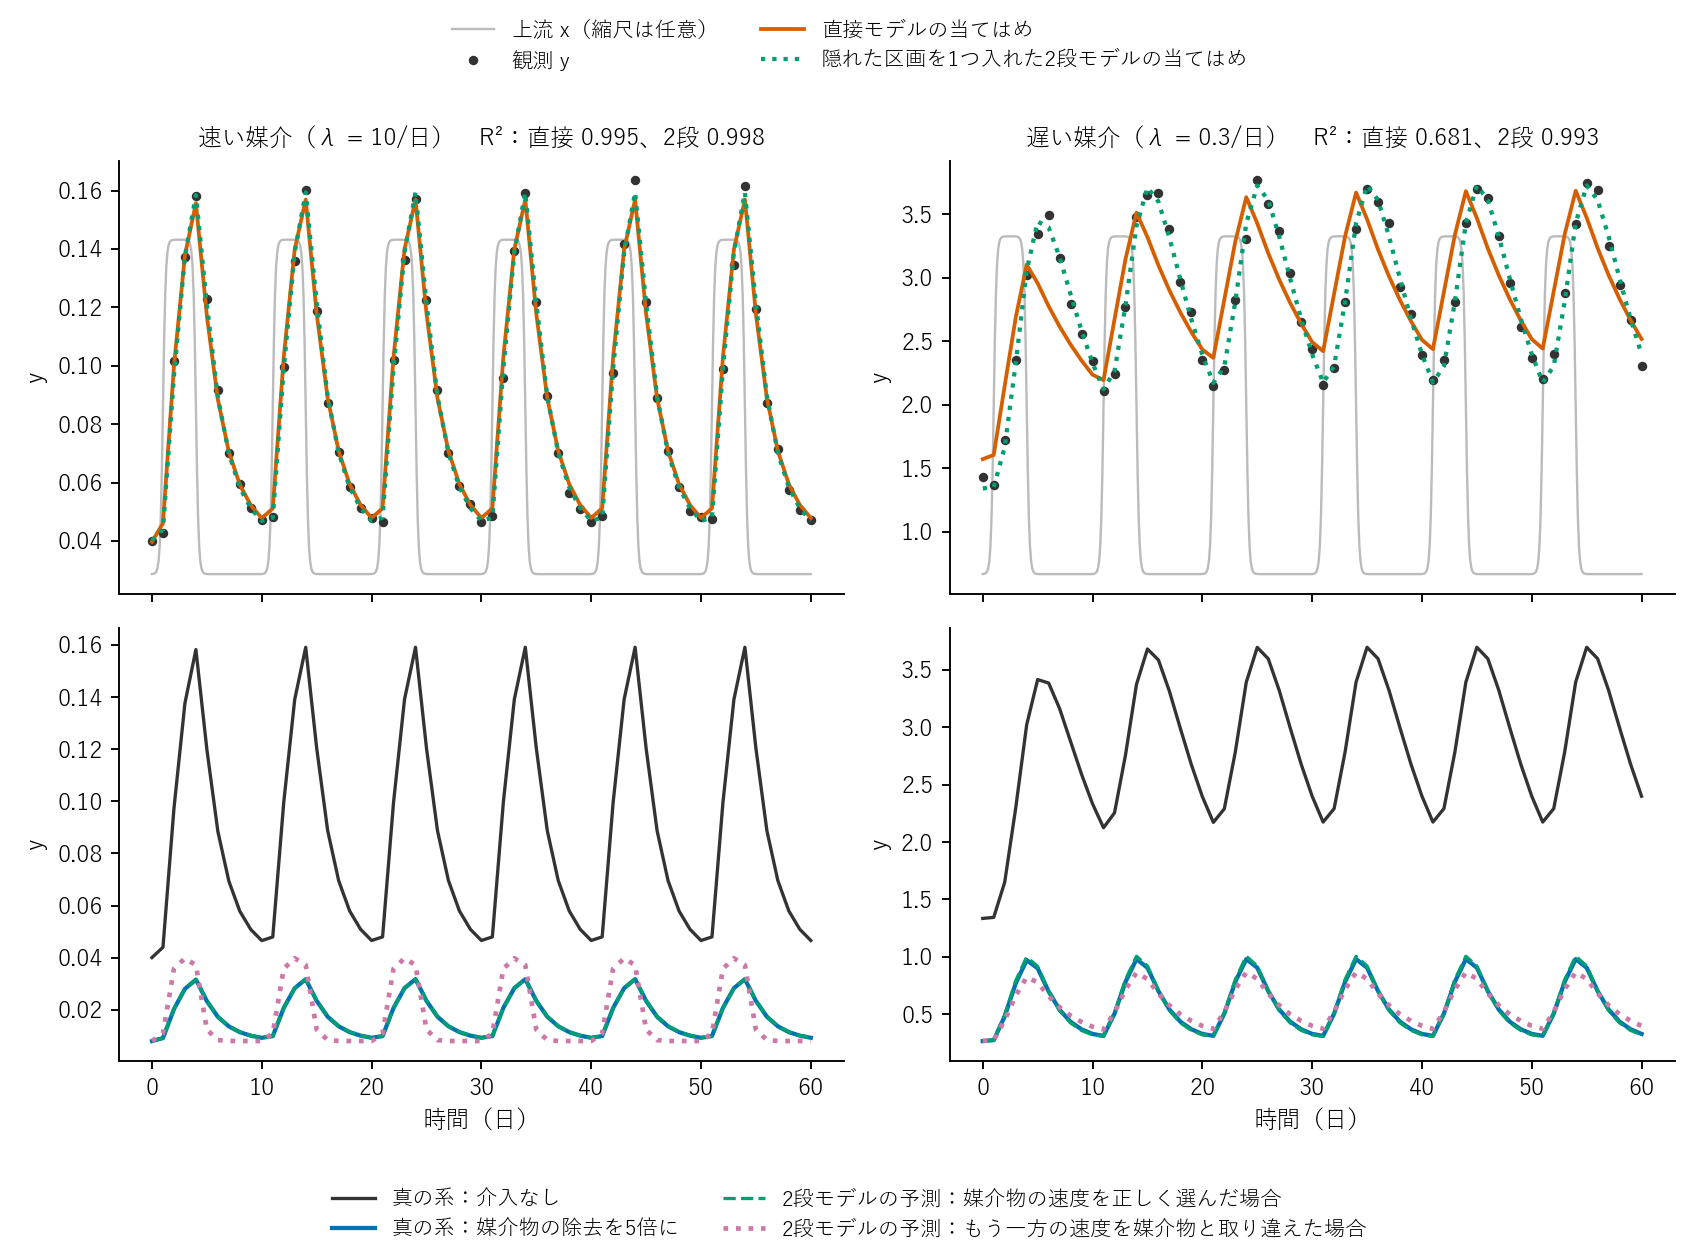
I generated synthetic data from this model and fitted two models as an analyst who cannot observe the mediator. These are not experimental data. I set \(a=b=1\), \(\gamma=0.5\)/day and a known input x elevated for three days every ten days. Response y was observed daily with 2% lognormal measurement error. Mediator removal was either fast (\(\lambda=10\)/day) or slow (0.3/day). Removal combines degradation, uptake by other bacteria and outflow. An intervention making mediator removal five times faster could represent adding a degrading enzyme. Increasing culture dilution would also dilute y and is therefore a different intervention.
- Direct model: \(dy/dt = k\,x(t) - g\,y\), omitting a mediator.
- Two-stage model: \(dm/dt = c\,x - r_1m,\ dy/dt = m - r_2y\), with one unobserved compartment and the correct structural form.
| Metric | Fast mediator (λ = 10/day) | Slow mediator (λ = 0.3/day) |
|---|---|---|
| Direct-model fit, R² | 0.995 | 0.681 |
| Direct-model steady gain k/g; true ab/(λγ) in parentheses | 0.202 (0.200) | 6.85 (6.67) |
| Direct-model y removal g; true 0.5/day | 0.47 | 0.12 |
| Two-stage fit, R² | 0.998 | 0.993 |
| Two estimated rates; true | {0.50, 8.7} | {0.29, 0.54} |
| Mean under fivefold mediator removal: true / correct rate assignment / swapped assignment | 0.20 / 0.20 / 0.20 | 0.20 / 0.20 / 0.20 |
| Peak-to-trough amplitude under the same intervention: true / correct / swapped | 0.20 / 0.20 / 0.28 | 0.44 / 0.45 / 0.32 |
Intervention results are ratios against no intervention, using the mean and peak-to-trough amplitude in the last 20 days. The correct assignment can be selected only because the simulation supplies the truth; it is not available from the observed data.
Four points stand out.
1. The direct model recovers overall gain. Its steady gain k/g is near \(ab/(\lambda\gamma)\) for both mediator rates. Doubling upstream x produces the correct 2.00-fold prediction in both cases. This follows from linearity and externally controlled, unconfounded x; any linear model gives that scaling. It is not evidence that the model is correct.
2. A slow mediator's memory appears as an incorrect parameter of another variable. The direct model estimates y removal at 0.12/day, roughly one-quarter of its true value. Time spent in the mediator is absorbed into y's apparent turnover as a one-stage model tries to reproduce the input delay. The poor R² of about 0.68 reveals a fit problem without locating its cause.
3. Even the correct structure cannot identify which rate belongs to the mediator. The two-stage model fits the slow-mediator case at R² 0.993 and estimates rates {0.29, 0.54}/day against true {0.3, 0.5}. But the y time series is symmetric in the rates. Swapping them produces the same fitted curve, differing by at most \(2\times10^{-8}\). From x and y alone, mediator removal cannot be distinguished from y turnover: this is structural non-identifiability. It resembles PK flip-flop, where exchanging absorption and elimination rates can preserve a blood-concentration curve when apparent volume absorbs the change. Increasing either fitted rate fivefold gives the correct 0.20-fold mean because steady gain depends on their product. Dynamic amplitude differs: the correct assignment gives 0.45 against a true 0.44, whereas the swapped assignment gives 0.32.
4. The direct model cannot express a mediator-specific intervention. It has no mediator-removal parameter to change. Importing mechanistic knowledge that k is proportional to \(1/\lambda\) from the quasi-steady approximation gives the correct 0.20-fold mean for the fast-mediator case. That knowledge comes from a mechanistic assumption, rather than from these observations.
A hidden mediator can therefore allow a good fit while leaving the parameter corresponding to the intended intervention unidentified. Measuring the mediator itself or intervening on it independently supplies information needed to resolve that assignment.
Evidence from microbial models
Niehaus and colleagues built an experimentally constrained community model explicitly including mediators such as metabolites and waste products. Under strong interactions, connectivity mattered more for coexistence than the strengths of facilitation and inhibition; mediator consumption or degradation moderated interactions and promoted coexistence (Niehaus et al. 2019). If removal depends on consumption by other species, the analogue of \(\lambda\) varies with community composition. Effective species-to-species edge strengths then change with composition too.
In a 2022 study I coauthored, Suzuki and colleagues generated time series from a chemical-mediated model based on Niehaus et al. and a model containing direct species interactions only, then compared five inference methods (Suzuki et al. 2022). These were Pearson and Spearman correlations, local similarity analysis (LSA) allowing time lags, convergent cross mapping (CCM) using state-space reconstruction under deterministic dynamical assumptions, and LIMITS, a regression method assuming generalized Lotka–Volterra interactions. Nutrient competition was represented separately from chemicals by the same total-abundance-dependent growth suppression in both models. Conditions with and without that competition were compared. Synthetic time series had process noise but no observation error, 100 points each, and network evaluation covered the five most abundant species.
Ground truth was the effective species-to-species interaction matrix, including effects through chemicals. The benchmark therefore tested detection of effective edges, not identification of mediators or separation of direct from mediated effects. This has the same effective-coefficient structure as Section 2.
| Condition | Result in Suzuki et al. (2022) |
|---|---|
| With nutrient competition | LIMITS and CCM detected interactions, with ROC-AUC higher in that order. Three correlation methods had ROC-AUC around 0.5, close to chance. |
| Chemical-mediated versus direct interactions with competition | LIMITS had lower ROC-AUC for chemical mediation, but no significant precision difference. CCM's difference was small and nonsignificant; its overall performance was below LIMITS. |
| Without nutrient competition | Interaction detection was difficult for every method. |
This does not establish that CCM uncovers hidden mediators. It is a benchmark under particular mathematical models and conditions, rather than evidence that direct and indirect actions can be separated in measured communities. When an inference method's assumed interaction form differs from biological action, the meaning of its inferred edges changes.
In 2026, Jansma and colleagues reported Bayesian inference of ODE networks containing both bacterial and metabolite states (Jansma et al. 2026). That framework assumes measured metabolite time series and was validated on synthetic data. It does not infer an unobserved mediator; it takes the direction of measuring mediators and including them in a model.
RNA-only regulatory networks have the same problem
Gene A's mRNA rises, followed by gene B's mRNA. Does that establish direct transcriptional regulation of B by A?
Even direct transcriptional regulation operates through A's protein. The question is therefore not whether a protein lies between the RNAs, but whether B is A's direct target or a secondary target reached through other regulators. Signaling often depends on activity states such as phosphorylation more than protein abundance. RNA-seq measures neither. An RNA-level A → B is an influence projected onto the RNA observation layer, not evidence that A's protein binds B's regulatory region (Kernfeld 2020).
Research is expanding measured layers. HALO in 2025 integrated single-cell chromatin accessibility and gene expression to separate components that change together from those changing independently (Mao et al. 2025). A 2026 review also describes unresolved challenges in cell-type-specific, dynamic and perturbation-based GRN inference (Shin et al. 2026).
Perturb-seq adds interventions: manipulating A and measuring all-gene responses can measure A's total effect. That alone does not distinguish a direct A–B edge from mediation through another gene. CausalBench evaluated methods using large-scale single-cell CRISPRi data. Initially, existing intervention-based methods did not outperform observation-only methods. Methods subsequently submitted through an open challenge all used interventional data and occupied many leading positions (Chevalley et al. 2025). There was no ground-truth network, however: biological and statistical proxies were used. A separate expression-forecasting benchmark across 11 large perturbation datasets reported that methods rarely exceeded simple references (Kernfeld et al. 2025). Perturbation data are useful, but their value depends strongly on analysis and evaluation.
Can time series alone reveal a hidden mediator?
Mohiuddin and colleagues asked whether two individuals' time series alone reveal an unseen intermediary (Mohiuddin et al. 2025). In their modified transfer-entropy analysis, direct interactions showed monotonic decline with increasing lag, whereas indirect interactions departed from that pattern. They demonstrated this in standard collective-motion models: a modified Vicsek model and Langevin dynamics.
Their method relies on an explicitly stated working hypothesis that direct influence declines for lags longer than the interaction time scale. The authors identify outstanding issues: estimating that time scale from data, exceptions under low noise or weak coupling, sampling-frequency dependence, and inconsistent classification when one individual jointly drives two others. The last point means the study does not establish separation of mediation from confounding, directly connecting to Section 1.
A 2026 review organizes single-cell machine learning by modeling paradigms, assumptions and purposes, including representation learning, causal inference, mechanism discovery and perturbation-effect extrapolation (Dimitrov et al. 2026). This aligns with specifying observations, extrapolations and causal assumptions before selecting a model.
Mediator assumptions change pharmacological extrapolation
In drug discovery, the drug target itself can be a mediator. Edges in omics- or AI-derived gene/protein networks may be effective coefficients projected onto the measured layer. Manipulating an associated molecule with a drug need not reproduce the inferred edge's action.
The path from dosing to effect has the same structure:
Dose D → blood concentration C → tissue concentration → target occupancy R → signaling → effect Y
Blood concentrations and effects can support an exposure–response model without identifying target occupancy as the actual mediating pathway. A blood-to-effect coefficient combines tissue distribution, binding and signaling. Saturating occupancy can also make that coefficient concentration-dependent. It cannot be transferred unchanged across routes, tissue penetration, target expression or target-mediated drug disposition (TMDD).
Observational analyses also need to distinguish confounding from mediation. Dai and colleagues organize antibody exposure–response associations into three components: exposure itself; greater disease severity causing higher clearance and lower exposure (confounding); and treatment response lowering clearance (reverse causation). Suggested approaches to the latter two include first-dose exposure and randomized assignment to multiple doses (Dai et al. 2020).
The aim is not to measure every molecule indiscriminately. It is to add information that distinguishes competing mechanistic hypotheses.
| Question | Informative observations or experiments | Remaining limitation |
|---|---|---|
| Direct or mediated action? | Measure shortly after an acute perturbation at resolution finer than mediation; distinguish primary and secondary responses. Add translation-blocked conditions, nascent RNA or regulatory-region binding measurements such as ChIP or CUT&RUN. | Unmeasured pathways may remain even within a measured layer. |
| Does changing X change Y? | Randomize interventions on X; verify specificity, including siRNA off-target effects or inhibitors acting on multiple targets. | A total effect does not identify its mediating path. |
| Is a particular M necessary? | Combine X and M interventions; test whether modifying M removes X's effect, or supplying M bypasses X manipulation. | M may act through other routes; floor effects can conceal differences. |
| Does the drug engage its target and produce effects through it? | Measure target engagement, genetic/compound concordance, loss of effect in binding-resistant mutants and temporal changes from proximal to distal biomarkers. | Movement of a proximal marker does not validate the entire efficacy pathway. |
| Which mechanistic model is appropriate? | Experiment where competing predictions differ: measure the mediator in Section 3, or choose inputs revealing different dynamic amplitudes. | Feasibility and parameter identifiability still matter. |
Human genetics provides an independent source of evidence about target validity. Genetically supported targets have been associated with higher clinical development success (Minikel et al. 2024). This tests hypotheses with information beyond the observed association. Lifelong genetic variation, however, differs from acute drug inhibition, and one gene can influence multiple pathways through pleiotropy.
Quantifying mediation requires stricter conditions. VanderWeele's review describes assumptions for causal direct and indirect effects: no unmeasured exposure–outcome, mediator–outcome or exposure–mediator confounding, and no exposure-induced mediator–outcome confounder, together with sensitivity analyses (VanderWeele 2016). Disease severity influencing both clearance and effect is one relevant violation.
A correct total effect does not identify the intervention target
Omitting an unobserved mediator does not always make a model useless. An effective model can suffice for total-effect predictions on observed variables. The direct model in the example recovered the overall gain.
That does not make an effective edge a direct molecular action or establish that manipulating it reproduces the same effect. Even the structurally correct model could not assign its two rates to the mediator versus the response. Identifying the parameter corresponding to the intended intervention requires mediator measurements or independent mediator interventions.
A direct model lacking the mediator cannot calculate an experiment that manipulates that mediator itself. A well-fitted observational edge and a defined corresponding intervention are different properties.
Reproduce the example and its limits
Extract the reproduction ZIP and run the following from its directory with Python 3.11 or later. Tested versions are pinned in requirements.txt. Runtime is approximately 15 minutes, depending on the environment.
python -m pip install -r requirements.txt
python mediator_demo.py
The calculation code creates results/summary.json, results/fits.csv and two figures. The seed is fixed. Both models were fitted from multiple initial values, retaining the smallest residual sum. All nine direct-model starts reached the same solution. All eight two-stage starts did so for the slow mediator, but only one of eight for the fast mediator. The fast rate, estimated at 8.7 against true 10/day, is faster than daily sampling and weakly informed by these data.
The system is linear, with one mediator and a known periodic input x. Nonlinearity such as saturation, multiple mediators, feedback and confounding are not examined. Intervention effects are compared only through the mean and amplitude over the last 20 days. These are illustrative values under this setup, rather than estimates for a specific microbe or drug.
References
- Kernfeld E. Coping with missing data in biological network modeling. Blog (2020). Original post
- Runge J, et al. Inferring causation from time series in Earth system sciences. Nature Communications 10, 2553 (2019). doi:10.1038/s41467-019-10105-3
- Sheiner LB, Stanski DR, Vozeh S, Miller RD, Ham J. Simultaneous modeling of pharmacokinetics and pharmacodynamics: application to d-tubocurarine. Clinical Pharmacology & Therapeutics 25, 358–371 (1979). doi:10.1002/cpt1979253358
- Dayneka NL, Garg V, Jusko WJ. Comparison of four basic models of indirect pharmacodynamic responses. Journal of Pharmacokinetics and Biopharmaceutics 21, 457–478 (1993). doi:10.1007/BF01061691
- Niehaus L, et al. Microbial coexistence through chemical-mediated interactions. Nature Communications 10, 2052 (2019). doi:10.1038/s41467-019-10062-x
- Suzuki K, Abe MS, Kumakura D, et al. Chemical-mediated microbial interactions can reduce the effectiveness of time-series-based inference of ecological interaction networks. International Journal of Environmental Research and Public Health 19, 1228 (2022). doi:10.3390/ijerph19031228
- Jansma J, Landi P, Hui C. Bayesian inference captures metabolite-bacteria interactions in a microbial community. ISME Communications 6, ycag066 (2026). doi:10.1093/ismeco/ycag066
- Mao H, et al. HALO: hierarchical causal modeling for single cell multi-omics data. Nature Communications 16, 8892 (2025). doi:10.1038/s41467-025-63921-1
- Shin J, et al. Modeling dynamics, cell type specificity, and perturbations in gene regulatory networks. Annual Review of Genomics and Human Genetics 27, 103–129 (2026). doi:10.1146/annurev-genom-120922-103729
- Chevalley M, et al. A large-scale benchmark for network inference from single-cell perturbation data. Communications Biology 8, 412 (2025). doi:10.1038/s42003-025-07764-y
- Kernfeld E, Yang Y, Weinstock JS, Battle A, et al. A comparison of computational methods for expression forecasting. Genome Biology 26, 388 (2025). doi:10.1186/s13059-025-03840-y
- Mohiuddin M, et al. Detecting existence of a hidden mediator between a pair of individual time series. Scientific Reports 15, 21610 (2025). doi:10.1038/s41598-025-04436-z
- Dimitrov D, Schrod S, Rohbeck M, Stegle O. Interpretation, extrapolation and perturbation of single cells. Nature Reviews Genetics 27, 349–370 (2026). doi:10.1038/s41576-025-00920-4
- Dai HI, Vugmeyster Y, Mangal N. Characterizing exposure-response relationship for therapeutic monoclonal antibodies in immuno-oncology and beyond: challenges, perspectives, and prospects. Clinical Pharmacology & Therapeutics 108, 1156–1170 (2020). doi:10.1002/cpt.1953
- Minikel EV, et al. Refining the impact of genetic evidence on clinical success. Nature 629, 624–629 (2024). doi:10.1038/s41586-024-07316-0
- VanderWeele TJ. Mediation analysis: a practitioner's guide. Annual Review of Public Health 37, 17–32 (2016). doi:10.1146/annurev-publhealth-032315-021402
Cite this article
Kumakura, D. (2026). Unobserved mediators do not disappear from a network. daikikumakura.github.io. https://daikikumakura.github.io/writing/hidden-mediator-networks-en.html