Can public data show that ivonescimab 20 mg/kg Q3W beats 10 mg/kg Q3W?
On this page
Abstract
Public aggregate ivonescimab PK, PD-1 occupancy and dose-group response data were audited for support of 20 versus 10 mg/kg every three weeks. A prespecified PK check failed, so longer-interval extrapolations were withheld. Trough PD-1 occupancy was high across tested doses. A hierarchical ORR analysis was inconclusive under the selected decision rule, with a broad posterior-predictive true-effect range for a new setting. Illustrative randomized-comparison calculations also depended strongly on uncertainty about the dose effect. These results neither recommend a dose nor predict regulatory decisions.
Literature audit date: October 10, 2026; primary-text cohort sizes were additionally checked on October 13. Only published aggregate information was used, without individual records or predictions of drug superiority or regulatory outcomes.
Introduction
Ivonescimab binds PD-1 and VEGF. Registration studies use 20 mg/kg every three weeks. A 2026 commentary argued that its dose selection did not meet US Project Optimus expectations (1). How much of that question can public data answer?
The examined evidence supported neither direction under the prespecified rule. The 20-versus-10 mg/kg ORR contrast for a new setting ranged approximately −25 to +25 percentage points. The probability of a positive overall slope was 0.71, below the selected 0.90 support criterion. This also did not establish that 10 mg/kg was sufficient.
Scope and methods
Question and use
The question and context were fixed in writing and hashed before analysis. The quantity of interest was support from public phase I–II PK, occupancy and ORR for 20 over 10 mg/kg Q3W and the scale of an illustrative randomized comparison.
Use is limited to quantitative organization of public evidence, without dose recommendations or regulatory forecasts. Unsupported endorsement of a dose and overlooking a necessary comparison are both potential errors.
A population-PK fitting plan was replaced with an aggregate-evidence audit because no public ivonescimab PopPK model was found in the source search conducted for that analysis.
Public data
Table 1. Sources and extracted quantities
| Source | Study | Values used |
|---|---|---|
| Wang et al. 2025 (2) | Phase I, 59 participants; 3–30 mg/kg Q2W and 10/20 mg/kg Q3W; CC BY | PK and PD-1 occupancy across seven cohorts |
| Zhao et al. 2023 (3) | Phase II chemotherapy combinations in three NSCLC settings, each at 10/20 mg/kg Q3W | ORR and denominators |
| Wang et al. 2024 (4) | Phase Ib first-line, PD-L1-positive NSCLC monotherapy, 67 participants | Primary-text counts 7/21, 10/19, 9/15 and 9/12 |
| Chen et al. 2025 (5) | Phase Ib etoposide/carboplatin combination in SCLC, 35 participants | Primary-text group sizes 3, 11 and 21; response counts determined by percentages |
The seven monotherapy/SCLC group sizes were initially derived from reported percentages, totals of 67 and 35 participants, 28/35 responses, and the commentary's pooled 19/31=61.3%. On October 13, 2026, primary texts confirmed every derived denominator: monotherapy 7/21, 10/19, 9/15 and 9/12, totaling 35/67; SCLC n=3, 11 and 21. SCLC responses 2/3, 10/11 and 16/21 follow uniquely from those sizes and percentages. Analysis retained the planned derived inputs.
Evidence and calculations
PK check and withheld extrapolation
A linear one-compartment model used cohort single-dose clearance, volume and median weight to predict steady-state trough and mean concentration. Before calculation, reporting longer intervals such as Q4W/Q6W required at least five of seven cohorts to meet each selected discrepancy criterion.
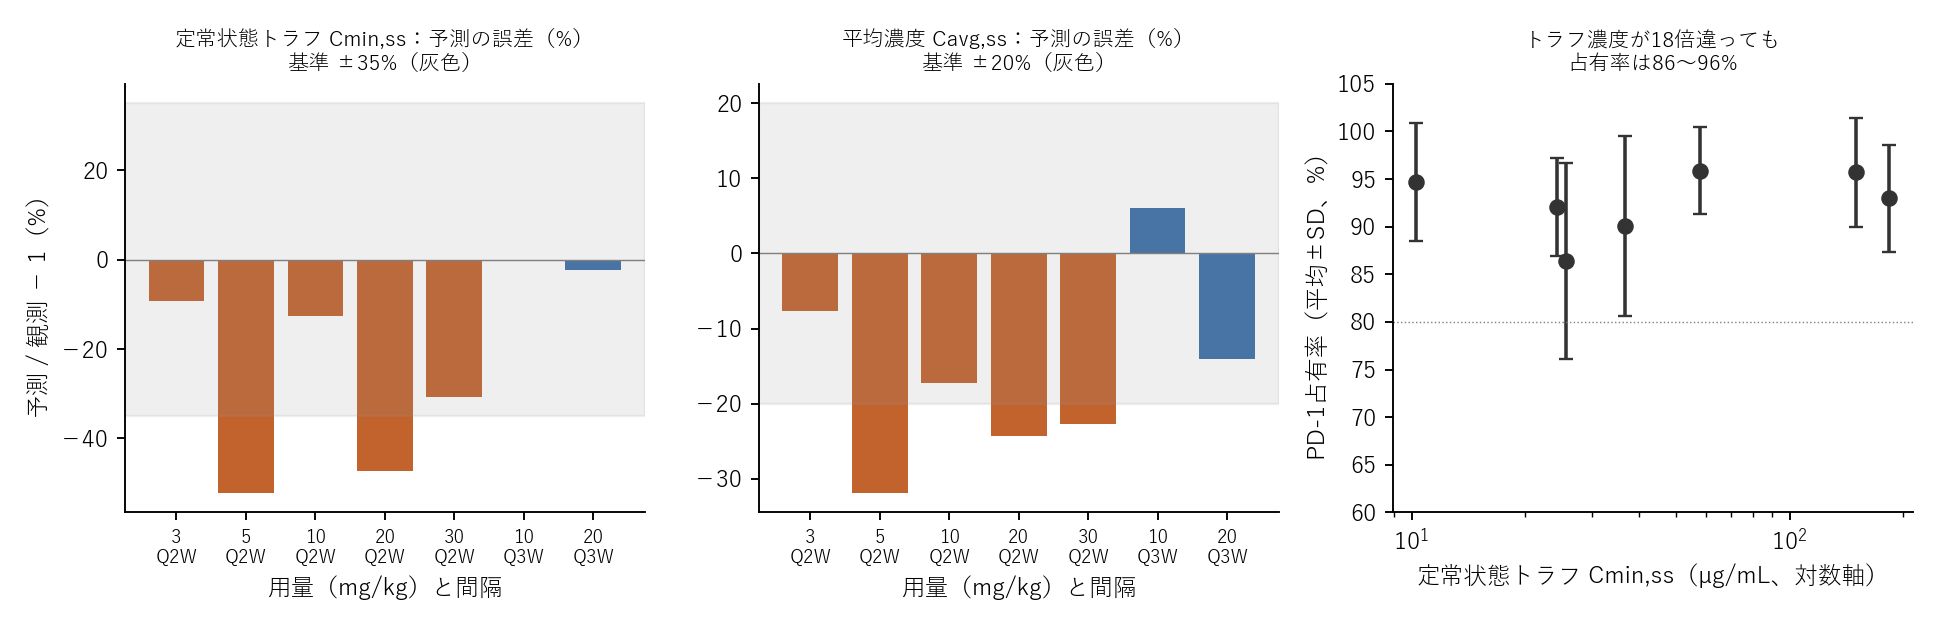
Figure 1. Aggregate PK checks and occupancy. PK agreement and measured trough occupancy answer separate questions.
Five of seven trough predictions were within ±35%, but only four mean-concentration predictions were within ±20%. Both required five, so longer-interval extrapolations were not reported.
The two Q3W cohorts had trough discrepancies of 0% and −2%; all five Q2W cohorts were underpredicted. Their reported steady-state clearance, 0.31–0.41 L/day, was below single-dose clearance, 0.39–0.49 L/day. This is compatible with time-varying clearance but does not identify it. Steady-state cohorts had five participants each, or four at 30 mg/kg, and no test was performed. Saturable target-mediated elimination, disease changes and small-sample variation remain alternatives.
PD-1 occupancy over the measured range
Mean steady-state trough occupancy was 86.4–95.9% across seven cohorts, despite trough concentrations of 10.3–183 µg/mL, a 17.8-fold range. The tested low-dose troughs already showed high occupancy.
Lower-concentration transitions were not observed and no Emax model was fitted. The finding concerns limited discrimination by PD-1 occupancy within the tested range, not VEGF activity or intratumoral target access. Serum VEGF was not modeled because the paper itself found no dose response.
Hierarchical ORR model
Five settings comprised three NSCLC chemotherapy cohorts, NSCLC monotherapy and ES-SCLC chemotherapy. For a group in setting \(s\),
\[ \text{responders} \sim \text{Binomial}(n, p),\qquad \mathrm{logit}\,p = a_s + b_s\,x,\qquad b_s\sim\mathcal N(\mu_b,\tau^2) \]
\(x\) is log2 weekly dose intensity relative to 10 mg/kg Q3W: zero at 10 and one at 20 mg/kg Q3W. The model also includes unlisted groups: monotherapy 20 mg/kg Q2W and 30 mg/kg Q3W, and SCLC 3 mg/kg Q3W.
Settings are assumed exchangeable. \(\mu_b\) is the average slope and \(\tau\) between-setting spread. With only five settings, τ is weakly informed: posterior median 0.31, 95% credible interval 0.02–0.93. Prediction for a new setting depends strongly on that spread.
Priors are \(a_s\sim\mathcal N(0,2^2)\), \(\mu_b\sim\mathcal N(0,1)\) and \(\tau\sim\text{HalfNormal}(0.5)\). Metropolis-within-Gibbs used four chains of 4,000 iterations, discarding the first 1,000 per chain. Maximum \(\hat R\) was 1.009. ESS was 317 for \(\mu_b\), 647 for \(\log\tau\) and at least 317 overall. Probabilities such as 0.71 versus 0.73 should not be treated as precisely distinguished at the hundredth. Comparisons with glmer and separate numerical integration are reported below.
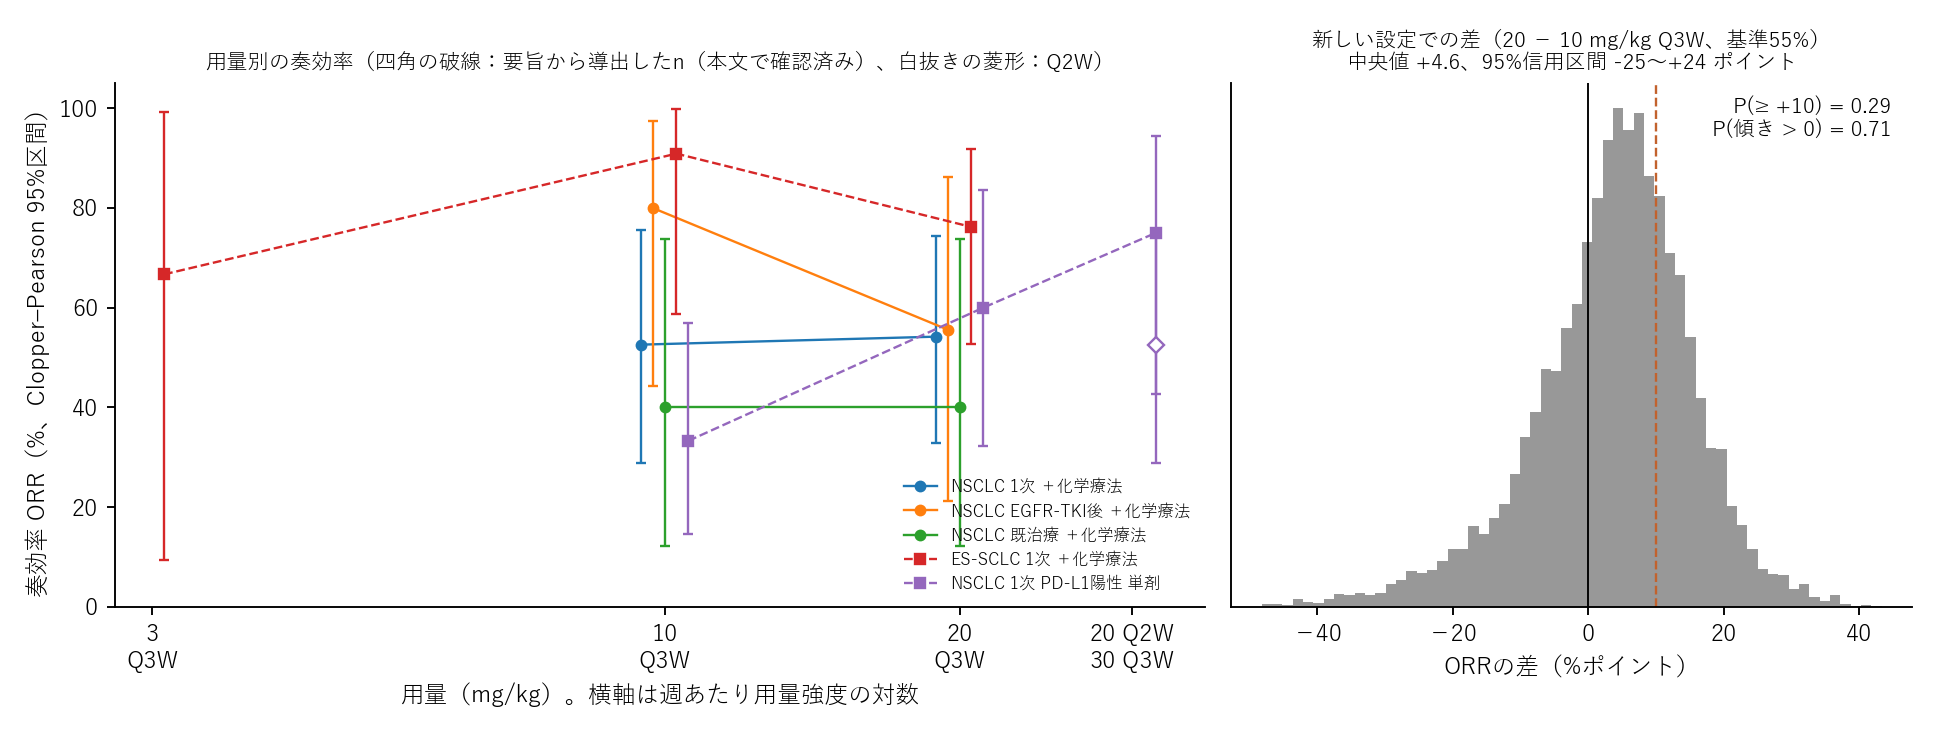
Figure 2. Observed responses and model-based dose contrasts. New-setting intervals depend on exchangeability, five settings and the τ prior; they are not intervals for future observed sample proportions.
Table 2. Descriptive 10-versus-20 mg/kg Q3W contrasts
| Setting | 10 mg/kg Q3W | 20 mg/kg Q3W | Difference, points |
|---|---|---|---|
| First-line NSCLC plus chemotherapy | 10/19 (52.6%) | 13/24 (54.2%) | +1.5 |
| Post-EGFR-TKI NSCLC plus chemotherapy | 8/10 (80.0%) | 5/9 (55.6%) | −24.4 |
| Previously treated NSCLC plus chemotherapy | 4/10 (40.0%) | 4/10 (40.0%) | 0.0 |
| ES-SCLC plus chemotherapy | 10/11 (90.9%) | 16/21 (76.2%) | −14.7 |
| First-line PD-L1-positive NSCLC monotherapy | 7/21 (33.3%) | 9/15 (60.0%) | +26.7 |
Pooling the three NSCLC combination cohorts gives 22/39 (56.4%) at 10 and 22/43 (51.2%) at 20 mg/kg. No descriptive improvement appears in that pool. Monotherapy has the largest positive contrast; the first-line NSCLC combination also has a small +1.5-point contrast. These raw two-group differences are not the hierarchical slopes, which share information between settings.
Overall slope posterior median was 0.17, with 95% credible interval −0.49 to 0.77 and \(P(\mu_b>0)=0.71\). For a new setting with baseline ORR 55%, the true 20-minus-10 contrast had median +4.6 points and posterior-predictive 95% interval −24.6 to +24.5. Probabilities of at least +10 and at most −10 points were 0.29 and 0.12.
Under the selected rule—support at probability at least 0.90, oppose at at most 0.10—the result is inconclusive.
Sensitivity and independent calculations
Five sensitivity families excluded monotherapy, excluded SCLC, widened the τ prior, changed the μb prior SD to 0.5 or 2, or retained only Q3W groups. The latter removes only monotherapy 20 mg/kg Q2W. All remained inconclusive. The two μb prior variants gave probabilities 0.705 and 0.722 and contrast intervals −23.7 to +23.8 and −25.0 to +25.9 points. Removing monotherapy made the slope median negative, with positive-slope probability 0.38.
A separate R lme4::glmer comparison, outside analysis.py, gave slope 0.215 (SE 0.233). A fixed-effect model gave 0.270 (95% interval −0.206 to 0.747). The mixed model was singular, with between-setting slope variance at zero.
Separate grid integration marginalized setting-specific \(a_s,b_s\) and directly calculated the \(\mu_b,\tau\) posterior. It gave slope median 0.18 versus MCMC 0.17, positive-slope probability 0.73 versus 0.71, new-setting interval −22.8 to +24.6 versus −24.6 to +24.5, and tail probabilities 0.29 versus 0.29 and 0.10 versus 0.12. Results are broadly close; both Monte Carlo and grid approximations limit finer comparisons.
The large positive descriptive monotherapy contrast does not determine whether chemotherapy masks a dose effect through response saturation or settings truly have different dose responses.
Illustrative randomized comparisons
Normal-approximation design calculations compare 10 and 20 mg/kg Q3W at baseline ORR 55%.
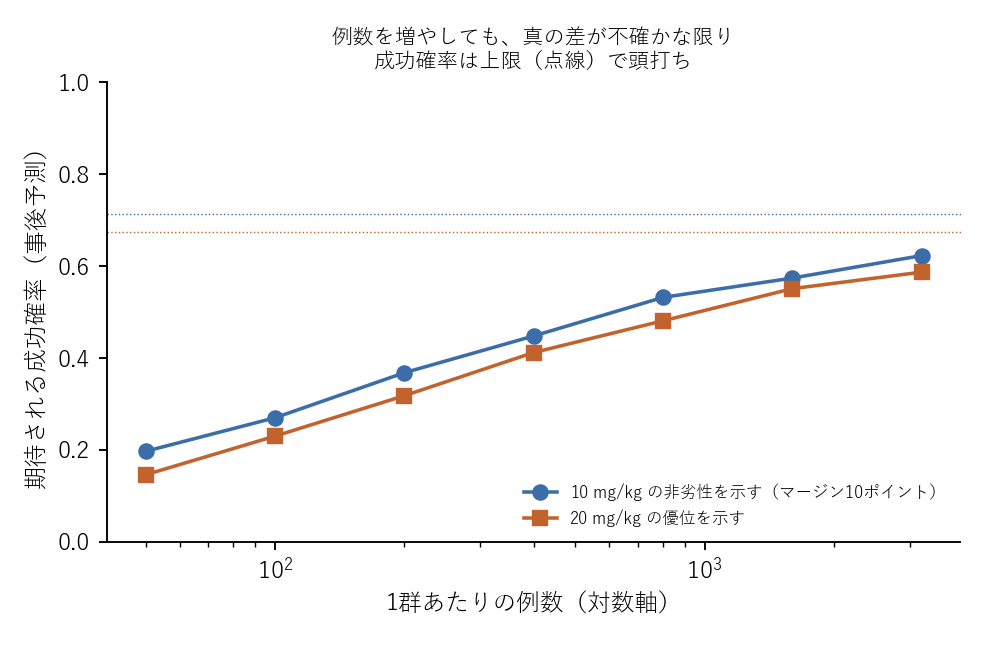
Figure 3. Illustrative trial assurance. Calculations depend on posterior true-effect uncertainty and the stated tests, not only sample size.
At 80% power, demonstrating lower-dose noninferiority with a −10-point margin and true difference zero requires 389 per arm. Detecting higher-dose superiority with true +10 points requires 376 per arm; +5 requires 1,534 and +15 requires 163.
Posterior-averaged success probability, or Bayesian assurance, was 0.45 for noninferiority and 0.41 for superiority at 400 per arm. At 3,200 it was 0.62 and 0.59. Infinite-sample limits are 0.71 for noninferiority—the probability the true higher-minus-lower contrast is below +10 points—and 0.67 for superiority—the probability it is positive. Tests use one-sided 2.5% for noninferiority and two-sided 5% with superiority declared in the positive direction. The 0.71 here differs from the 0.71 positive-average-slope probability above.
Uncertainty about direction and magnitude, not merely sample size, constrains assurance. The approximately 400-per-arm scale is specific to the endpoint and assumed differences, not trial-design advice.
Discussion
The public evidence does not establish higher-dose superiority or inferiority. High trough PD-1 occupancy cannot select a dose within the studied range, and it does not address VEGF action. The monotherapy contrast suggests one possible information gap, but it rests on four small nonrandomized groups of 12–21 participants and does not establish a trial recommendation. The 0.12 probability of a −10-point-or-worse contrast also prevents concluding that 10 mg/kg is sufficient.
ORR alone does not determine a recommended dose. Safety/tolerability, other E–R outcomes, OS/PFS dose effects, weight/race influences and regulatory outcomes were not estimated.
Limitations and departures from plan
All included trials were nonrandomized, with sequential dose assignment. Phase II gave 10 mg/kg earlier and 20 mg/kg later within cohorts, so period and dose effects cannot be separated.
Primary texts confirmed the seven derived group sizes. Exhaustive integer searches found one SCLC combination matching n=35, 28 responses and percentages 66.7%, 90.9%, 76.2%: (3,2), (11,10), (21,16). Monotherapy totals and percentages alone allowed 19 combinations; adding commentary-table constraints n=21,15,31 and 19/31 left (21,7), (19,10), (15,9), (12,9), matching the text.
Only group summaries were available. Monotherapy/SCLC response results had been seen in abstracts and commentary before fixing the plan; later primary-text verification does not make this outcome-blinded analysis.
Failed PK checks were not rescued by changing the rule. A formula for superiority assurance was corrected before reporting because it incorrectly returned zero when the true contrast was negative. Initial outputs were retained, and ORR posterior results were unchanged.
Conclusion
Under the chosen model and decision rule, aggregate ORR evidence remains inconclusive for 20 versus 10 mg/kg Q3W. Occupancy and failed PK checks answer different questions and do not resolve the dose choice. The analysis identifies uncertainty requiring evidence, rather than recommending a dose.
Data and code availability
The reproduction ZIP includes code, sourced aggregate inputs, the fixed analysis plan, outputs and figure code. python analysis.py && python figures.py uses numpy, scipy and matplotlib, with fixed seeds and approximately 25-second runtime depending on environment. python independent_check.py performs grid verification and python n_uniqueness_check.py the integer search.
References
- Strohbehn GW, Ratain MJ. Ivonescimab: The Next United States Food and Drug Administration Project Optimus Flashpoint?. JTO Clinical and Research Reports. 2026;7(7):100976. doi:10.1016/j.jtocrr.2026.100976.
- Wang F, Wei X, Zheng Y, Wang J, Ying J, Chen X, et al. Safety, Pharmacokinetics, and Pharmacodynamics Evaluation of Ivonescimab, a Novel Bispecific Antibody Targeting PD-1 and VEGF, in Chinese Patients With Advanced Solid Tumors. Cancer Medicine. 2025;14(6):e70653. doi:10.1002/cam4.70653.
- Zhao Y, Chen G, Chen J, Zhuang L, Du Y, Yu Q, et al. AK112, a novel PD-1/VEGF bispecific antibody, in combination with chemotherapy in patients with advanced non-small cell lung cancer (NSCLC): an open-label, multicenter, phase II trial. eClinicalMedicine. 2023;62:102106. doi:10.1016/j.eclinm.2023.102106.
- Wang L, Luo Y, Ren S, Zhang Z, Xiong A, Su C, et al. A Phase 1b Study of Ivonescimab, a Programmed Cell Death Protein-1 and Vascular Endothelial Growth Factor Bispecific Antibody, as First- or Second-Line Therapy for Advanced or Metastatic Immunotherapy-Naive NSCLC. Journal of Thoracic Oncology. 2024;19(3):465–475. doi:10.1016/j.jtho.2023.10.014.
- Chen Z, Wu L, Wang Q, Yu Y, Liu X, Ma R, et al. Brief Report: Ivonescimab Combined With Etoposide Plus Carboplatin as First-Line Treatment for Extensive-Stage SCLC: Results of a Phase 1b Clinical Trial. Journal of Thoracic Oncology. 2025;20(2):233–239. doi:10.1016/j.jtho.2024.10.013.