How robust is the FVC signal in the rentosertib phase 2a trial to missing-data assumptions?
Published FVC summaries from the rentosertib phase 2a trial are examined under missing-data assumptions, without determining efficacy, dose or safety.
On this page
- Background and objective
- Trial and reported results
- Question, methods and intended use
- What the headline confidence interval describes
- Sensitivity to missing-data assumptions
- Missingness differs across groups
- Assumed effect and trial assurance
- Discussion
- Limitations
- Data and code availability
- References
Background and objective
Literature checked on October 13, 2026. The main analysis uses published aggregate values. Individual values in public source data were used only to check interval calculations, not for a participant-level reanalysis. This article does not determine efficacy, dose or regulatory outcomes.
Rentosertib, formerly ISM001-055, is a generative-AI-designed small molecule inhibiting TNIK and under investigation for idiopathic pulmonary fibrosis, IPF. Its phase 2a results appeared in Nature Medicine in 2025 (1). At 12 weeks, the 60 mg once-daily group had a mean forced vital capacity, FVC, increase of +98.4 mL, with a 95% confidence interval of 10.9–185.9. The placebo group changed by −20.3 mL, with an interval of −116.1–75.6.
The paper describes this as the first phase 2a trial of a generative-AI-discovered and designed drug. That description is the authors' characterization. A placebo-controlled drug trial does not compare the benefits of AI design with another discovery method. The question here is how uncertain the reported FVC signal remains.
Trial and reported results
The multicenter, double-blind, placebo-controlled trial randomized 71 participants to 30 mg once daily, 30 mg twice daily, 60 mg once daily or placebo. Safety was the primary endpoint; FVC was secondary. Week-12 FVC was available for 49 participants and missing for 22, or 31%.
Table 1. Allocation, missingness and week-12 FVC change.
| Group | Randomized | Week-12 FVC available | Missing | Observed-case mean change (95% CI) | Multiple imputation assuming MAR (95% CI) |
|---|---|---|---|---|---|
| Placebo | 17 | 14 | 3 (18%) | −20.3 mL (−116.1–75.6) | −8.2 (−98.1–81.7) |
| 30 mg once daily | 18 | 13 | 5 (28%) | −27.0 (−88.8–34.8) | −24.2 (−105.0–56.6) |
| 30 mg twice daily | 18 | 12 | 6 (33%) | +19.7 (−60.5–99.9) | +19.4 (−68.7–107.4) |
| 60 mg once daily | 18 | 10 | 8 (44%) | +98.4 (10.9–185.9) | +89.2 (−8.7–187.2) |
Missingness increased across placebo, 30 mg QD, 30 mg BID and 60 mg QD. The paper used multiple imputation for secondary outcomes under missing at random, MAR: conditional on observed information, missingness does not additionally depend on the unobserved value.
Mean baseline FVC differed between placebo, 2,246 mL, and 60 mg, 2,762 mL. Nintedanib use also differed, with nine participants in the 60 mg group versus three on placebo; pirfenidone use was two versus four. Observed-case differences are not adjusted for these imbalances. The reported multiple-imputation ANCOVA values adjust for baseline.
Question, methods and intended use
Before calculation, I fixed a written question, method and decision rule and recorded the plan's hash. All reported arm means, intervals, counts and missingness were already known when the plan was written. New calculations concern between-arm intervals, changed missing-data assumptions and sample-size illustrations.
The question is how the 60 mg FVC signal changes under MAR, worsening after discontinuation and a placebo-like course, and how effect uncertainty affects a hypothetical subsequent trial. The intended use is quantitative interpretation of aggregate evidence. It excludes recommending a dose, judging overall efficacy, balancing benefit against safety or making a regulatory decision. Errors could either overstate an uncertain signal or dismiss a real one solely because it remains uncertain.
What the headline confidence interval describes
The +98.4 mL interval, 10.9–185.9, concerns change from baseline within the 60 mg group, not the treatment–placebo difference. The placebo interval is wide. The paper describes an increasing trend in FVC and does not report a p value for this placebo contrast.
The reported interval is reproduced by a normal calculation. The paper's source data for Figure 4 and supplementary figures include ten individual week-12 changes in the 60 mg group (2). Their mean is +98.4 mL, SD 141.1 and SE 44.6. Applying \(98.4\pm1.96\times44.6\) yields 10.9–185.9. Using a t distribution with nine degrees of freedom and a critical value of 2.26 instead gives −2.6–+199.4 mL. Both methods are used in practice, but the t approach is conventional when a small-sample mean's variance is estimated. Individual values are not redistributed; a checking script is included.
I recovered standard errors from the published intervals using the same 1.96 normal critical value and then calculated differences between the 60 mg and placebo groups.
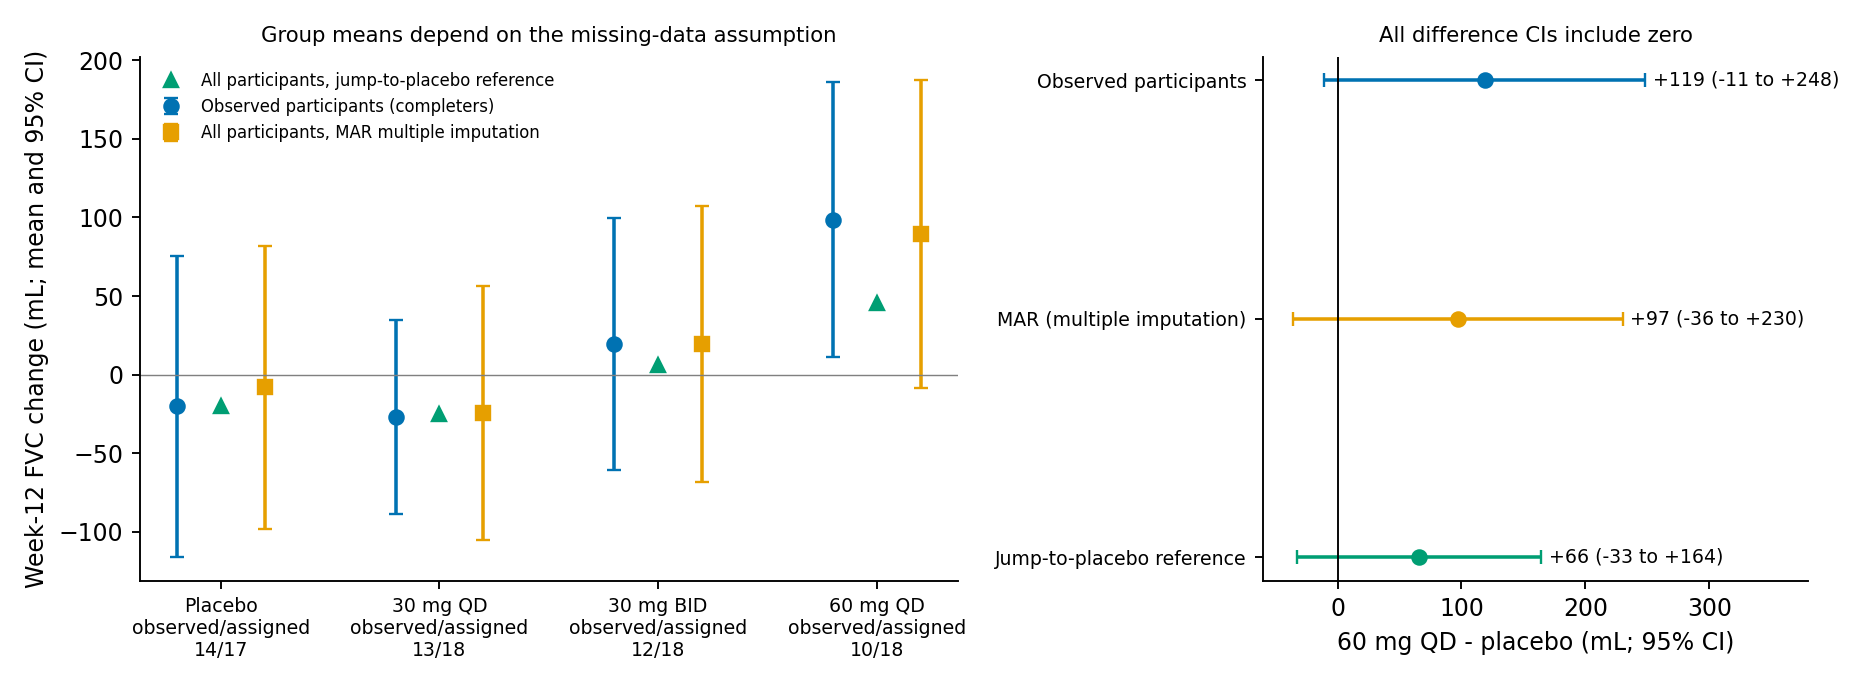
Figure 1. Means and between-arm contrasts under alternative missing-data assumptions.
Table 2. The 60 mg QD minus placebo contrast. The probability column summarizes the stated normal approximation or imputation simulation.
| Missing-data approach | 60 mg minus placebo (mL) | 95% interval | Fraction of reference distribution above 0 |
|---|---|---|---|
| Observed cases, 10 versus 14 | +118.7 | −11.1–+248.5 | 0.96 |
| MAR multiple imputation, 18 versus 17 | +97.4 | −35.6–+230.4 | 0.92 |
| Missing participants assigned a placebo-like course | +65.9 | −32.9–+164.5 | 0.90 |
For normal-approximation rows, the final column is the positive-side area of a normal reference distribution centered on the estimated contrast. A frequentist interval does not thereby yield the probability that a true effect exists. The placebo-course row instead gives the fraction of positive simulated contrasts under its imputation model. These descriptive quantities differ from the posterior probabilities with a skeptical prior below, including 0.91 under MAR.
A Welch t interval for the observed-case contrast, with SDs recovered from the reported normal intervals, is −18.7–+256.1 mL, with a two-sided \(p=0.087\). All three approaches in Table 2 include 0. Their point estimates favor 60 mg QD. Under the prespecified rule requiring all three intervals to exclude 0, the signal is not designated robust. This reflects uncertainty already present under MAR; it does not demonstrate that changing the missing-data assumption destroyed an otherwise established result. The observed-case contrast of +118.7 mL decreases when the eight missing participants in the 60 mg group are assigned less favorable outcomes.
The trial authors compare a modeled FVC percentage increase of +2.82% with an IPF minimal clinically important difference, MCID, of 2–6%. The cited MCID study concerns percent-predicted FVC, which is not necessarily the same scale as relative change from measured baseline FVC (3). I therefore do not multiply the 2–6% range by this group's measured baseline to convert it to mL. Clinical importance and uncertainty in a between-arm contrast are separate questions.
Sensitivity to missing-data assumptions
What MAR assumes
Combining the published imputed and observed means algebraically gives an apparent missing-participant mean of approximately +78 mL for 60 mg and +48 mL for placebo. This is not a literal reconstruction of imputed participant outcomes: the imputed ANCOVA means adjust for baseline, whereas observed-case means do not. One cannot conclude that the model simply assumed an average +78 mL improvement among missing participants. The triangles in Figure 1 represent the separate placebo-course construction.
MAR assumes that missingness does not additionally depend on unobserved FVC after conditioning on information included in imputation. Observed data alone cannot verify that assumption.
A tipping-point calculation
Subtract \(\delta\) mL from the active group's MAR-imputed missing-participant outcomes:
\[ \bar y_a(\delta)=\bar y_a^{\mathrm{MI}}-\frac{n^{m}_a}{n_a}\,\delta,\qquad \Delta(\delta)=\bar y_{60}(\delta)-\bar y_{\mathrm{placebo}}^{\mathrm{MI}}. \]
Here \(n^{m}_a\) is the number missing and \(n_a\) the number randomized.
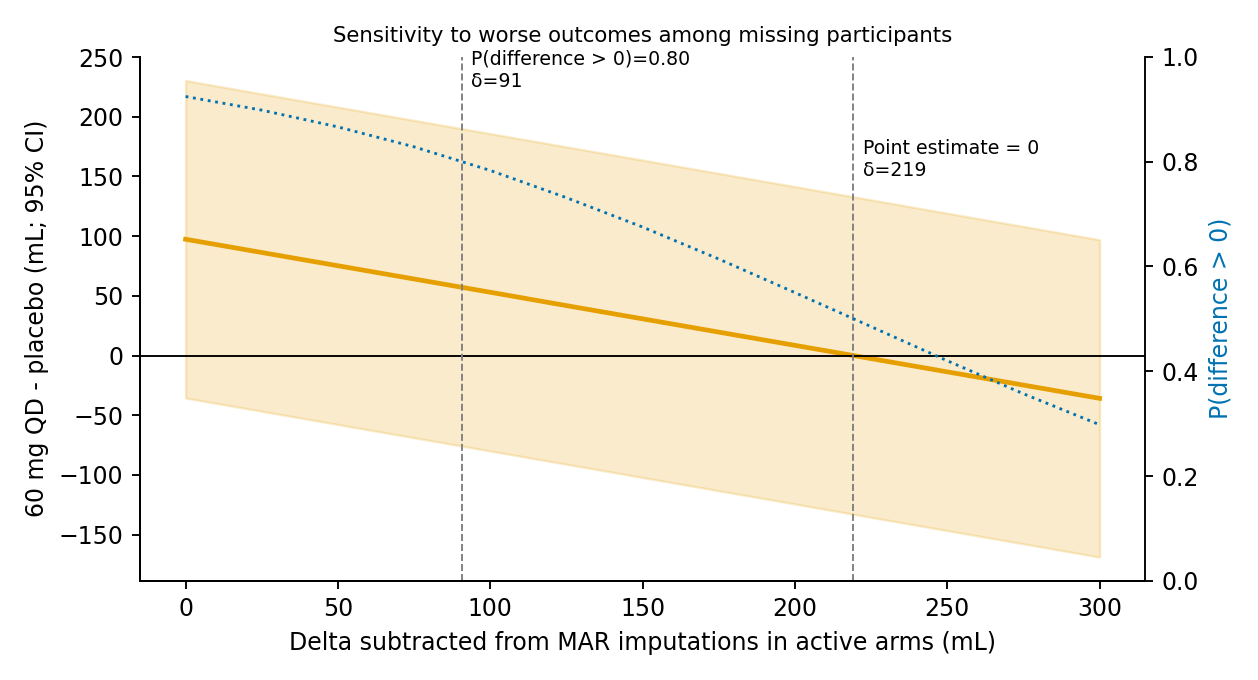
Figure 2. Estimated contrast versus the assumed worsening among missing participants, with the MAR standard error held fixed.
The point estimate reaches 0 at approximately \(\delta=219\) mL: the eight missing participants' average would be that much below its MAR counterpart. Relative to the apparent +78 mL algebraic value, this corresponds to approximately −141 mL, subject to the adjustment mismatch already described. The normal-reference positive area falls to 0.80 at approximately \(\delta=91\) mL and to 0.78 at \(\delta=100\) mL. The point estimate's sign persists over substantial worsening, while the interval already includes 0 at \(\delta=0\).
This sensitivity calculation holds the published MAR standard error fixed at each \(\delta\). Aggregate data cannot reconstruct the imputation model or reestimate its variance. Fixed standard error is therefore an additional approximation, not a general claim that a missing-not-at-random analysis preserves uncertainty unchanged.
Missingness differs across groups
Missingness was 18% on placebo, with a 95% interval of 4–43%; 28% on 30 mg QD; 33% on 30 mg BID; and 44% on 60 mg QD, with an interval of 21–69%. The 60 mg versus placebo comparison gave Fisher's exact \(p=0.15\) and a risk difference of +27 percentage points, with an interval of −2–+56.
Treatment discontinuations attributed to adverse events numbered two on placebo, one on 30 mg QD, five on 30 mg BID and four on 60 mg QD. Liver injury or hepatic dysfunction led to seven discontinuations: four on 30 mg BID and three on 60 mg QD, with none in the other groups. Four of these seven participants were also receiving nintedanib.
MAR departures matter if post-discontinuation outcomes depend on information not explained by observed variables. A high discontinuation count alone does not demonstrate failure of MAR. Detailed timing, reasons and intermediate measurements are unavailable for this analysis.
Assumed effect and trial assurance
The following calculations concern a hypothetical trial with 12-week FVC change as the primary endpoint. They do not apply directly to longer trials, such as a 52-week evaluation, where variability and sample-size requirements must be reassessed.
Assuming an individual SD of 150 mL, compared with approximately 114–183 mL recovered among observed participants, two-sided \(\alpha=0.05\) and 80% power gives 142 participants per arm for a true +50 mL contrast, 36 for +100 mL and 16 for +150 mL. With 30% missingness, the corresponding allocation calculations are 202, 51 and 23 per arm. These values use the unrounded sample-size calculation before rounding the final allocation.
The true effect is uncertain. I placed a skeptical weakly informative \(N(0,150^2)\) prior on the true contrast and updated it with the aggregate MAR contrast. Bayesian assurance integrates the probability that a trial with \(n\) participants per arm shows a statistically significant improvement over that posterior uncertainty.
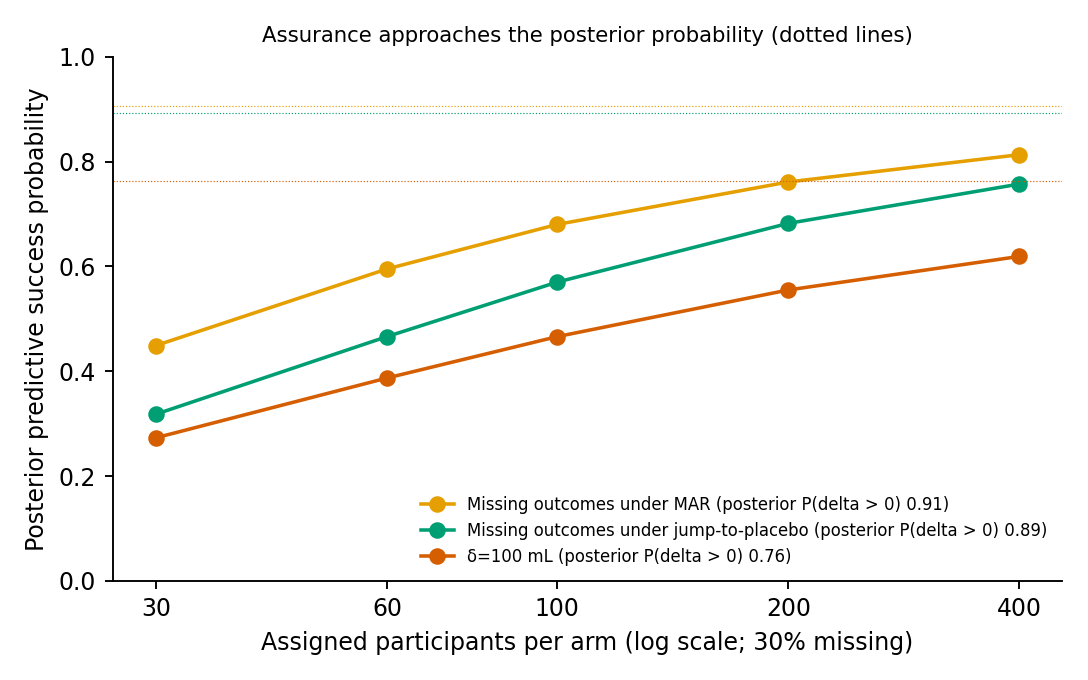
Figure 3. Allocation per arm and Bayesian assurance under the hypothetical 12-week design, not a prediction of long-term trial success.
At 51 allocated participants per arm, the size associated with a fixed +100 mL effect and 30% missingness, assurance is 0.56 under MAR, 0.43 under the placebo-course construction and 0.36 at \(\delta=100\) mL. At 100 participants per arm, the values are 0.68, 0.57 and 0.47. As sample size increases, assurance is bounded by the corresponding posterior positive-effect probabilities, 0.91, 0.89 and 0.76. Additional participants cannot remove existing uncertainty over the direction and magnitude of the true effect before the trial is conducted.
Discussion
The point estimates favor 60 mg QD under the three main missing-data constructions. A worsening of approximately 219 mL relative to MAR among its missing participants is needed to reverse the point estimate. Nevertheless, all corresponding intervals include 0. The headline interval describes within-group change rather than a placebo-adjusted effect.
For a hypothetical 12-week endpoint and a known +100 mL effect, the calculation gives 36 evaluable participants or 51 allocated participants per arm with 30% missingness. After integrating effect uncertainty, assurance at 51 participants is only 0.36–0.56 and at 100 participants is 0.47–0.68. These values cannot be transferred to longer endpoint windows.
Overall efficacy, dose recommendation and benefit–risk are not determined. The paper reported treatment-related adverse events in 78% of the 60 mg QD group versus 29% on placebo. Acute exacerbations numbered three in the 60 mg group, all hospitalized, versus one on placebo without hospitalization. Seven liver-related discontinuations included four participants receiving nintedanib. Among 60 mg QD participants, the supplementary table reported grade 3 or higher adverse events in six of 11 receiving standard antifibrotic therapy, 55%, versus one of seven without it, 14%. Grade describes severity and is not interchangeable with regulatory seriousness. The paper raises possible interactions with standard therapy; this analysis does not investigate them.
Long-term FVC and clinical course remain unassessed. The paper's +187.8 mL finding without concomitant standard therapy is also not analyzed: only seven of 18 participants in the 60 mg QD group were without that therapy, with fewer observed at week 12, and the subgroup was not prespecified. The exploratory observed-case contrast between 60 mg QD and the same total daily dose as 30 mg BID was +79 mL, with an interval of −40–+197. This cannot resolve a schedule effect.
Limitations
The main analysis approximates aggregate values, including recovered standard errors, omitted ANCOVA adjustment details and independence assumptions between arms. It does not reproduce the original multiple imputation.
Values and counts in the original Figure 2 were transcribed from public images. The paper does not explicitly specify the interval formula; source-data checking reproduces the highlighted 60 mg interval with a normal calculation. The same individual-value check was not performed for other groups. Discontinuation timing, detailed reasons and intermediate observations were not used.
The paper identifies 11 of 27 authors as sponsor employees. It reports external trial management, data processing and analysis by Fortrea Clinical Pharmacology Services, while sponsor authors participated in design, collection, analysis and interpretation. I have no conflicts with the paper's authors or related companies.
The planned main calculations were supplemented after review with Welch t intervals and source-data checking of the normal interval. Independent grid-based posterior calculations and trial Monte Carlo simulation checked tipping values of 219.2 mL for a zero point estimate and 90.7 mL for positive area 0.80, and assurance at 30, 51, 100, 200 and 400 allocated participants per arm. Results agreed to two decimal places within simulation error.
Data and code availability
The analysis ZIP contains the plan, transcribed aggregate inputs with sources, code, results and figure code. Run python analysis.py && python figures.py with numpy, scipy and matplotlib; the recorded calculation takes seconds and fixes its random seed. Run python independent_check.py for independent numerical checks.
For the source-data comparison, download Nature Medicine's Springer file 41591_2025_3743_MOESM3_ESM.xlsx, approximately 2 MB, place it at data/raw_tmp/MOESM3.xlsx and run python source_data_check.py.
References
- Xu Z, Ren F, Wang P, Cao J, Tan C, Ma D, et al. A generative AI-discovered TNIK inhibitor for idiopathic pulmonary fibrosis: a randomized phase 2a trial. Nature Medicine. 2025;31(8):2602–2610. doi:10.1038/s41591-025-03743-2.
- Xu Z, Ren F, Wang P, Cao J, Tan C, Ma D, et al. Source Data for Fig. 4 and Supplementary Figs. In: A generative AI-discovered TNIK inhibitor for idiopathic pulmonary fibrosis: a randomized phase 2a trial. Nature Medicine. 2025. File 41591_2025_3743_MOESM3_ESM.xlsx. Source-data access.
- du Bois RM, Weycker D, Albera C, Bradford WZ, Costabel U, Kartashov A, et al. Forced Vital Capacity in Patients with Idiopathic Pulmonary Fibrosis: Test Properties and Minimal Clinically Important Difference. American Journal of Respiratory and Critical Care Medicine. 2011;184(12):1382–1389. doi:10.1164/rccm.201105-0840OC.