How far does a dose-comparison trial support dose selection? Arm-level data for sotorasib 960 mg and 240 mg
Published arm-level data from a randomized dose comparison are used to show the decision regions as the weights on benefit and harm change. The difference in severe toxicity is robust, but differences in response rate and OS are uncertain, and the conclusion depends on how harm is defined. No clinical dose is recommended.
Key findings
- Grade≥3 treatment-related adverse events were 16.0 points more frequent at 960 mg (95% interval +4.2 to +27.8), robust to the prior, data cutoff and correlation.
- The response-rate difference was +7.8 points (−4.3 to +19.8). Weighting one response and one severe toxicity about equally (w ≥ 0.95) favors 240 mg.
- The definition of harm moves the decision most, and the OS HR of 0.75 (0.53 to 1.07) leaves a signal favoring 960 mg. Arm-level public data alone cannot settle the dose.
On this page
Many dose-comparison trials state that they are not powered for hypothesis testing. Their results are still read as evidence for a dose decision. This article uses public data from a randomized comparison of 960 mg and 240 mg of the KRAS G12C inhibitor sotorasib to show which dose is supported as the trade-off weight between benefit and harm changes.
The result first. Grade 3 or higher treatment-related adverse events (TRAEs) were about 16 percentage points more frequent at 960 mg, and this difference was robust to changes in the assumptions. The difference in response rate (about 8 points) had an interval that crossed zero. If one additional response and one additional severe toxicity are weighted about equally, the comparison favors 240 mg; only when severe toxicity is weighted quite lightly does it favor 960 mg. This conclusion, however, changes with what is counted as "harm", and overall survival (OS) retains a signal favoring 960 mg. Arm-level public data alone cannot settle the dose; what this analysis can do is identify what is missing.
Question and context of use
The Question of Interest (QoI) is: "From the arm-level results of CodeBreaK 100 Part B, how confidently can we say that 960 mg provides additional benefit that outweighs its additional harm relative to 240 mg, and how does the answer change with the weight?"
The Context of Use (CoU) is limited to structuring the research question. The analysis shows the regions where the comparison favors 960 mg, favors 240 mg, or is indeterminate for each weight, and identifies the data needed next to move the decision. It is not used for a clinical dose recommendation or to re-evaluate a regulatory decision. Because it is not evidence that decides on its own, model influence is set as low.
Data
The data come from CodeBreaK 100 phase 2 Part B (NCT03600883), an open-label trial in which 209 patients with previously treated KRAS G12C-mutated advanced non-small cell lung cancer were randomized to 960 mg or 240 mg once daily. The primary endpoints were objective response rate by blinded independent central review (BICR) and safety.[1, 2]
The numbers were taken from the sponsor's briefing document released for the October 2023 FDA Oncologic Drugs Advisory Committee (ODAC) and from the abstract of the publication.[1, 2] No patient-level data were used.
| Endpoint | 960 mg | 240 mg | Data cutoff |
|---|---|---|---|
| Response rate (BICR) | 34/104 (32.7%) | 26/105 (24.8%) | 2023-06-23 |
| Grade≥3 TRAE | 37/104 (35.6%) | 20/104 (19.2%) | 2023-01-18 |
| Grade≥3 adverse events (all) | 64/104 (61.5%) | 51/104 (49.0%) | 2023-01-18 |
| Discontinuation due to TRAE | 13/104 (12.5%) | 10/104 (9.6%) | 2023-01-18 |
| Progression-free survival (PFS) HR | 0.95 (0.66, 1.36) | Reference | 2023-01-18 |
| OS HR | 0.75 (0.53, 1.07) | Reference | 2023-06-23 |
Four cautions apply when reading these numbers.
- Efficacy and safety come from different cutoffs. Response rate is from June 2023 and safety from January 2023, so benefit and harm are not compared at the same time point.
- Dose reduction was not allowed in the 240 mg arm. "Adverse events leading to dose reduction or interruption" therefore do not mean the same thing in the two arms and are not used here.[1]
- The exposure difference is much smaller than the dose difference. The sponsor's document reports Cmax and AUC 22% higher at 960 mg, and the publication abstract reports 1.3-fold.[1, 2] The fourfold dose difference does not translate into a fourfold exposure difference.
- Disease burden and exposure are confounded. Patients with more advanced disease were reported to have lower clearance, higher exposure and poorer response.[1] Individual exposure–response cannot be estimated from arm-level summaries.
Methods
For each arm, a uniform Beta(1, 1) prior and a binomial likelihood were placed on each proportion, and 200,000 samples were drawn from the posterior. The two main quantities are the differences:
- Benefit: $\Delta \mathrm{ORR} = p_{960} - p_{240}$
- Harm: $\Delta \mathrm{Tox} = q_{960} - q_{240}$ (Grade≥3 TRAE)
These are combined with a weight $w$:
$$ U(w) = \Delta \mathrm{ORR} - w \cdot \Delta \mathrm{Tox} $$
$w$ expresses how many additional responses are required in exchange for one additional severe toxicity. If $P(U(w) > 0) \ge 0.80$ the comparison favors 960 mg, if $\le 0.20$ it favors 240 mg, and in between it is indeterminate. The 0.80 threshold is conventional, not optimal.
The weights, thresholds and sensitivity conditions were fixed in an analysis plan before the differences and probabilities were computed. The sensitivity analyses varied the prior, the response-rate cutoff, the definition of harm, the within-arm correlation between response and toxicity, and the threshold. Because the joint distribution of response and toxicity in the same patients is not public, the correlation was treated as an assumption of ±0.3.
PFS and OS have short follow-up and no power, so they are not included in $U(w)$; the reported HRs are shown as context.
Results
The severe-toxicity difference is clear; the response-rate difference is uncertain
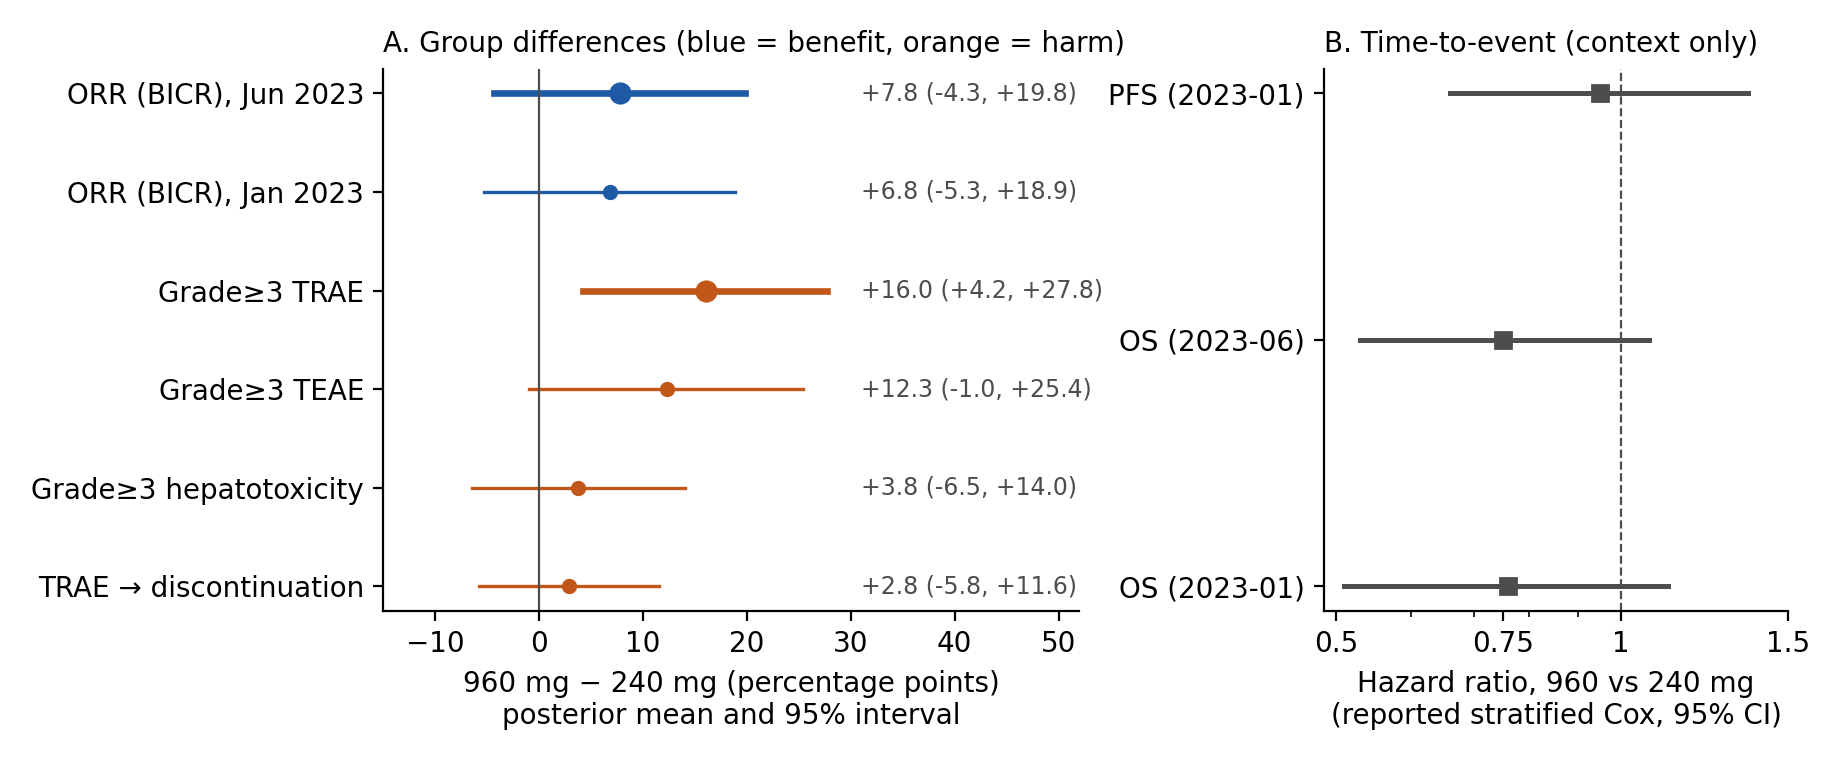
Figure 1: The difference in response rate was +7.8 points (95% interval −4.3 to +19.8), and the difference in Grade≥3 TRAE was +16.0 points (+4.2 to +27.8). The posterior intervals were close to frequentist Newcombe intervals. For Grade≥3 adverse events overall, hepatotoxicity and discontinuation, the intervals all crossed zero. The hazard ratios on the right are redrawn from reported values and were not estimated in this article.
As a ratio of observed values, 960 mg yields about 0.5 additional responses for each additional Grade≥3 TRAE.
How the decision changes with the weight
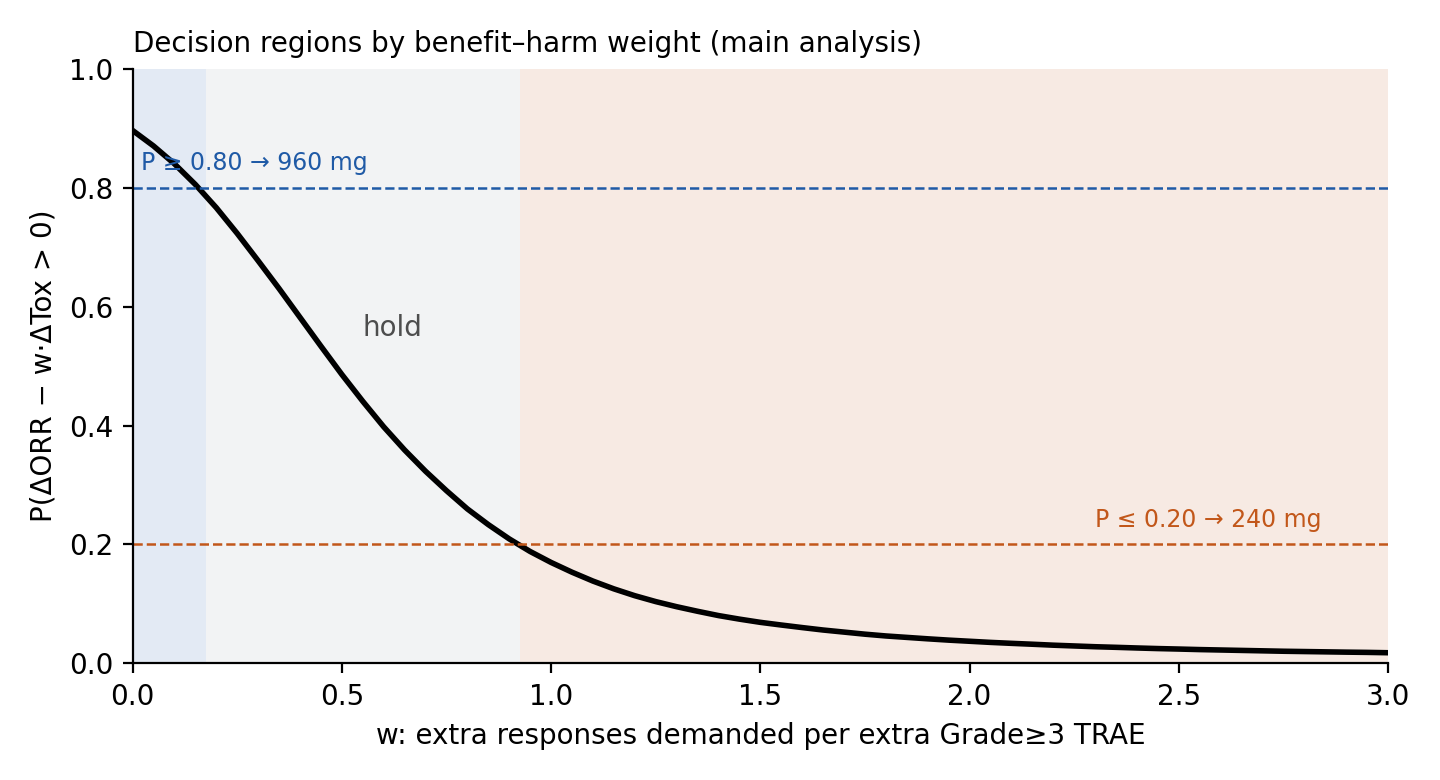
Figure 2: In the main analysis the decision was:
- $w < 0.20$: favors 960 mg (accepting one additional severe toxicity for fewer than 0.2 additional responses)
- $0.20 \le w < 0.95$: indeterminate
- $w \ge 0.95$: favors 240 mg (weighting one response and one severe toxicity about equally)
The definition of harm moves the conclusion most
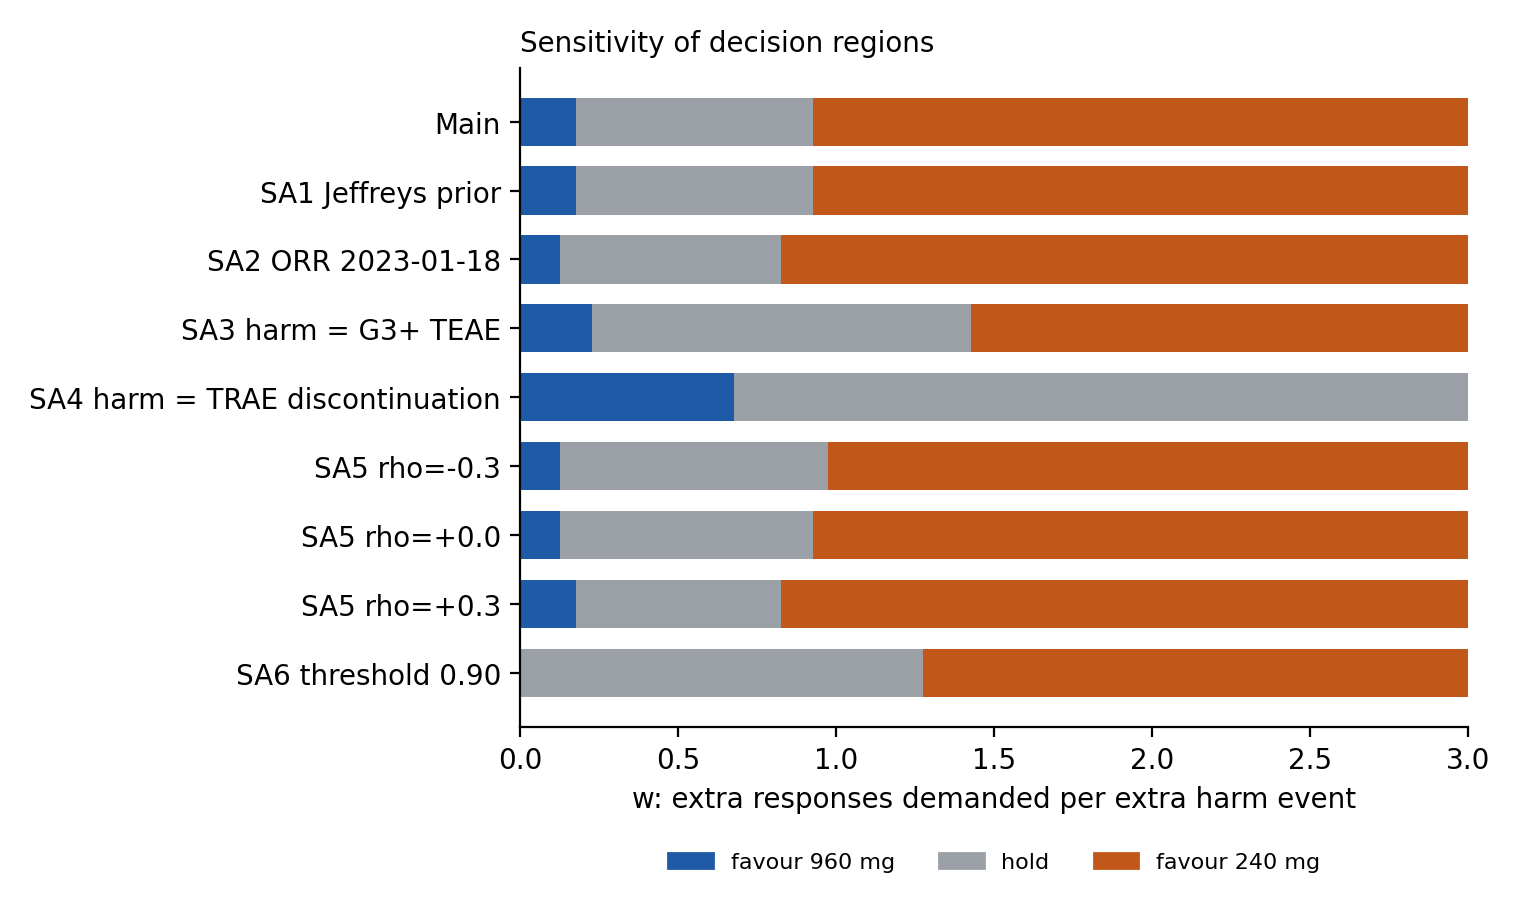
Figure 3: Changing the prior, the response-rate cutoff or the within-arm correlation moved the boundaries by only about 0.1. In contrast, replacing harm with all Grade≥3 adverse events moved the boundary for favoring 240 mg to 1.45, and replacing it with discontinuation due to TRAE removed the region favoring 240 mg altogether. Tightening the threshold to 0.90 removed the region favoring 960 mg.
The definition of harm involves a value judgment about which toxicities matter most to patients and to continuing treatment. Because the data cannot choose a single definition, the results are shown side by side for each definition.
Survival retains a signal favoring 960 mg
The OS HR was 0.75 (95% CI 0.53 to 1.07). Read with a normal approximation on the log scale, the probability that the HR is below 1 is about 0.95, and the probability that it is below 0.8 is about 0.64. The PFS HR was 0.95, with no clear direction.
This OS signal is not part of $U(w)$. If the OS difference is real, judging in favor of 240 mg from the trade-off between response rate and severe toxicity alone would be premature. Conversely, confirming the observed HR of 0.75 with 80% power would require about 380 events, roughly three times the 129 events at the reported cutoff.
What can and cannot be decided
What can be decided: 960 mg clearly increases Grade≥3 TRAEs. The response-rate difference favors 960 mg but is uncertain, and unless severe toxicity is weighted very lightly, the trade-off between response and severe toxicity alone does not support 960 mg.
What cannot be decided: non-inferiority of 240 mg; a conclusion that does not depend on the definition of harm; whether there is an OS difference; individual exposure–response; the dose that should be used clinically.
Data needed to move the decision:
- Additional OS follow-up (on the order of 380 events)
- The joint occurrence of response and toxicity in the same patients
- Actual dose intensity after reductions and interruptions
- Exposure–response adjusted for disease burden
- Patient-reported tolerability
Descriptive results from a dose-comparison trial can be read either as "either dose is fine" or as "the higher dose is needed". Making the weight and the definition of harm explicit and drawing the decision regions separates the part the data answer from the part that must be left to value judgment or further data.
Reproducing the analysis
The analysis code, the input table of arm-level numbers and the result tables are included in the distribution files. They run with Python 3.12, numpy, scipy, pandas and matplotlib. python test_analysis.py runs nine checks, python analysis.py produces the result tables, and python figures.py regenerates the figures. The random seed is fixed. The original PDFs are not redistributed; only the source URLs and the extracted number tables are included.
References
- Amgen Inc. Sotorasib. Background Information for the Oncologic Drugs Advisory Committee, 05 October 2023 (FDA public document). https://www.fda.gov/media/172698/download (Section 5.2, Table 20, Section 6.2, Table 29, Section 7.2)
- Hochmair MJ, et al. Sotorasib (960 mg or 240 mg) once daily in patients with previously treated KRAS G12C-mutated advanced NSCLC. Eur J Cancer. 2024;208:114204. doi:10.1016/j.ejca.2024.114204
- U.S. FDA. FDA Briefing Document, Oncologic Drugs Advisory Committee Meeting, October 5, 2023, NDA 214665 s005. https://www.fda.gov/media/172696/download (postmarketing requirement for dose comparison)
- Newcombe RG. Interval estimation for the difference between independent proportions: comparison of eleven methods. Stat Med. 1998;17:873–890.
- Schoenfeld DA. Sample-size formula for the proportional-hazards regression model. Biometrics. 1983;39:499–503.