Is another dose comparison informative? A benefit–risk analysis of ifinatamab deruxtecan
Public randomized B7-H3 ADC dose-cohort counts used to quantify conditional information value, decision uncertainty and sensitivity to unreported joint outcomes and follow-up.
Key findings
- From public randomized-cohort counts in IDeate-Lung01, 12 vs 8 mg/kg raised response by 27.4 points (95% credible interval +7.9 to +46.0), while the severe-adverse-event difference (+6.2, −14.0 to +26.3) remained uncertain.
- Another 50 participants per arm had an expected information value of 0.074 response-equivalent units per 100 future decision subjects at harm weight 1, rising to 1.62 and 11.02 at weights 2 and 4.
- Unreported joint response–harm outcomes and follow-up assumptions changed the value materially; patient-linked outcomes and an explicit preference definition may matter more than a larger repeat comparison.
On this page
- Summary
- The development question
- Which observations belong in the comparison?
- A decision criterion that can be inspected
- What is already clear, and what remains uncertain?
- What would another trial buy?
- Which assumptions could change the judgment?
- The resulting research judgment
- Limits and reproducibility
- References
Summary
A dose-comparison study can leave uncertainty without making another study worthwhile. The relevant question is whether new observations are likely to change a decision, and how costly the remaining mistakes would be under a stated decision criterion.
Using public randomized-cohort counts from IDeate-Lung01, I compared 8 and 12 mg/kg through a simple Bayesian response–harm model. The estimated response difference was clearer than the severe-adverse-event difference. At a hypothetical harm weight of one, another 50 participants per arm had an expected information value of only 0.074 response-equivalent units per 100 future decision subjects. At weights two and four, that value was 1.62 and 11.02, respectively. These are conditional research calculations, not observed clinical benefits or financial returns. Unreported joint outcomes and follow-up assumptions changed the value materially.
日本語要約
IDeate-Lung01のランダム化用量群の公開集約値から、追加の8/12 mg/kg比較がどの条件で判断を改善し得るかを調べた。奏効率の差より重症有害事象の差が不確かであり、追加試験の情報価値は便益と害の重み、両者の患者内の対応、未観測の遅発性の害の仮定に依存した。試験費用・判断対象集団・生存便益を含まないため、追加試験への投資や臨床用量をこの計算だけで決めることはできない。
The development question
The question is when a further randomized dose comparison would change a response-versus-harm judgment enough to deserve consideration. It is deliberately narrower than reconstructing an entire dose-selection submission.
The context of use is research prioritization. The model helps distinguish a trade-off that is already resolved under a particular preference from one that could benefit from more evidence. Its influence should remain low: it does not recommend treatment, select a dose for another B7-H3 ADC, or replace exposure–response and survival evidence. Misusing it for those purposes could trade away important benefits or overlook serious harm.
Which observations belong in the comparison?
The analysis uses the treated randomized Part 1 cohorts only, at the common interim cutoff of 25 April 2024. The later report also contains a nonrandomized 12-mg/kg extension, which is excluded. The audited numerical inputs are:
| Endpoint | 8 mg/kg | 12 mg/kg |
|---|---|---|
| Treated randomized participants | 46 | 42 |
| Confirmed BICR response | 12 | 23 |
| All-cause Grade ≥3 TEAE | 20 | 21 |
| AE-associated treatment discontinuation | 3 | 7 |
| Adjudicated treatment-related ILD/pneumonitis | 4 | 5 |
The public interim report supplies the same-snapshot efficacy and safety figures. Severe-event and discontinuation counts are the unique integers consistent with the reported one-decimal percentages and denominators; they are reconstructed aggregate counts. Response and ILD totals are explicit. These are affected participants, not counts of independent recurrent events.
The primary paper and its supplementary appendix were separately audited. Their response totals agree, but their later high-dose safety table pools randomized and extension participants. It cannot be substituted for the high arm here. The treated-randomized estimand also does not automatically equal a full randomized intention-to-treat estimand.
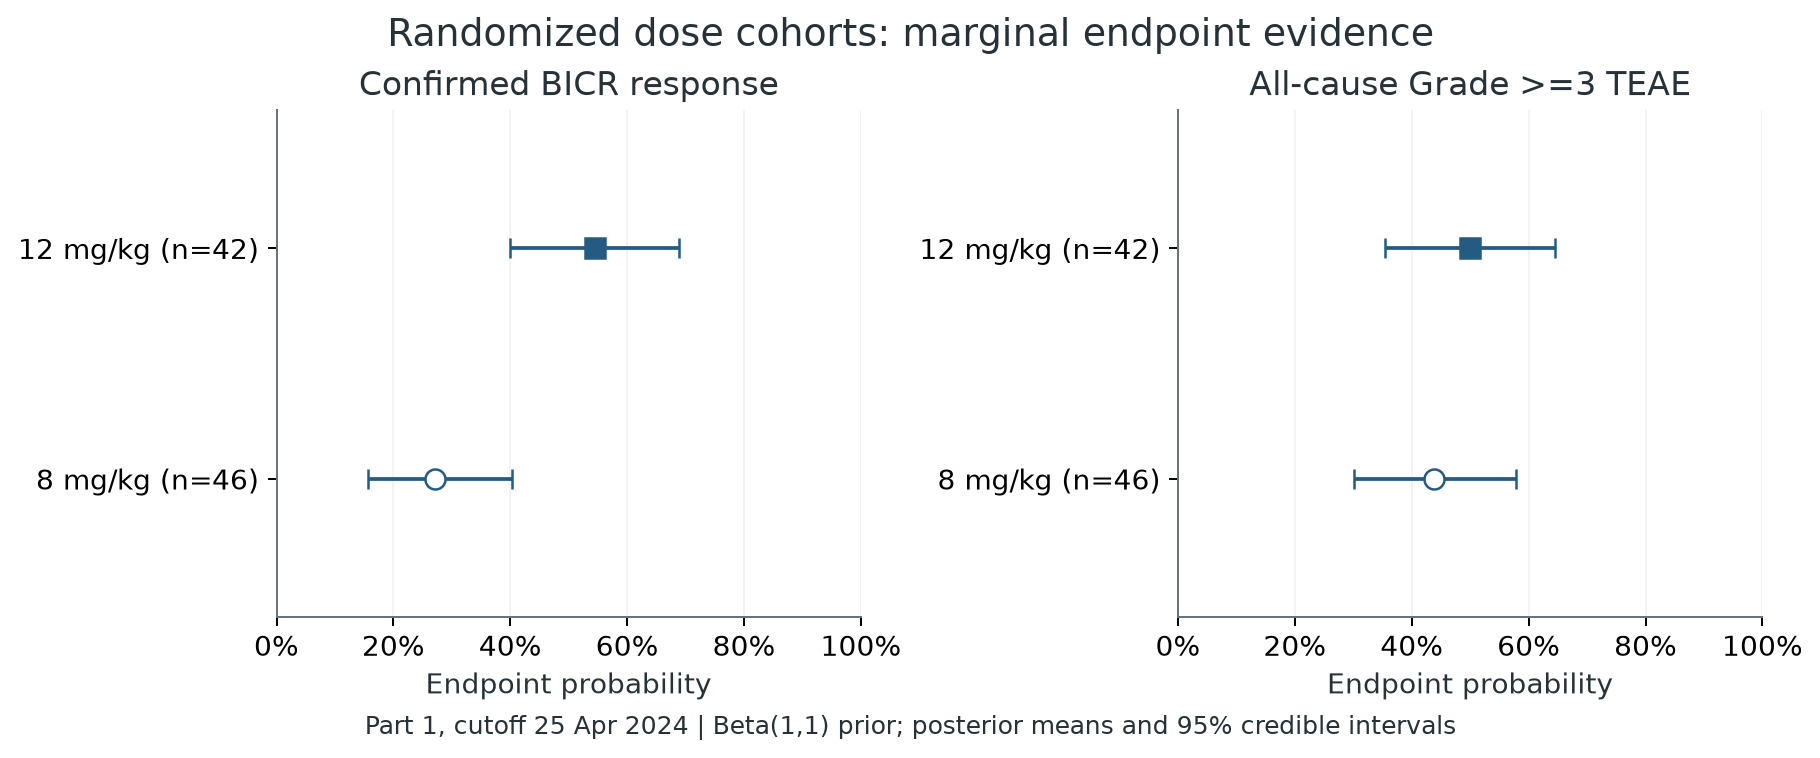
Figure 1. Original calculations from the audited Part 1 counts. Dots and squares show posterior means; bars show 95% equal-tail credible intervals under Beta(1,1) priors. Every interval refers to a marginal endpoint.
A decision criterion that can be inspected
Let \(p_d\) be the response probability and \(q_d\) the probability of at least one severe TEAE in the observed treatment/follow-up process for dose \(d\). Define
\[ U_d(w)=p_d-wq_d,\qquad \Delta U(w)=U_{12}(w)-U_8(w). \]
The weight \(w\) specifies a hypothetical response-equivalent penalty for an additional severe-TEAE participant. A weight of one values an additional response and an additional severe-TEAE participant equally in this scalar criterion. It is not an elicited patient preference, a QALY weight, or a valuation of death.
For each endpoint and arm, a binomial likelihood with Beta(1,1) prior gives
\[ p\mid x,n\sim \operatorname{Beta}(x+1,n-x+1). \]
The primary calculation treats the four marginal parameters as independent. Expected linear utility depends only on the margins, but uncertainty about utility and the value of future data depend on the joint model. Independence is therefore an assumption with consequences, not something established by the published tables.
I kept two questions separate:
- Which action maximizes expected utility? This forced binary rule chooses 12 mg/kg if \(E[\Delta U]>0\), otherwise 8 mg/kg. It defines the information-value calculation.
- How well resolved is that comparison? A descriptive rule labels a probability of at least 0.80 as high-dose leaning, at most 0.20 as low-dose leaning, and the middle as uncertain. A 0.90/0.10 rule is also reported. Neither rule is a clinical threshold.
An uncertain descriptive conclusion is not a third action in the EVSI calculation. Introducing a formal defer action would require a specified cost and subsequent evidence strategy.
What is already clear, and what remains uncertain?
The posterior response difference was +27.4 percentage points, with a 95% credible interval of +7.9 to +46.0. The severe-TEAE difference was +6.2 points, with an interval of −14.0 to +26.3. These are new model-based estimates, not trial-reported confidence intervals.
| Hypothetical weight | Mean ΔU | 95% credible interval | P(ΔU > 0) | Descriptive 0.80 rule |
|---|---|---|---|---|
| 0 | 0.275 | 0.079 to 0.460 | 0.997 | 12 mg/kg leaning |
| 1 | 0.212 | −0.066 to 0.487 | 0.932 | 12 mg/kg leaning |
| 2 | 0.150 | −0.293 to 0.597 | 0.743 | Uncertain |
| 4 | 0.025 | −0.798 to 0.856 | 0.523 | Uncertain |
The expected-utility choice remains 12 mg/kg until approximately \(w=4.39\), but this crossing is not a clinical cutoff. Around weight four, the mean advantage is close to zero and both directions remain plausible. A positive mean should not be presented as a confident superiority result.
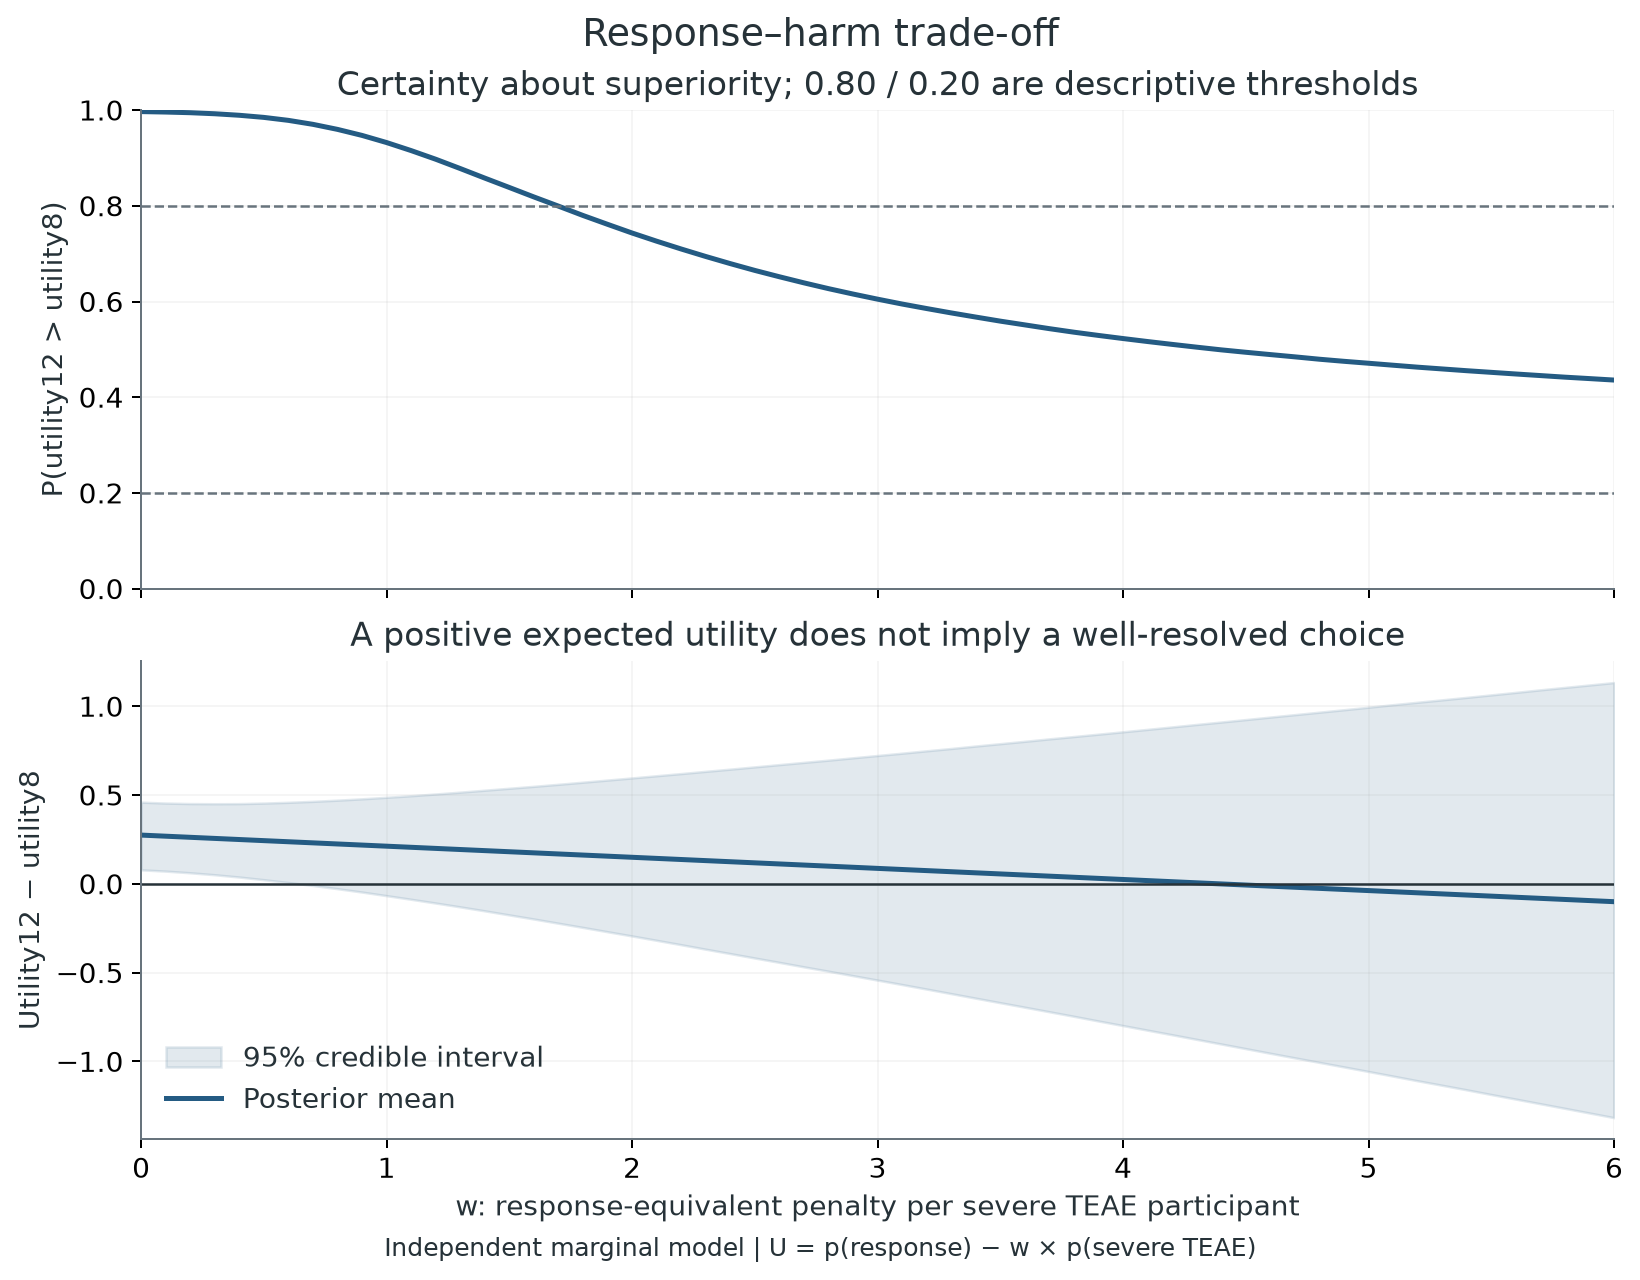
Figure 2. The upper panel shows superiority probability and the descriptive certainty thresholds. The lower panel shows mean utility differences and credible intervals. The primary model assumes independent endpoint parameters; the weight is hypothetical.
What would another trial buy?
Expected value of perfect information (EVPI) is the expected loss from the current best action relative to an oracle that knows the endpoint probabilities. It sets an upper bound on the value of learning them. Expected value of sample information (EVSI) evaluates a specified, imperfect additional study:
\[ \operatorname{EVSI}(n,w) =E_Y\left[\max_d E\{U_d(w)\mid D,Y\}\right] -\max_d E\{U_d(w)\mid D\}. \]
Here \(D\) is the existing aggregate evidence and \(Y\) contains hypothetical new counts from \(n\) additional participants per arm. New participants are assumed exchangeable with the existing Part 1 population, with the same outcome-ascertainment process. Under endpoint independence the four predictive count distributions are beta-binomial. Conjugacy gives posterior means directly, so EVSI can be evaluated by discrete probability summation without a noisy inner estimation loop. This uses the decision-theoretic definition discussed by Strong et al.; their regression approximation is not needed for this small conjugate model.
| Weight | EVPI | EVSI: +50/arm | EVSI: +100/arm |
|---|---|---|---|
| 0 | 0.010 | <0.001 | 0.001 |
| 1 | 0.425 | 0.074 | 0.170 |
| 2 | 3.492 | 1.618 | 2.290 |
| 4 | 15.693 | 11.021 | 12.801 |
All entries are response-equivalent units per 100 future decision subjects, conditional on the stated utility and model. They are not additional responses expected among study participants. EVPI is Monte Carlo estimated; EVSI is exact under the discrete model, up to floating-point arithmetic.
At weight one the choice is already relatively resolved. Even learning all four probabilities perfectly would remove little expected loss. At weight four, current decision uncertainty is much more consequential under that preference, so an additional comparison has a larger conditional value. More participants improve the model's information, but they do not establish which preference is appropriate.
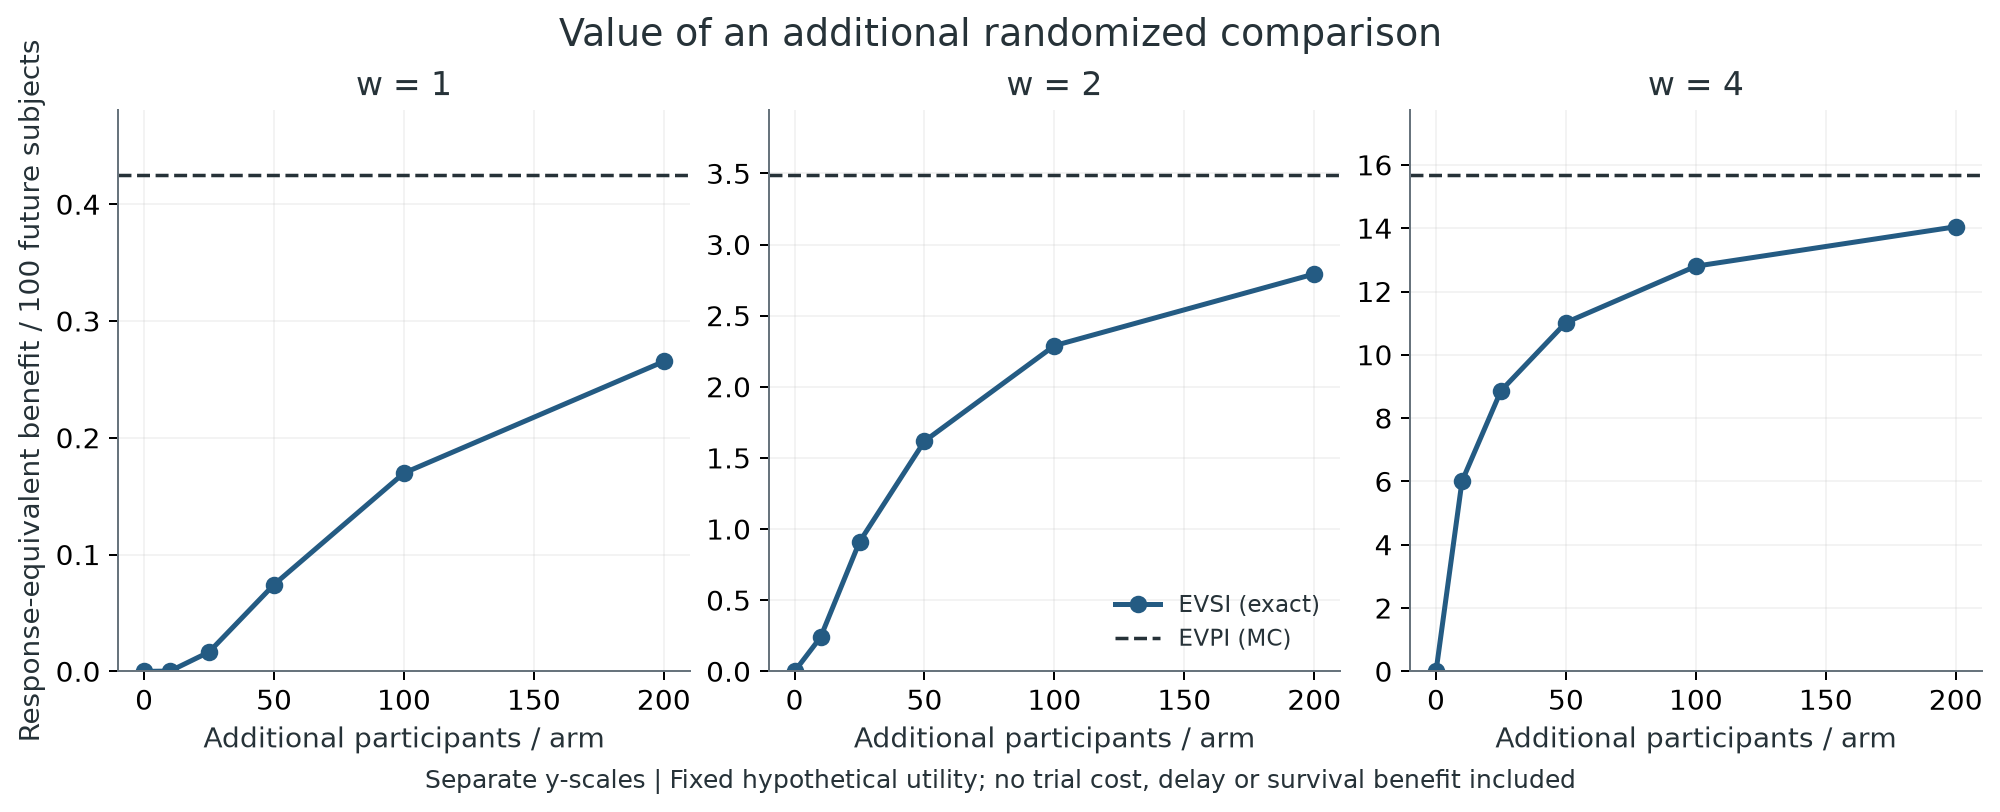
Figure 3. Exact EVSI for added participants per arm, with Monte Carlo EVPI as a dashed reference. Panels use explicitly different y-scales. Research cost, delay, participant burden, and survival benefit are excluded.
For an independent check, I simulated 60,000 future trials per design. At weight two, posterior-predictive oracle-discordant choices occurred in about 25.7% without new observations, 18.4% with +50/arm, and 14.8% with +100/arm. This is a model-conditional chance of choosing the lower-utility action, not a frequentist type-I error, clinical error rate, or prediction of an actual future trial. Expected regret and Monte Carlo standard errors are provided in the companion results.
Which assumptions could change the judgment?
Joint response and harm outcomes
The public margins do not reveal whether responders were the same participants who experienced severe TEAEs. I constructed three compatible joint tables in each arm: minimum overlap, overlap nearest marginal independence, and maximum overlap. Each was assigned a Dirichlet prior of 0.5 per cell. The marginal posteriors remain the primary Beta(1,1)-updated distributions, isolating the joint assumption's effect.
At weight two and +50/arm, estimated EVSI per 100 future subjects was 2.77, 1.62, and 0.32, respectively. The corresponding Monte Carlo standard errors were 0.028, 0.019, and 0.006. These errors measure simulation precision within an assumed table; they do not quantify uncertainty about the unknown table. The extrema are identification stress tests, not estimates of clinical dependence.
Prior, endpoint, evaluability, and timing
At weight two and +50/arm:
| Change from primary model | EVSI / 100 future subjects | Meaning |
|---|---|---|
| Primary severe-TEAE model | 1.62 | Marginal independence |
| Jeffreys prior | 1.63 | Prior sensitivity |
| Symmetric Beta(4,4) prior | 1.57 | Stronger regularization |
| AE-associated discontinuation as harm | 2.02 | Different criterion; not the same weight interpretation |
| All-grade adjudicated ILD as harm | 0.23 | Inadequate as a standalone severity valuation |
| 20% independent future evaluability loss | 1.39 | 40 informative participants/arm instead of 50 |
| 40% independent future evaluability loss | 1.09 | 30 informative participants/arm instead of 50 |
| Fixed hypothetical late-harm penalty +5 points at high dose | 4.39 | Additional utility penalty; not fitted incidence |
| Fixed hypothetical late-harm penalty +10 points at high dose | 4.36 | Additional utility penalty; not fitted incidence |
The late-harm scenarios move the comparison nearer a decision boundary and increase conditional information value. In the +10-point scenario, the current expected-utility choice at weight two switches to the low dose. The extra penalty is held known and fixed: the hypothetical added study learns the observed response/severe-event margins, not that missing late-harm term. Its uncertainty would require another model and data.
The same calendar cutoff does not produce a common toxicity horizon. Interim median follow-up was 14.6 and 15.3 months, and median treatment duration 3.5 and 4.7 months. Later low-dose severe-TEAE counts increased, while comparable later high-dose randomized safety was not separately available in the audited table. Neither a median nor a pooled proportion can recover the missing event-time process. Interim evidence; primary report and supplement.
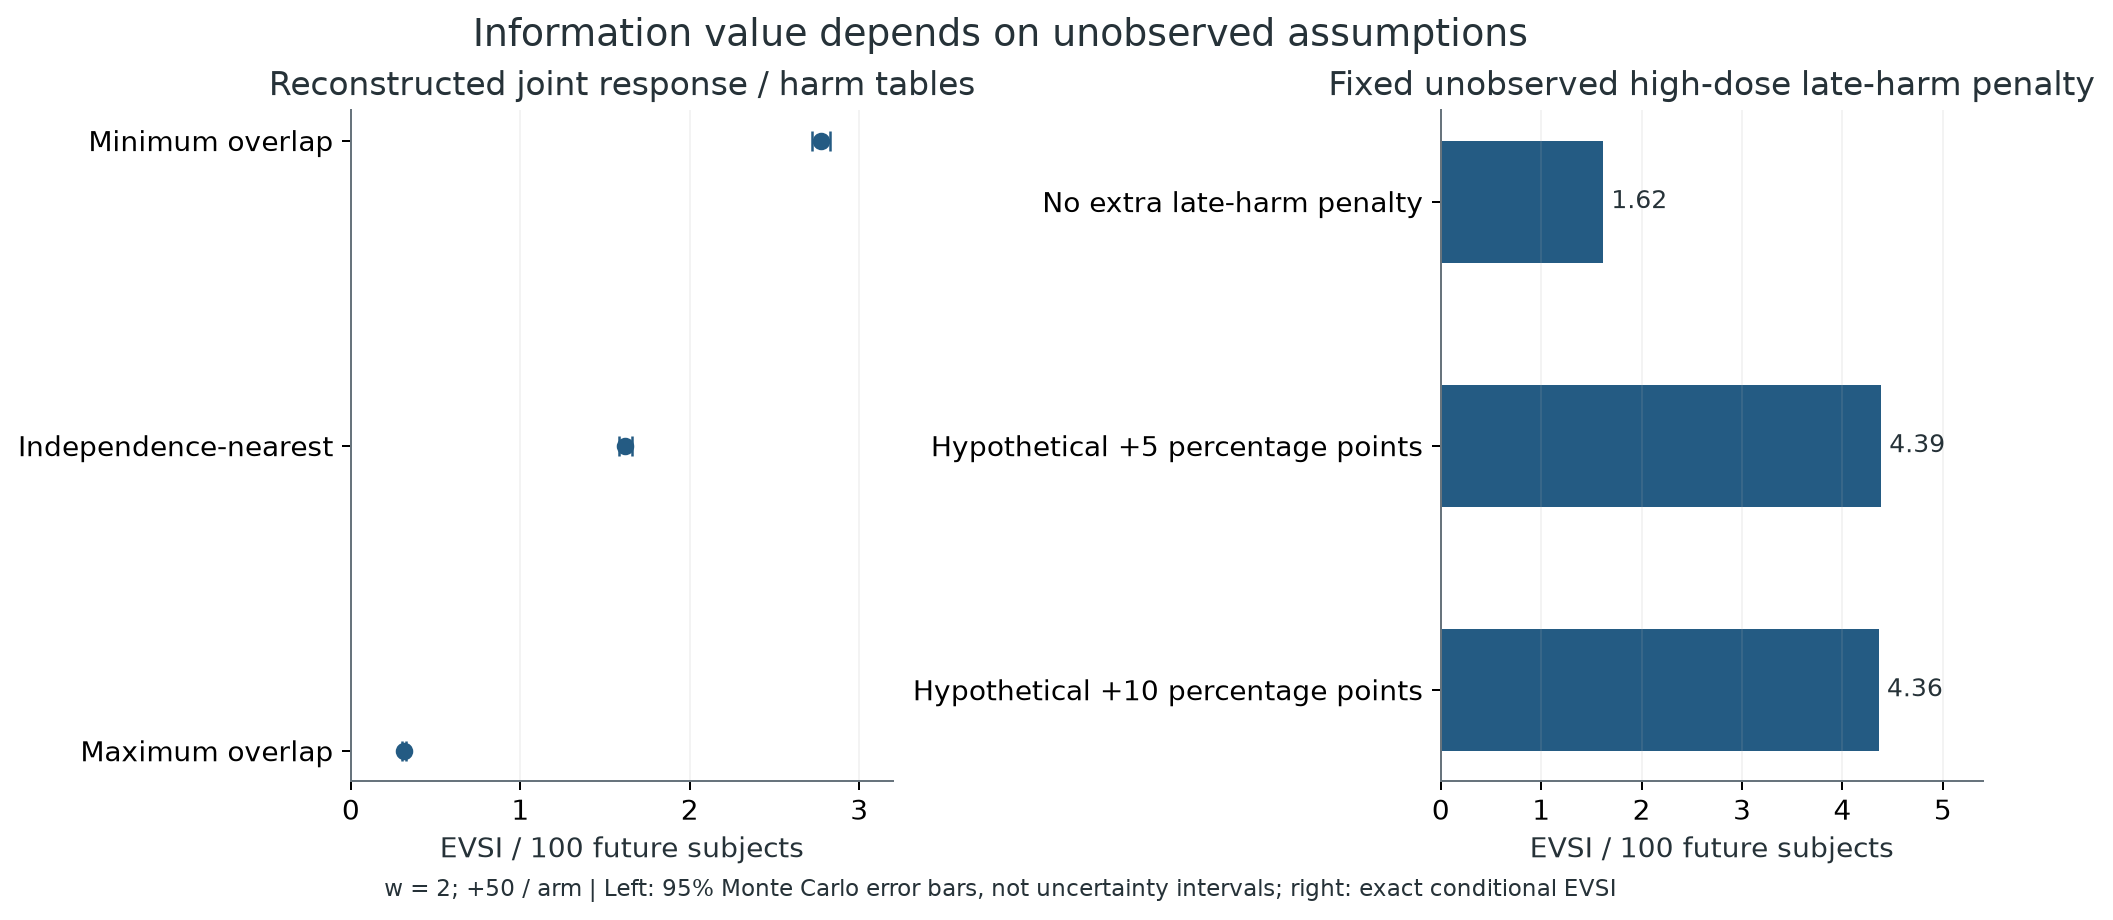
Figure 4. Both panels condition on weight two and +50/arm. Left error bars show 95% Monte Carlo precision intervals. Right values are exact conditional calculations for a fixed hypothetical extra harm penalty. Neither panel estimates the unreported assumptions.
An additional response-classification stress assigns the unlisted BOR residual to responders in one arm only. It changes EVSI at weight two and +50/arm from 1.62 to 3.82 when assigned to the low arm and 0.94 when assigned to the high arm. These are counterfactual recodings, not imputed observed responses or a correction to the reported ORR.
The resulting research judgment
Under a response-focused preference such as weight one, more of the same binary data has little value for this criterion. A larger repeat comparison should not be justified merely because the severe-event interval is wide.
Under a preference closer to the unresolved trade-off, additional randomized evidence could reduce expected loss. Before prioritizing a larger study, however, obtaining patient-linked response/harm outcomes, event timing, adequate long-term ascertainment, and an explicit preference definition may be more useful than increasing the sample size while retaining the same aggregate uncertainty. The present analysis does not quantify the value of collecting those specific missing variables, so that ordering is a methodological recommendation rather than an estimated optimum.
To convert information value into an investment judgment, one would need a target population size \(H\) and study, delay, and opportunity costs \(C\) in compatible units. The conditional expression \(H\times\mathrm{EVSI}>C\) does not supply those inputs. No optimal trial size or monetary return is established here. Nor does a forced binary action in the calculation establish that another dose-comparison trial is ethically or operationally appropriate.
Limits and reproducibility
This study uses public aggregate counts. It cannot fit individual PK, exposure–response, survival, recurrent toxicity, or dropout mechanisms. ORR does not measure durable or survival benefit, and Grade ≥3 TEAE combines heterogeneous severities. Fatal and nonfatal ILD must not be collapsed into an inferred clinical equivalence. Different harm definitions alter the criterion; they do not constitute validation of one another. Transporting these probabilities to a new population, or to another B7-H3 ADC, is unqualified.
The companion includes audited counts, source locations and hashes, original code, aggregate outputs, original figures, and an executed Notebook. Publisher documents and private planning materials are excluded. Ten verification tests check count reconstruction, no-data EVSI, exact small-design enumeration, predictive expectations, monotonicity, perfect-information bounds, joint-table feasibility, and agreement with independent numerical integration and simulated trials. Reproducibility verifies the calculation; it does not remove its clinical limitations.
References
- Rudin CM, et al. Ifinatamab Deruxtecan in Patients With Extensive-Stage Small Cell Lung Cancer: Primary Analysis of the Phase II IDeate-Lung01 Trial. J Clin Oncol. 2026;44:261–273. doi:10.1200/JCO-25-02142. Supplementary appendix available with the open-access record.
- Rudin CM, et al. OA04.03: interim analysis of IDeate-Lung01. J Thorac Oncol. 2024;19:S15–S16. doi:10.1016/j.jtho.2024.09.033. Same-cutoff counts were extracted from the public primary interim release; the publisher abstract was not downloaded.
- Strong M, Oakley JE, Brennan A, Breeze P. Estimating the Expected Value of Sample Information Using the Probabilistic Sensitivity Analysis Sample: A Fast, Nonparametric Regression-Based Method. Med Decis Making. 2015;35:570–583. doi:10.1177/0272989X15575286.
Download original code, aggregate results and executed notebook
Cite this article
Kumakura, D. (2026). Is another dose comparison informative? A benefit–risk analysis of ifinatamab deruxtecan. daikikumakura.github.io. https://daikikumakura.github.io/writing/b7h3-adc-dose-information.html