GEMS: selecting cellular contexts for GWAS variants
A GEMS denominator audit separates annotation concentration from candidate coverage and from validation of a cellular experimental system.
On this page
A disease-associated variant and a sequence model predicting an effect still leave a practical question: which cells should be used to test it? A gene name alone does not identify the cellular state in which its response matters. That choice also precedes a virtual perturbation.
GEMS, released as a preprint on October 16, 2026, links candidate variants from genome-wide association studies (GWAS) to potentially relevant cells and tissues (1). I examine its contribution to choosing experimental systems rather than treating it as a device that identifies a therapeutic target at once. The fraction receiving a cell annotation can overstate the strength of that evidence. I read the main text of bioRxiv version 1 (Results, Discussion, Methods) and Table 2; the supplementary tables and figures were not read. Original-paper numbers below come from that text and table.
Reinterpreting sequence predictions through disease association
GEMS uses Borzoi (2) predictions of ATAC-seq (chromatin accessibility) and RNA-seq (gene expression) signals. Features are z-standardized absolute log2 fold changes between reference and alternate sequences. A trait-specific random forest (3) distinguishes fine-mapped candidates (fine-mapping with SuSiE (4)) with posterior inclusion probability, PIP, above 0.1 from control variants with PIP below 0.01, five per candidate, sampled within ±500 kb on the same chromosome (1). Because signs are discarded before classification, feature contributions do not identify expression increases or decreases. PIP itself depends on fine-mapping assumptions; exceeding 0.1 does not establish causality.
The discriminative power of this classifier is modest. Across the four traits and three input types (ATAC, RNA, both), the median AUROC was 0.63 (range 0.58–0.68), and AUPRC relative to the random baseline ranged from 1.2 (T2D) to 1.6 (MS) (1). The authors themselves note that Borzoi outputs are highly correlated across cell types and that the signal separating candidates from controls is small (1). The later “assignments” derive from the feature contributions of this weak classifier.
The traits are asthma, LDL cholesterol, multiple sclerosis (MS), and type 2 diabetes (T2D). After quality control there are 111 ATAC and 160 RNA tracks. Separate models use ATAC, RNA, or both (1). The 111 ATAC features correspond to cell types of the single-nucleus ATAC-seq atlas CATlas (5). Some RNA tracks represent bulk tissues, so “cell-type prediction” encompasses different resolutions.
SHAP (Shapley-value-based feature attribution (6, 7)) quantifies feature contributions. One hundred repeated models are compared with label-permuted null models, retaining variant-specific associations with Benjamini–Hochberg-adjusted p-values (FDR-adjusted p-values) below 0.05 (8) within each variant (1). This identifies the cell or tissue prediction features used by a model to distinguish candidates, not experimentally measured effects of cell-specific genetic interventions. “Associated with at least one cell type” means that at least one of the 111 or 160 features passed the threshold; it is not a probability that the assigned cell is correct.
The paper also tests enrichment of ATAC variant–cell-type associations in independent experimental cis-regulatory elements (cREs) (1). For seven tests (the most frequently assigned cell type per trait, plus microglia for MS), it asks whether variants assigned to that cell type overlap cREs more often than the remaining candidates, using a one-sided Fisher’s exact test (9). Odds ratios ranged from 3.7 to 28.7, and two tests (CD4+ T-cell and memory B-cell caQTL peak sets, each about 36,000 peaks) did not reach nominal significance. Among tests that were significant, enrichment persists after removing variants overlapping training-source ATAC peaks (odds ratios 2.7–10.1), supporting information beyond lookup of existing peaks. The comparison background, however, is the remaining candidate variants; in the parts I read I did not find a comparison with a mismatched-cell-type cRE set or with control variants. Variants with strong predicted effects might lie in generally open regions, which alone could generate enrichment. Regional enrichment also differs from identifying the causal cellular context of each variant.
The model-evaluation scope also matters. Methods describes five-fold cross-validation and selection of the final model by informativity score from configurations in the top 37.5% of held-out accuracy. Those held-out scores therefore participate in configuration selection; the description does not establish a wholly unused external evaluation after selection. Because nearby variants supply controls, the inspected Methods also do not establish an evaluation separated by linkage-disequilibrium region (1).
Correlated cell-type tracks can share predictive information. SHAP assignments explain the fitted model rather than experimentally distinguishing one of several similar cell types. One hundred random-seed replicates likewise do not add one hundred independent GWAS cohorts or functional experiments.
The denominator behind 78%
The abstract reports median candidate-annotation fractions across four traits of 58.7% for ATAC and 65.9% for RNA in single-modality analyses (1). For comparison, the same paper reports that 26% of candidates overlap a CATlas peak (1). Multiplying or subtracting the two medians cannot establish agreement on the same variants. Variant overlap is unknown, and original Table 2 (1, Table 2), transcribed below, concerns a separately trained multimodal model.
Table 1. Candidate variants and denominators for the most frequent multimodal cell combination.
| Trait | All candidates N | Significant associations in both modalities B | Largest combination K | K / B | K / N |
|---|---|---|---|---|---|
| Asthma | 547 | 167 | 100 | 59.9% | 18.3% |
| LDL | 985 | 191 | 149 | 78.0% | 15.1% |
| MS | 273 | 80 | 50 | 62.5% | 18.3% |
| T2D | 497 | 10 | 3 | 30.0% | 0.6% |
B counts variants with at least one significant association in each modality, excluding RNA mononuclear-cell features as specified in the original table. This alone does not mean both modalities indicate the same biological cells. K is the largest shared-variant count among RNA-tissue/ATAC-cell-type combinations. Variants are not necessarily assigned uniquely.
For LDL, the leading combination is liver RNA and hepatocyte ATAC: 149/191=78.0% among dual-associated variants, but 149/985=15.1% among all candidates.
\[ \frac{K}{N}=\frac{B}{N}\times\frac{K}{B} \]
Here 19.4% × 78.0% = 15.1%. Concentration within the selected subset and coverage of all candidates answer different questions. The latter is neither accuracy nor a success probability: it describes the fraction of the reported candidate set captured by the most frequent combination.
A further caution applies to 78.0%. Original Table 2 also lists the expected number of shared variants if ATAC and RNA associations were assigned independently. For LDL the expectation is 87.0 variants against 149 observed, a fold of 1.71. Dividing the expectation by the observed B=191 gives 87.0/191=45.5%. This merely rescales an expected overlap count by an observed denominator; it is not the expected conditional K/B under independent reassignment. Reassignment can also change B, the number receiving at least one association in each modality. Asthma has 45.8 expected against 100 observed (fold 2.18), and MS has 17.7 expected against 50 observed (fold 2.82) (1, Table 2). In three traits the observed counts exceed expectation, with folds of 1.71 to 2.82. The size of the excess should be read through the fold, however; comparing K/B alone as a measure of concentration is not appropriate.
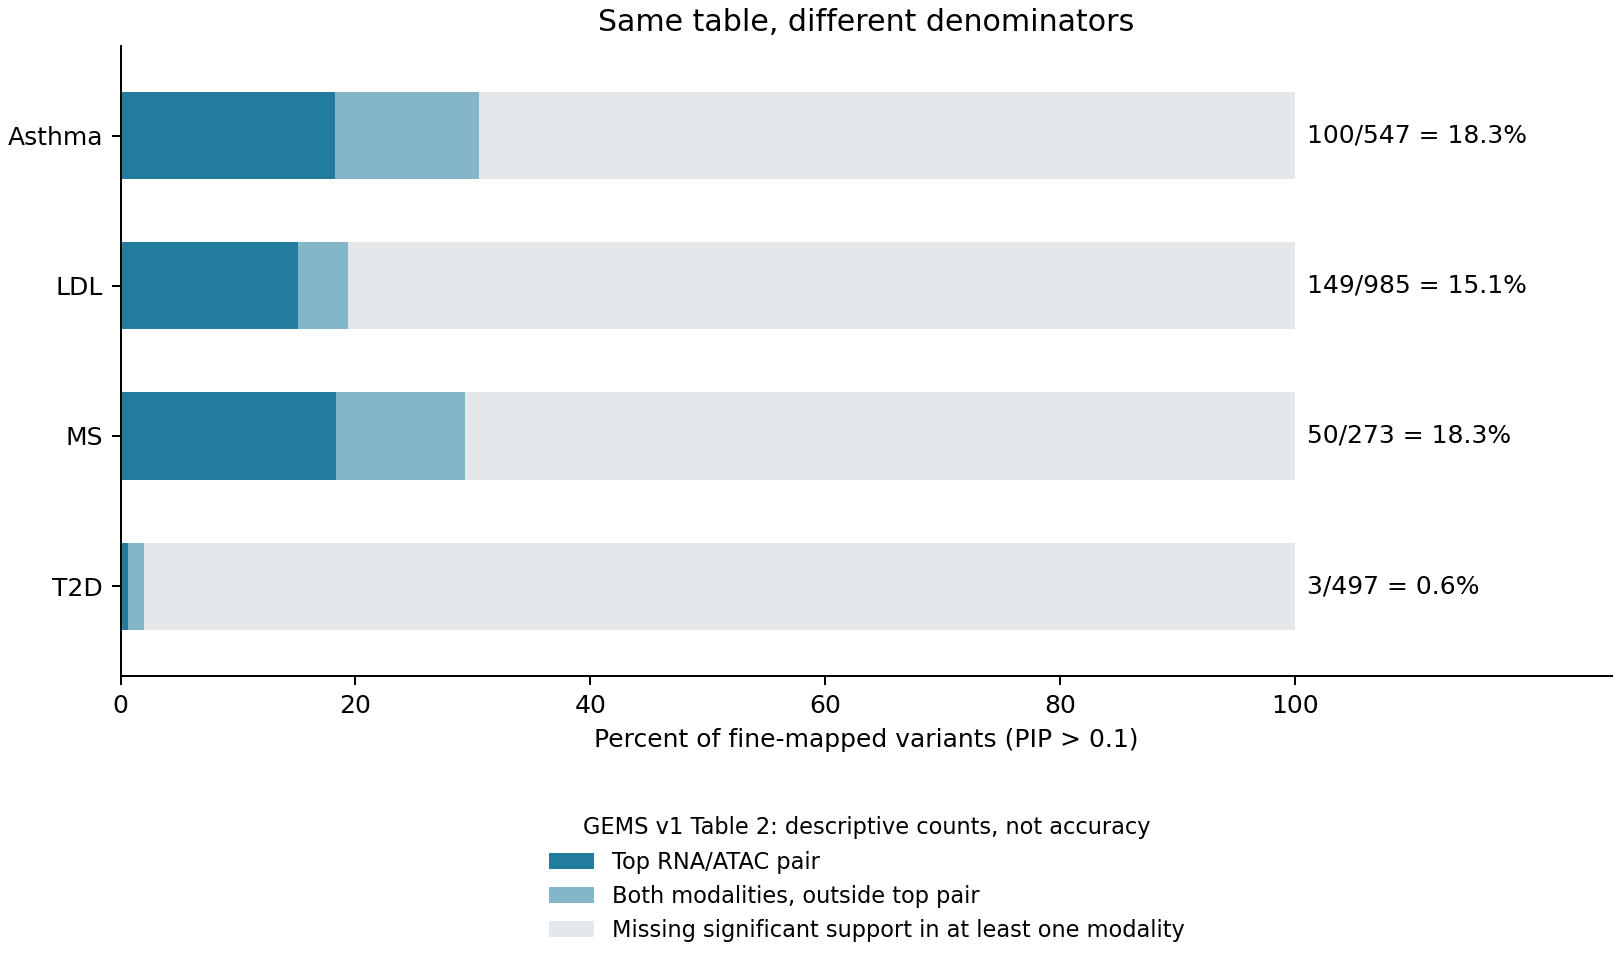
Figure 1. Independent redrawing of public aggregates, not a retrained GEMS performance comparison. Dark color denotes the leading combination; light blue denotes other dual-associated variants; gray denotes variants lacking significant associations in both modalities. Gray includes single-modality and unannotated candidates, not demonstrated absence of biological effects. Other combinations can remain experimentally useful, and this figure cannot estimate hepatocyte-experiment success.
The 2% for T2D is not automatically failure
Only 10/497=2.0% of T2D candidates have associations in both modalities. The largest combination contains three variants. Original Table 2 gives an expected count of 4.8 and a fold of 0.63, not nominally significant in the original hypergeometric test. Nonsignificance does not establish independence. Pancreas RNA with delta+gamma-cell ATAC is shown as the leading combination, but the table note states that colon and colonic-mucosa RNA are tied at three variants each (1, Table 2). The note alone does not show which ATAC cell type pairs with those tissues. Overlaps are unknown, so the counts cannot be added as 3+3+3. A ranking built on three of ten variants does not make the leading cell name stable.
The single-modality islet-ATAC annotation rate of 26.0% and pancreas-RNA rate of 51.5% cannot turn 2.0% into a disagreement rate: models and selection conditions differ. In the multimodal T2D model, only 21/497 variants (4.2%) have significant ATAC associations, whereas the reported RNA fraction is 63.4%. In the other three traits the ATAC fraction is 31.0–41.0% (1). The ATAC-only T2D model also showed the weakest improvement over baseline, with an AUPRC fold of 1.1 (1). The scarcity of ATAC associations and the near-baseline performance of the ATAC-only classifier are observed together. Low classifier discrimination may contribute to fewer assignments, but these two observations alone do not identify the cause.
The authors suggest limited islet-cell training data as one contributor: approximately 15,000 nuclei for islet ATAC tracks and approximately 710 for rare endocrine cells such as delta+gamma (1). They did not establish that explanation by experimentally increasing cell counts. Biological irrelevance and insufficient measurement/model sensitivity remain inseparable explanations of missing annotations.
Requiring matching ATAC and RNA contexts universally could exclude underrepresented cells. Conversely, a pancreas RNA association does not identify a specific islet cell type.
Cell assignment does not establish experimental validity
Interpretation depends jointly on candidate PIP, modality, and tissue-versus-cell-type resolution. Reporting only the leading cell name conceals multiple candidates, unassigned variants, and modality differences. The authors themselves state that variants are typically associated with several functionally related cell types rather than a single causal one (1).
This aggregation does not validate a rule for selecting cells or estimate functional-experiment success. An assigned candidate context is not confirmation of a variant's action or a drug intervention in that context. The aggregates therefore cannot decide the next experimental cell for LDL (hepatocytes) or T2D (a specific islet cell type). GEMS associations are one clue for choosing an experimental system, and their validity must be tested in separate experiments.
I organize what these figures do show along the original evaluation.
First, trait-level prioritization of cell types points in the same direction as an existing method. GEMS agreed with stratified LD-score regression (sLDSC (10)), run on the same 111 CATlas annotations, in ranking CD4+ T cells first for asthma and hepatocytes first for LDL. For T2D the leading islet subtype differed (beta 1 for sLDSC, delta+gamma for GEMS), and the top cell types for MS did not fully overlap (1). The evaluation standard, however, is a “silver standard” built from an AI-assisted literature search and manual review (1). Under it the LDL ATAC AUROC was only 0.66, and 3 of the 111 cell types were in the standard (1). Known cell types ranking high is consistent with prior expectation, but it is not evidence that unexpected cells can be selected.
Second, the variant-level assignment adds information whose size depends on how it is measured. For LDL, the single-modality assignment rate is 45.7% for hepatocyte ATAC and 40.0% for liver RNA (1). Requiring both liver RNA and hepatocyte ATAC drops the coverage of the leading combination to 15.1% of all candidates. For the same candidate set, the apparent share of “variants handled by a hepatocyte experiment” changes about three-fold depending on the criterion imposed. These come from different models and cannot be subtracted. Even so, a number used to choose an experimental system is comparable only when the criterion is stated.
Third, GEMS can be placed against related work. eQTLs have been reported to explain only part of the GWAS signal (11, 12), which motivates sequence-model-based context assignment as a complement. Another line of work uses Borzoi to estimate prior probabilities for fine-mapping (13); I read only its abstract. GEMS instead takes fine-mapping results as labels and reads feature contributions. Neither line tests whether the chosen cell is valid for an experiment.
The answer to the opening question is therefore as follows. For LDL, several views converge on including liver and hepatocytes among the candidate systems. Even so, the shared count is 1.71 times the independent-assignment expectation; 78.0% itself is not the information added beyond independence. The 45.5% merely divides the expected count by observed B, and its difference from 78.0% is not a functional incremental effect. Whether that cell is the best experimental system is not shown. For T2D, this aggregation provides almost no information for narrowing the choice of cell.
Limitations
- Only the main text, Methods, and Table 2 were checked; supplementary tables and figures were not read. Variant-level assignments and the underlying cRE two-by-two tables were not reconstructed.
- Table 2 is an aggregate of four rows for four traits; the variant-level supplementary table was not read. K/N and K/B are recalculations from published aggregates.
- The evaluation standard (the silver standard) is close to the assumptions about known cell types. Whether selecting an unexpected cell is valid cannot be tested within this framework.
- The cRE enrichment background is the remaining candidate variants, so the alternative explanation of general overlap with open regions is not excluded (within the text checked).
Data and code availability
The calculation re-expresses denominators and set partitions for four rows of original Table 2, version 1. These describe a candidate collection, so no sampling-based confidence interval is added. Linkage disequilibrium (LD) also prevents treating variants as independent trials.
The paper's Figshare DOI did not resolve and its public API returned 404 when checked on October 20, 2026. This records availability then, not subsequent status. I therefore did not reanalyze variant-level rankings, candidate multiplicity, or PIP-weighted coverage.
The code, aggregate inputs, and reproduction instructions are provided without original figures or PDF.
References
- Xie X, Qian S, Chang D, Bhangale T, McCarthy MI, Eraslan G, et al. GEMS (GWAS Effect Mechanisms via Sequence-to-Function): Unveiling cell type-specific mechanisms for GWAS variants [Preprint]. bioRxiv; 2026. Version 1, posted 2026 Oct 16. doi:10.64898/2026.10.14.759213. Not peer reviewed. Main text, Methods and Table 2 read; supplementary tables and figures not read.
- Linder J, Srivastava D, Yuan H, Agarwal V, Kelley DR. Predicting RNA-seq coverage from DNA sequence as a unifying model of gene regulation. Nat Genet. 2025;57(4):949–961. doi:10.1038/s41588-024-02053-6.
- Breiman L. Random forests. Mach Learn. 2001;45(1):5–32. doi:10.1023/A:1010933404324.
- Wang G, Sarkar A, Carbonetto P, Stephens M. A simple new approach to variable selection in regression, with application to genetic fine mapping. J R Stat Soc Series B Stat Methodol. 2020;82(5):1273–1300. doi:10.1111/rssb.12388.
- Zhang K, Hocker JD, Miller M, Hou X, Chiou J, Poirion OB, et al. A single-cell atlas of chromatin accessibility in the human genome. Cell. 2021;184(24):5985–6001.e19. doi:10.1016/j.cell.2021.10.024.
- Lundberg SM, Lee SI. A unified approach to interpreting model predictions [Preprint]. arXiv; 2017. arXiv:1705.07874. Persistent URL. Published in: Advances in Neural Information Processing Systems 30 (NIPS 2017).
- Lundberg SM, Erion G, Chen H, DeGrave A, Prutkin JM, Nair B, et al. From local explanations to global understanding with explainable AI for trees. Nat Mach Intell. 2020;2(1):56–67. doi:10.1038/s42256-019-0138-9.
- Benjamini Y, Hochberg Y. Controlling the false discovery rate: a practical and powerful approach to multiple testing. J R Stat Soc Series B Methodol. 1995;57(1):289–300. doi:10.1111/j.2517-6161.1995.tb02031.x.
- Fisher RA. On the interpretation of χ2 from contingency tables, and the calculation of P. J R Stat Soc. 1922;85(1):87–94. doi:10.2307/2340521.
- Finucane HK, Bulik-Sullivan B, Gusev A, Trynka G, Reshef Y, Loh PR, et al. Partitioning heritability by functional annotation using genome-wide association summary statistics. Nat Genet. 2015;47(11):1228–1235. doi:10.1038/ng.3404.
- Mostafavi H, Spence JP, Naqvi S, Pritchard JK. Systematic differences in discovery of genetic effects on gene expression and complex traits. Nat Genet. 2023;55(11):1866–1875. doi:10.1038/s41588-023-01529-1. Abstract read.
- Connally NJ, Nazeen S, Lee D, Shi H, Stamatoyannopoulos J, Chun S, et al. The missing link between genetic association and regulatory function. eLife. 2022;11:e74970. doi:10.7554/eLife.74970. Abstract read.
- Srivastava D, Korsakova A, Wang Q, Ruiz L, Yuan H, Kelley DR. Borzoi-informed fine mapping improves causal variant prioritization in complex trait GWAS [Preprint]. bioRxiv; 2025. Posted 2025 Jul 14. doi:10.1101/2025.07.09.663936. Not peer reviewed; abstract read.