Do high AlphaGenome variant scores identify drug targets?
An audit of AVI rank units and 12 reported DNM1 splice variants, contrasted with PCSK9 evidence. Published aggregates are recalculated; no model inference or API queries were performed.
On this page
Background and objective
How does changing one DNA letter affect a gene? AlphaGenome Atlas expands access to predictions of such molecular effects. Released in September 2026, it contains predictions for approximately nine billion single-nucleotide variants (1).
A predicted large effect does not automatically identify a gene to inhibit with a drug. Variant prioritization, interpretation of a molecular change and selection of a therapeutic intervention require different evidence. Atlas examples help show both the progress in the first two and the remaining distance to the third.
I reaggregated the DNM1 splicing experiment in the Atlas report (2) and contrasted it with PCSK9 studies. The Atlas report was a preprint when checked on October 12, 2026. I ran neither AlphaGenome inference nor the Atlas API. Scores and assay values are reported by the authors; the figures and arithmetic here are my own.
What an AVI score of 24.7 means
AlphaGenome predicts molecular readouts such as expression, splicing and chromatin features from DNA sequence. Splicing removes portions of an RNA transcript and joins the remaining segments (3).
The Atlas AlphaGenome Variant Impact score, AVI, combines predictions to rank variants. The report describes taking the largest predicted effect across tissues for each molecular modality and combining these with AlphaMissense, protein-truncation annotations and conservation in an 18-feature model.
Training uses proxy labels separating observed human variants with filtering allele frequency above versus below 0.1%. This frequency statistic uses a lower bound accounting for frequency-estimation uncertainty and takes the maximum across genetic-ancestry groups. It does not directly label every variant for disease causation or therapeutic benefit. Disease-variant prioritization is assessed in separate downstream benchmarks.
The displayed PHRED score is a logarithmic transformation of rank in the reference distribution of all SNVs. If the upper-tail fraction is \(u\):
\[ Q=-10\log_{10}u,\qquad u=10^{-Q/10}. \]
Table 1. AVI PHRED and upper-tail reference fraction.
| AVI PHRED | Upper-tail fraction in the reference distribution |
|---|---|
| 10 | 10% |
| 20 | 1% |
| 24.7 | Approximately 0.339% |
| 30 | 0.1% |
A score of 24.7 does not mean a 99.661% probability of pathogenicity. At the same reference rank, disease, candidate-selection process, inheritance and tissue context can change which variants matter.
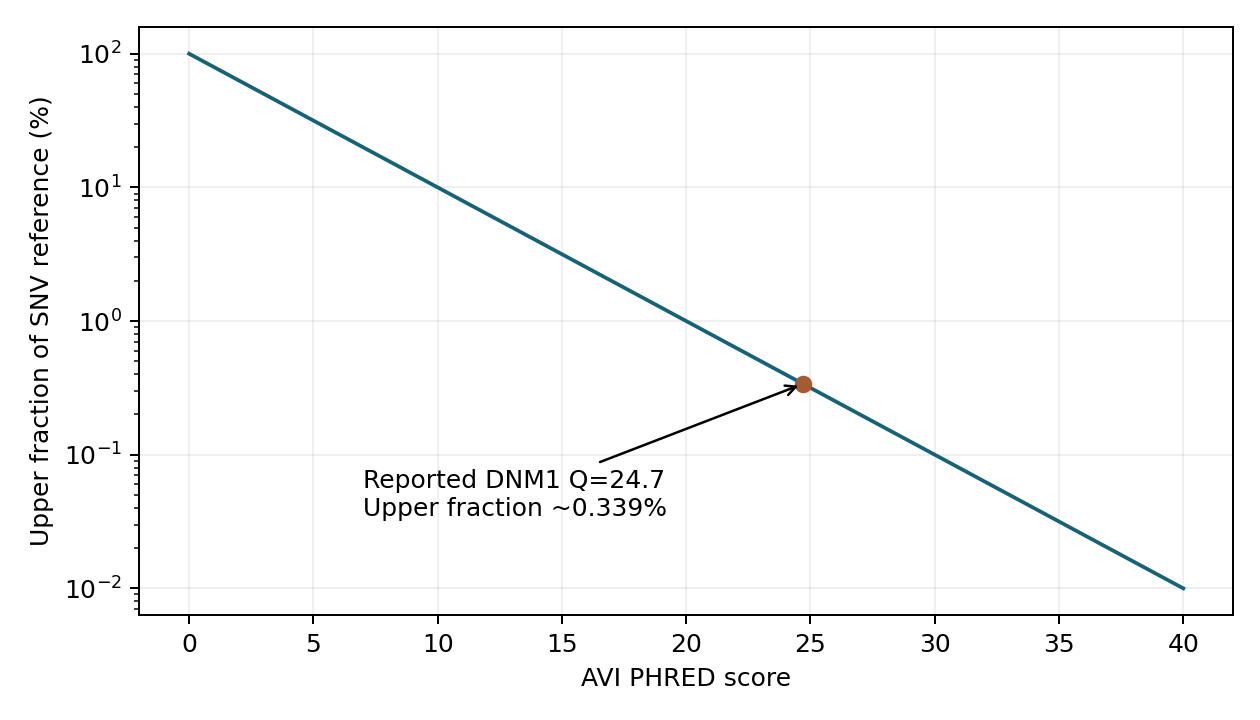
Figure 1. Arithmetic based on the report's rank scale. The point marks the authors' reported DNM1 score of 24.7. This does not convert the score into disease probability or drug efficacy.
AVI feature contributions are additive explanations of the raw score, before PHRED rank transformation. PHRED values cannot be directly decomposed into additive expression and splicing contributions. A contribution's sign also does not specify whether therapeutic intervention should increase or decrease a gene's activity.
DNM1 requires tissue- and transcript-level interpretation
The Atlas report describes prioritizing the intronic DNM1 variant chr9:128225994:G>A, in GRCh38 coordinates, in an epileptic encephalopathy case. The reported AVI PHRED was 24.7, with a strong splicing contribution.
Transcript-level predictions add information beyond the overall rank. They indicated a new splice acceptor in a brain-specific transcript, producing a 13-amino-acid extension. Comparing reference and variant predictions identifies the altered RNA junction. Low expression of the relevant exon in blood also made blood RNA a poor validation material for this case (original report, Figure 3).
The aggregate AVI and tissue-specific predictions therefore serve different roles: first prioritize a candidate, then identify which transcript changes in which tissue. Skipping the second step risks interpreting a high score as generic loss of gene function.
The authors examined nearby variants and measured splicing with a minigene reporter, which inserts a sequence segment into an assay of RNA joining. It does not measure the patient's brain or clinical symptoms. Combining this evidence with earlier case reports, the authors recommended classification of the variant as Likely Pathogenic.
Twelve exon-extension variants are not one functional category
Table S4 of the Atlas report lists 12 variants producing in-frame exon extensions: three corresponding to earlier reports and nine labeled Prospective. I transcribed these selected rows into a CSV and summarized extension length and alternative splice-site usage.
Extensions ranged from 2 to 45 amino acids and usage from 0.16 to 0.94. The 13-amino-acid-extension variant had usage of 0.76. Knowing extension length therefore does not determine the abundance of the corresponding alternative transcript.
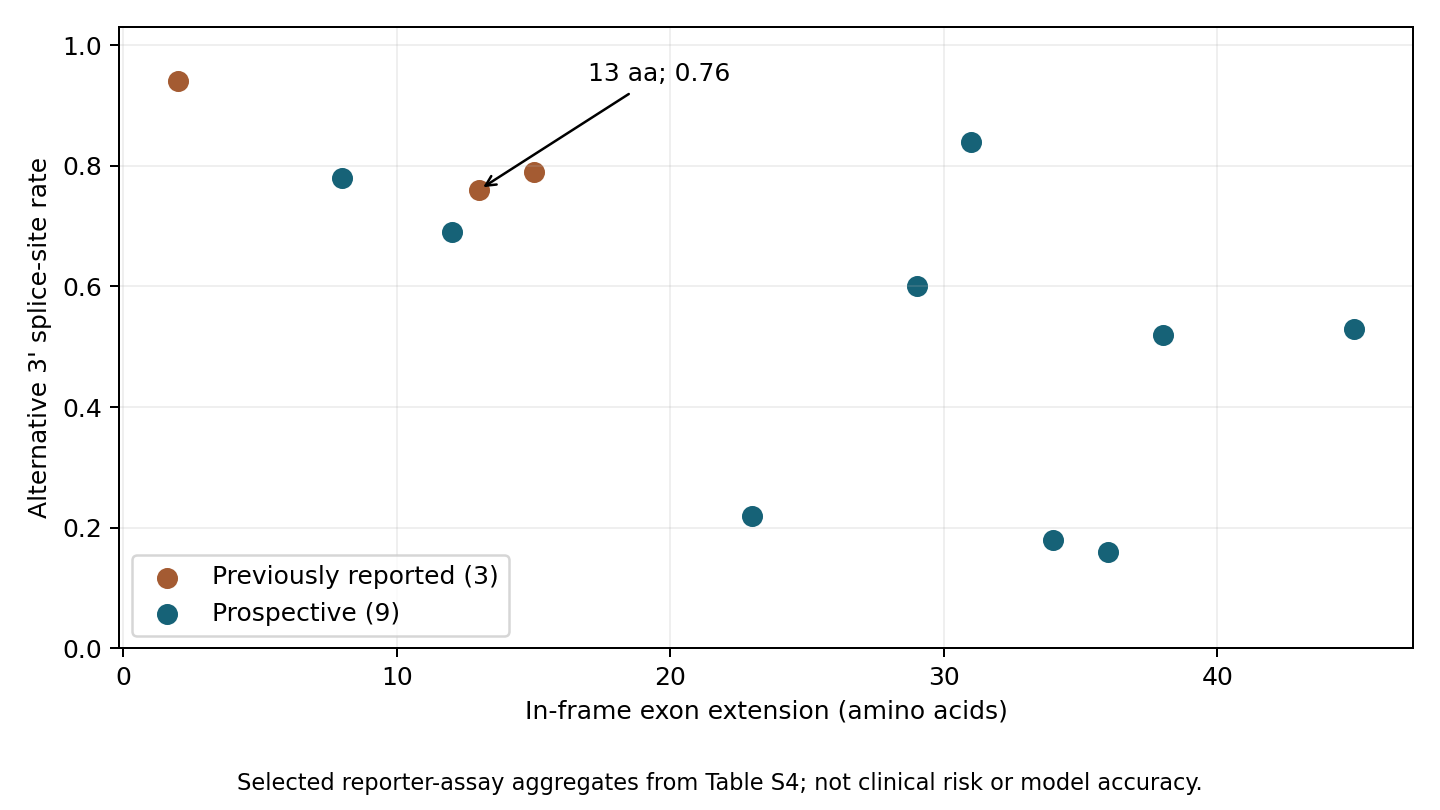
Figure 2. Reaggregation of 12 rows in Table S4. Orange indicates three previously reported variants and blue nine prospective variants. Usage values are reporter-assay summaries, not disease probabilities. Replicate-level raw data were not obtained, so no error bars or confidence intervals are added.
The methods describe calculating alternative-splicing fractions within replicates and averaging across replicates and five cell-line–promoter combinations that pass quality criteria. A single tabulated fraction should not be treated as universal across cells or tissues.
These 12 rows are not the denominator of the full screen. Observing an extension in every selected row does not yield 100% model accuracy. This article estimates neither predictive accuracy nor new pathogenicity classifications. It illustrates how experimental evidence connects an aggregate score to a specific RNA alteration.
Protein function is a further step. The report discusses possible dominant-negative effects, in which abnormal DNM1 interferes with normal DNM1, in relation to previous research. Interference with a normal protein and a simple reduction in protein quantity could call for different interventions. A splicing reporter alone does not establish either that mechanism or a treatment.
Drug targets require direction as well as magnitude
PCSK9 provides a useful contrast. Gain-of-function and loss-of-function variants have both been studied. Gain-of-function work examined effects on the LDL receptor, whereas loss-of-function experiments identified mechanisms including reduced protein secretion (4, 5).
PCSK9 promotes LDL-receptor degradation. Inhibition can preserve the receptor and increase uptake of circulating LDL. Population studies connected reduced-function genetic variants to lower LDL and coronary disease risk, and randomized trials tested clinical outcomes of pharmacological PCSK9 inhibition (6, 7).
This is not a claim that AlphaGenome discovered PCSK9. I did not retrieve PCSK9 AVI scores. The contrast is the separate evidence for variant impact, direction of function, disease association and drug intervention. Lifelong genetic effects also differ from starting a drug in adulthood.
Table 2. Evidence from variant prioritization to therapeutic intervention.
| Question | Information in the Atlas DNM1 example | Further question for drug discovery |
|---|---|---|
| Which variant merits investigation? | Overall rank and splicing contribution | Is it relevant to the disease and inheritance pattern? |
| What changes, and where? | Brain-specific transcript, splice site and extension | Does it reproduce in relevant cells or tissue? |
| How does protein function change? | A mechanistic hypothesis based on earlier work | Can loss, gain and interference with normal function be distinguished? |
| What should be intervened on? | The report alone does not determine therapeutic direction | Can the abnormal action be modified while preserving normal function? |
| Does the patient benefit? | Not evaluated by the reporter assay | What do exposure, tissue, timing, safety and clinical outcomes show? |
Ranking genes that contain high-scoring variants is not the same as ranking targets for drug intervention. Even a strong disease-related change does not imply that suppressing the entire gene is desirable.
Discussion
AVI summarizes molecular impact rather than providing a disease-specific therapeutic-target score. Choosing a nearby gene or a high-AVI variant does not resolve which linked candidate causes disease, the relevant tissue or the direction of intervention.
The DNM1 example connected a candidate difficult to assess in blood with a brain-specific splicing hypothesis. Molecular prediction, genetic evidence for disease and functional consequences of intervention remain different evidence. A high aggregate rank cannot substitute for the latter two.
Data and code availability
Download recalculation code, input CSV, figures and results. python analysis.py recomputes Table S4 summaries and the PHRED rank conversion using the standard library. Figure generation requires matplotlib. This is arithmetic on published assay summaries, not model inference, an API query or reanalysis of the full screen.
Primary sources are the Atlas report, AlphaGenome paper and PCSK9 studies listed above. The Atlas portal (8) and official SDK (9) are also available. The report specifies research use rather than diagnostic use for medical decisions and notes that terms differ by data type and access route. This distribution contains no original-paper figures, individual genomes, model weights or official code.
References
- Google DeepMind. AlphaGenome Atlas: a predictive map of every possible DNA letter change in the human genome. 2026 Sep. Announcement.
- Cheng J, Taylor KR, Nicolaisen L, Pan J, Bycroft C, Perino M, et al. AlphaGenome Atlas: in silico mutagenesis of the entire human genome improves prioritization and interpretation of non-coding variants [Preprint]. 2026. Report. Accessed 2026 Oct 12.
- Avsec Ž, Latysheva N, Cheng J, Novati G, Taylor KR, Ward T, et al. Advancing regulatory variant effect prediction with AlphaGenome. Nature. 2026;649(8099):1206–1218. doi:10.1038/s41586-025-10014-0.
- Abifadel M, Guerin M, Benjannet S, Rabès JP, Le Goff W, Julia Z, et al. Identification and characterization of new gain-of-function mutations in the PCSK9 gene responsible for autosomal dominant hypercholesterolemia. Atherosclerosis. 2012;223(2):394–400. doi:10.1016/j.atherosclerosis.2012.04.006.
- Zhao Z, Tuakli-Wosornu Y, Lagace TA, Kinch L, Grishin NV, Horton JD, et al. Molecular Characterization of Loss-of-Function Mutations in PCSK9 and Identification of a Compound Heterozygote. The American Journal of Human Genetics. 2006;79(3):514–523. doi:10.1086/507488.
- Cohen JC, Boerwinkle E, Mosley TH, Hobbs HH. Sequence Variations in PCSK9, Low LDL, and Protection against Coronary Heart Disease. New England Journal of Medicine. 2006;354(12):1264–1272. doi:10.1056/NEJMoa054013.
- Sabatine MS, Giugliano RP, Keech AC, Honarpour N, Wiviott SD, Murphy SA, et al. Evolocumab and Clinical Outcomes in Patients with Cardiovascular Disease. New England Journal of Medicine. 2017;376(18):1713–1722. doi:10.1056/NEJMoa1615664.
- Google DeepMind. AlphaGenome Atlas [Web resource]. Portal. Accessed 2026 Oct 12.
- Google DeepMind. AlphaGenome [Software development kit]. GitHub. Accessed 2026 Oct 12.