Co-clump proximity versus cellular communication: auditing CCI-seq
Public mouse-kidney metadata reproduces heterotypic Frequency scores while separating co-clump counts, cell pairs and random-label enrichment. Rare-pair denominators, replicate structure and recovered clump sizes define what proximity evidence can support.
On this page
- Background and objective
- Shared clump origin does not prove direct contact
- Distinguishing 11,519 cells from the 5,731-cell denominator
- Co-clump counts and within-clump cell pairs differ
- Rare pairs require counts as well as ratios
- Enriched relative to which null?
- Including single-cell recoveries changes the question
- Discussion
- Data and code availability
- References
Background and objective
Ligand and receptor RNA expression nominates possible communication, but does not directly measure whether cells are near each other or whether those molecules acted. What does proximity information add?
CCI-seq, published on October 5, 2026, combinatorially indexes cell clumps and subsequently reads single-cell transcriptomes together with clump identity (1). Shared clump origin supplies an observation distinct from expression-based inference.
I independently reaggregated public mouse-kidney annotations and Cell-IDs. After reproducing the published frequency calculation, I separated clump counts, cell-number-adjusted frequency and replicate-specific denominators. Additional proximity observations do not by themselves establish causal communication.
Shared clump origin does not prove direct contact
CCI-seq indexes partially dissociated clumps and assigns cells sharing a Cell-ID to the same clump. Not all pairs within a clump need touch directly; another cell may lie between them (1).
Recovered cell count also need not equal original physical clump size. RNA or indexing QC can leave only two cells from a larger clump. Restricting to two recovered cells therefore does not prove direct contact.
Expression-derived ligand–receptor scores nominate molecular combinations, whereas proximity records spatial context. Imaging adjacency and responses to molecular perturbation add still different evidence. I did not independently reanalyze expression networks or images.
Distinguishing 11,519 cells from the 5,731-cell denominator
From kidney result.txt in the pinned archive (2), I retained 11,519 cells with the original QC flag of 1 out of 20,824 rows. I did not rerun raw-read QC. There were 17 annotated types and three biological replicates.
Grouping by Cell-ID yielded 7,715 clumps, including 5,788 with only one recovered cell. The remaining 1,927 multicell clumps contained 5,731 cells. The public notebook uses cells in multicell clumps for Frequency's denominator, not all 11,519 cells (3).
Table 1. Replicate-specific cells and multicell clumps.
| Replicate | QC-passing cells | Cells recovered in multicell clumps | Multicell clumps |
|---|---|---|---|
| exp1 | 1,496 | 747 | 255 |
| exp2 | 6,452 | 3,541 | 1,147 |
| exp3 | 3,571 | 1,443 | 525 |
| Total | 11,519 | 5,731 | 1,927 |
Cells and clumps are not counted as biological replicates; there are three biological replicates.
All seven T cells occurred in single-cell recoveries. T-cell Frequency is therefore undefined under the primary denominator, not evidence that T cells do not communicate. The original table likewise has 16 missing heterotypic pairs involving T cells, which I did not replace with zero.
Co-clump counts and within-clump cell pairs differ
For distinct types A and B, I recorded three quantities: clumps containing at least one of each type; the sum of within-clump products of A and B cell counts; and that product divided by all possible cell pairs in each clump, then summed.
A clump with two A cells, one B and one other cell contributes one co-clump, two A–B pairs and weight \(2/\binom{4}{2}=1/3\). Its pairs are not independent observations of direct contact.
The heterotypic Frequency calculation is:
\[ W_{AB}=\sum_i\frac{n_{iA}n_{iB}}{\binom{n_i}{2}},\qquad F_{AB}=\frac{100W_{AB}}{\sqrt{N_A N_B}} \]
\(N_A,N_B\) count each type within the selected multicell clumps. I also checked that Cell-IDs did not collide across experiments and linked each clump to its experiment.
Of 136 heterotypic pairs, all 120 defined frequencies matched the released table, with maximum absolute discrepancy approximately \(7.1\times10^{-15}\), within floating-point precision. This reproduces a frequency calculation, not the entire experiment or RNA pipeline.
Rare pairs require counts as well as ratios
I examined the paper's PST–B example and collecting-duct CD-PC–CD-IC. PST denotes proximal straight tubule, CD-PC collecting-duct principal cells and CD-IC collecting-duct intercalated cells.
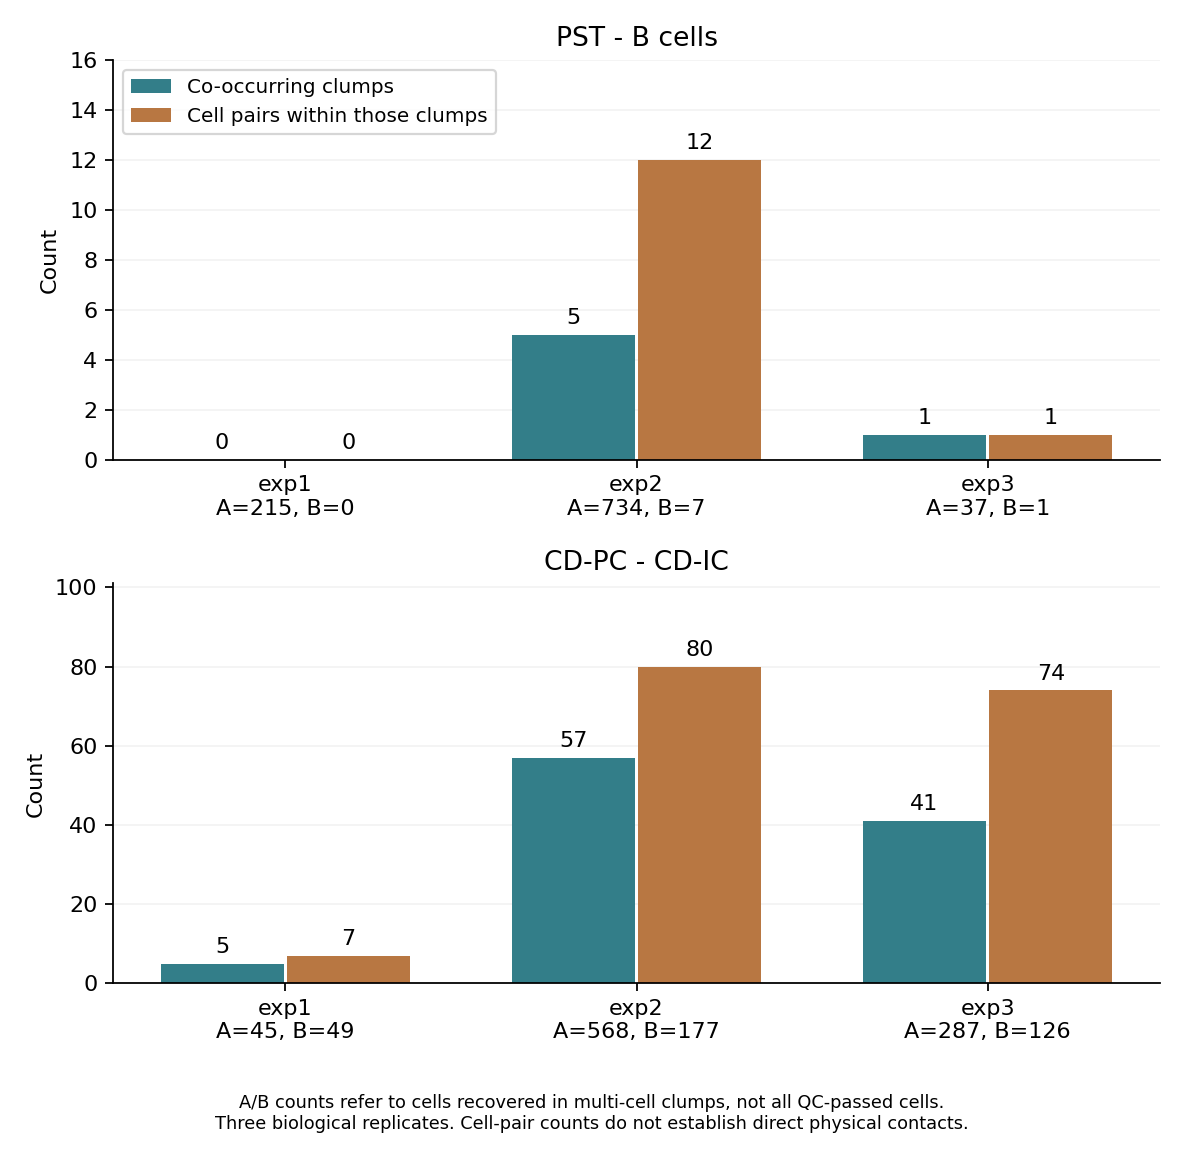
Figure 1. Co-clump and cell-pair counts are separate. A/B below each panel refer to the left/right type named in its heading and count recovered cells in multicell clumps. Cell-pair counts are not measured direct contacts.
PST–B totaled six clumps and 13 cell pairs: zero clumps in exp1, five in exp2 and one in exp3. Only eight B cells entered the main analysis, distributed 0, 7 and 1. Exp1 Frequency is undefined. Zero co-clumps without recovered B cells is not a well-sampled negative result. The paper additionally validates PST–B proximity by immunofluorescence and asmFISH; those images were not reevaluated here.
Of PST–B's weighted sum 3.171, 3.0, approximately 94.6%, arose from three two-cell clumps. Six clumps or 13 pairs therefore convey a different impression from their weighted contributions.
CD-PC–CD-IC totaled 103 clumps and 161 pairs, with 5, 57 and 41 clumps across replicates. These two cases were selected after reading the paper, not discovered in a multiplicity-adjusted search of the entire network.
Enriched relative to which null?
Abundant types have more opportunities to share clumps. I therefore fixed recovered clump sizes and type counts and uniformly reassigned cell-type labels. For \(N\) cells and \(G\) multicell clumps, the exact expected heterotypic weight is:
\[ E[W_{AB}]=G\frac{2N_A N_B}{N(N-1)} \]
Dividing each clump's weight by all possible pairs cancels individual clump sizes from this expectation. Size distributions still affect variance and observed co-occurrence patterns.
I compared pooling all replicates with reassigning only within each replicate. The latter sums replicate-specific expectations before dividing the observed total weight by that sum.
Table 2. Frequency and random-label enrichment.
| Pair | Recalculated published Frequency | Observed/expected, pooled | Observed/expected, within-replicate reassignment |
|---|---|---|---|
| PST–B | 3.571 | 3.43 | 3.31 |
| CD-PC–CD-IC | 12.128 | 1.84 | 1.77 |
Pooling made relatively little difference here. Rare-pair replicate ratios were unstable: PST–B was 2.31 in exp2 and 53.56 in exp3. Exp3 has only one B cell and one co-clump; its expected weight of approximately 0.0187 makes the ratio large. This is not evidence of strong communication established in numerous observations.
I also ran 1,999 within-replicate label permutations, distributing comparisons between their mean and the exact expectation. Permutation p values include ties and add 1 to numerator and denominator, giving minimum 0.0005. Permutations do not increase the biological replicate count. These reassignment and p-value definitions differ from the paper, so its p values were not reproduced.
The null preserves neither anatomical regions nor type-specific dissociation, recovery and QC biases. Ratios measure co-occurrence enrichment relative to random labels, not its physical or functional cause.
Including single-cell recoveries changes the question
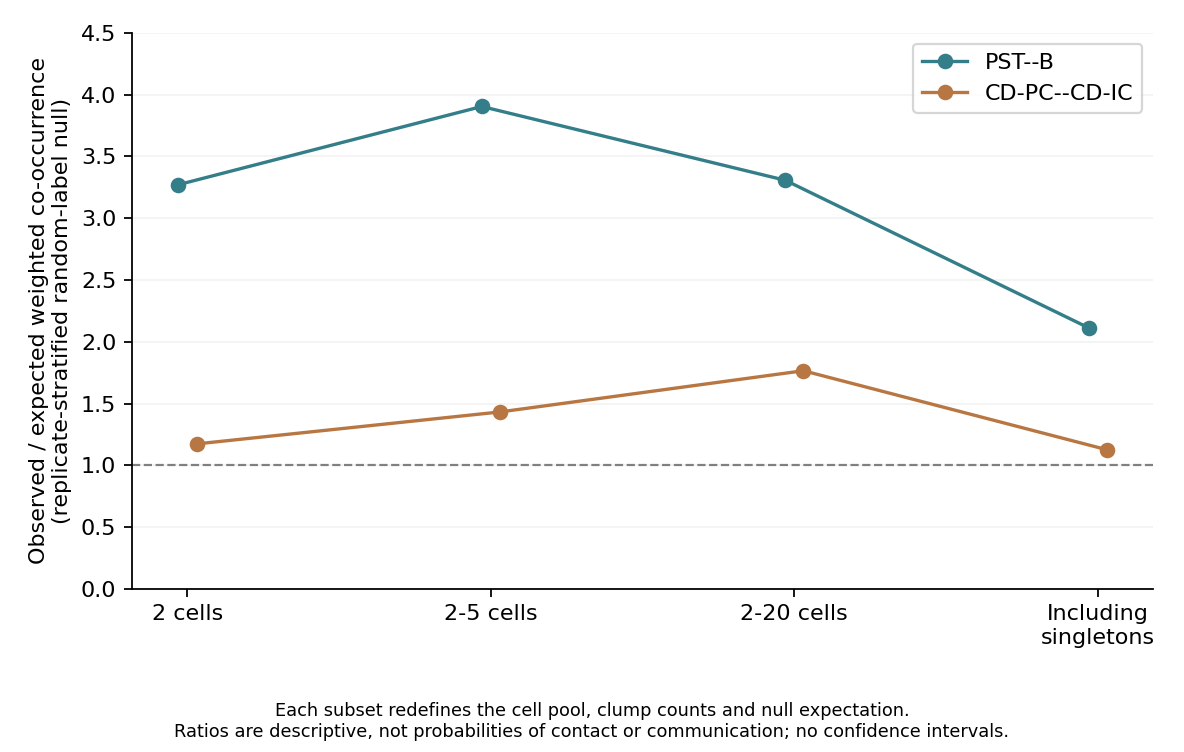
Figure 2. Expectations are recalculated from each subset's cells, type counts and clumps. Points are not biological-effect estimates with confidence intervals. Different target populations also prevent interpreting the plot as a simple robustness comparison for one fixed effect.
Within-replicate PST–B enrichment was 3.27 for two-cell clumps, 3.90 for sizes 2–5 and 3.31 for the primary 2–20 subset. Including single-cell recoveries in denominators and reassignment changed it to 2.11. Corresponding CD-PC–CD-IC values were 1.17, 1.43, 1.77 and 1.13.
The result does not license choosing a convenient denominator. Co-occurrence among multicell recoveries and co-occurrence across all QC-passing cells are different questions. The former reproduces the original calculation; the latter is a separate sensitivity analysis requiring attention to recovery differences.
Leave-one-replicate-out tables are also included. Removing exp2 leaves PST–B with one co-clump and one B cell, producing ratio 53.56. Retaining a large ratio is not strong reproducibility when only one observation remains.
Discussion
CCI-seq records shared clump origin unavailable from expression alone. Co-occurrence enrichment, ligand–receptor expression, imaging adjacency and perturbation-dependent function remain distinct evidence.
This reaggregation traced kidney Frequency calculations and their dependence on rare-pair counts and replicate denominators. It did not identify molecular function. The paper's imaging validation and this frequency recalculation are not counted as the same validation result.
Data and code availability
Download code, annotations, reference frequencies and original figures. Python and numpy run aggregation, permutations and 11 tests; figure generation requires matplotlib. Instructions retrieve only the needed annotations and numerical tables from the public ZIP and verify CRC and SHA-256. Original figures, third-party notebooks, raw reads and RNA matrices are not distributed.
input-provenance.json records pinned versions, selected members and hashes; REPRODUCE.md records denominators and calculation methods. This exploratory audit follows examination of the paper's examples. It does not independently validate experiments, images, all QC, expression-based inference, causal communication or generalization to human disease.
References
- Tang L, Tian K, Fu X, Xu Y, Wu J, Zhang J, et al. Resolving cell–cell interaction networks and their molecular logic in complex tissues. Nature Methods. 2026;23(10):2042–2053. doi:10.1038/s41592-026-03237-0.
- Tian K, Tang L. Code for: Resolving cell-cell interaction networks and their molecular logic in complex tissues [Computational notebook and processed data]. Version v5. Zenodo; 2026 Apr 14. doi:10.5281/zenodo.19544434.
- Zhang laboratory. CCI-seq: Figure 2 interaction analysis [Notebook]. Commit 327725c97d82e8918d880e439d57e4133cfa93d4. GitHub notebook.