Which experiment enriches the desired cells? A LabCompass inverse-design diagnostic
Twelve LabCompass culture designs distinguish measured target-cell enrichment from uncertainty reduction after model updates.
On this page
- From forward prediction to inverse design
- Recovering known conditions versus testing new ones
- Unequal outcomes among twelve candidates
- Model updates after weak enrichment
- Multiple changes do not isolate one factor
- Uncertainty and measured enrichment ranked differently
- Data and code availability
- References
Predicting a cell's response to a drug or cytokine does not by itself choose the next experiment. A condition that produces many desired cells may differ from one that tests a model's weak region.
The October 9, 2026 preprint Generative inverse design steers human hematopoietic cell fate in vitro introduces LabCompass to select culture conditions for human CD34-positive cells (1). Inputs include cytokine and small-molecule concentrations, oxygen and culture duration. Outputs are cell-state distributions measured by spectral flow cytometry. The study alternates condition design with actual culture experiments rather than predicting cell futures from RNA-seq alone.
I reaggregated public annotated measurements for 12 selected conditions and 67 wells from the first prospective candidate experiment. Separating target enrichment from information gain clarifies both high- and low-yielding conditions, but a low result is not automatically evidence of useful learning.
From forward prediction to inverse design
A forward model predicts cell distributions from culture conditions. Inverse design uses predicted phenotypes to generate suitable conditions. LabCompass combines a flow-matching condition generator, a forward cell-response model and a learned prior over conditions (original Figure 1 and Methods).
An abbreviated objective for increasing the fraction of target cell type \(t\) is:
\[ \max_{x\in\mathcal{X}}\;\widehat p_t(x) \]
Here \(x\) is a culture condition, \(\mathcal{X}\) the admissible domain and \(\widehat p_t\) the predicted fraction. This explains the objective; it does not reimplement the original training loss or inverse-design ODE.
A predicted maximum need not be experimentally favorable where the model is inaccurate. Candidate plausibility, feasible concentrations and uncertainty also enter selection. After filtering predicted fractions and condition ranges, the authors tested one low-uncertainty and two high-uncertainty candidates per target. The former checks an expected outcome; the latter probe less well-known regions. Selection uncertainty is the standard deviation of losses over multiple cell populations generated by the model.
Recovering known conditions versus testing new ones
Loop 1 evaluates hidden known culture conditions. For example, condition 210, strongly inducing the megakaryocytic lineage, was withheld to test whether inverse design could approach it. Prospective culture testing of newly selected conditions begins in Loop 2 (original Figures 3–4).
Loop 2 selects three conditions each for megakaryocytic progenitors (MgkPro), erythroid progenitors (EryPro), phenotypic HSCs (pHSC) and Pre-ProB cells. This reaggregation covers only those 12. Targets and uncertainty categories came from the authors' analysis notebook (2). Condition 245 is high uncertainty there but low uncertainty in the paper's Loop 3 description. Categories for 245 and 246 are therefore notebook-specific, not definitive uncertainty ranks.
The public dataset (3) supplies loop2_annotated.h5ad and loop2p5_annotated.h5ad, processed, annotated and subsampled files rather than all raw measurements. Together they contain 999,995 cells. Excluding 55,555 cells from out-of-scope condition 247 leaves 12 conditions, 67 wells and 944,440 cells.
Both files share experiment ID, date and source fields, with source recorded as pooled. Different loop names do not establish two independent replications of identical conditions. Metadata do not recover individual donor identities or counts. Large cell numbers are not equivalent to large numbers of independent biological replicates.
Unequal outcomes among twelve candidates
Within each well, I divided the stored target-cell count by its stored total-cell count. The main condition summary equally averages these well-level fractions. Annotations were unchanged.
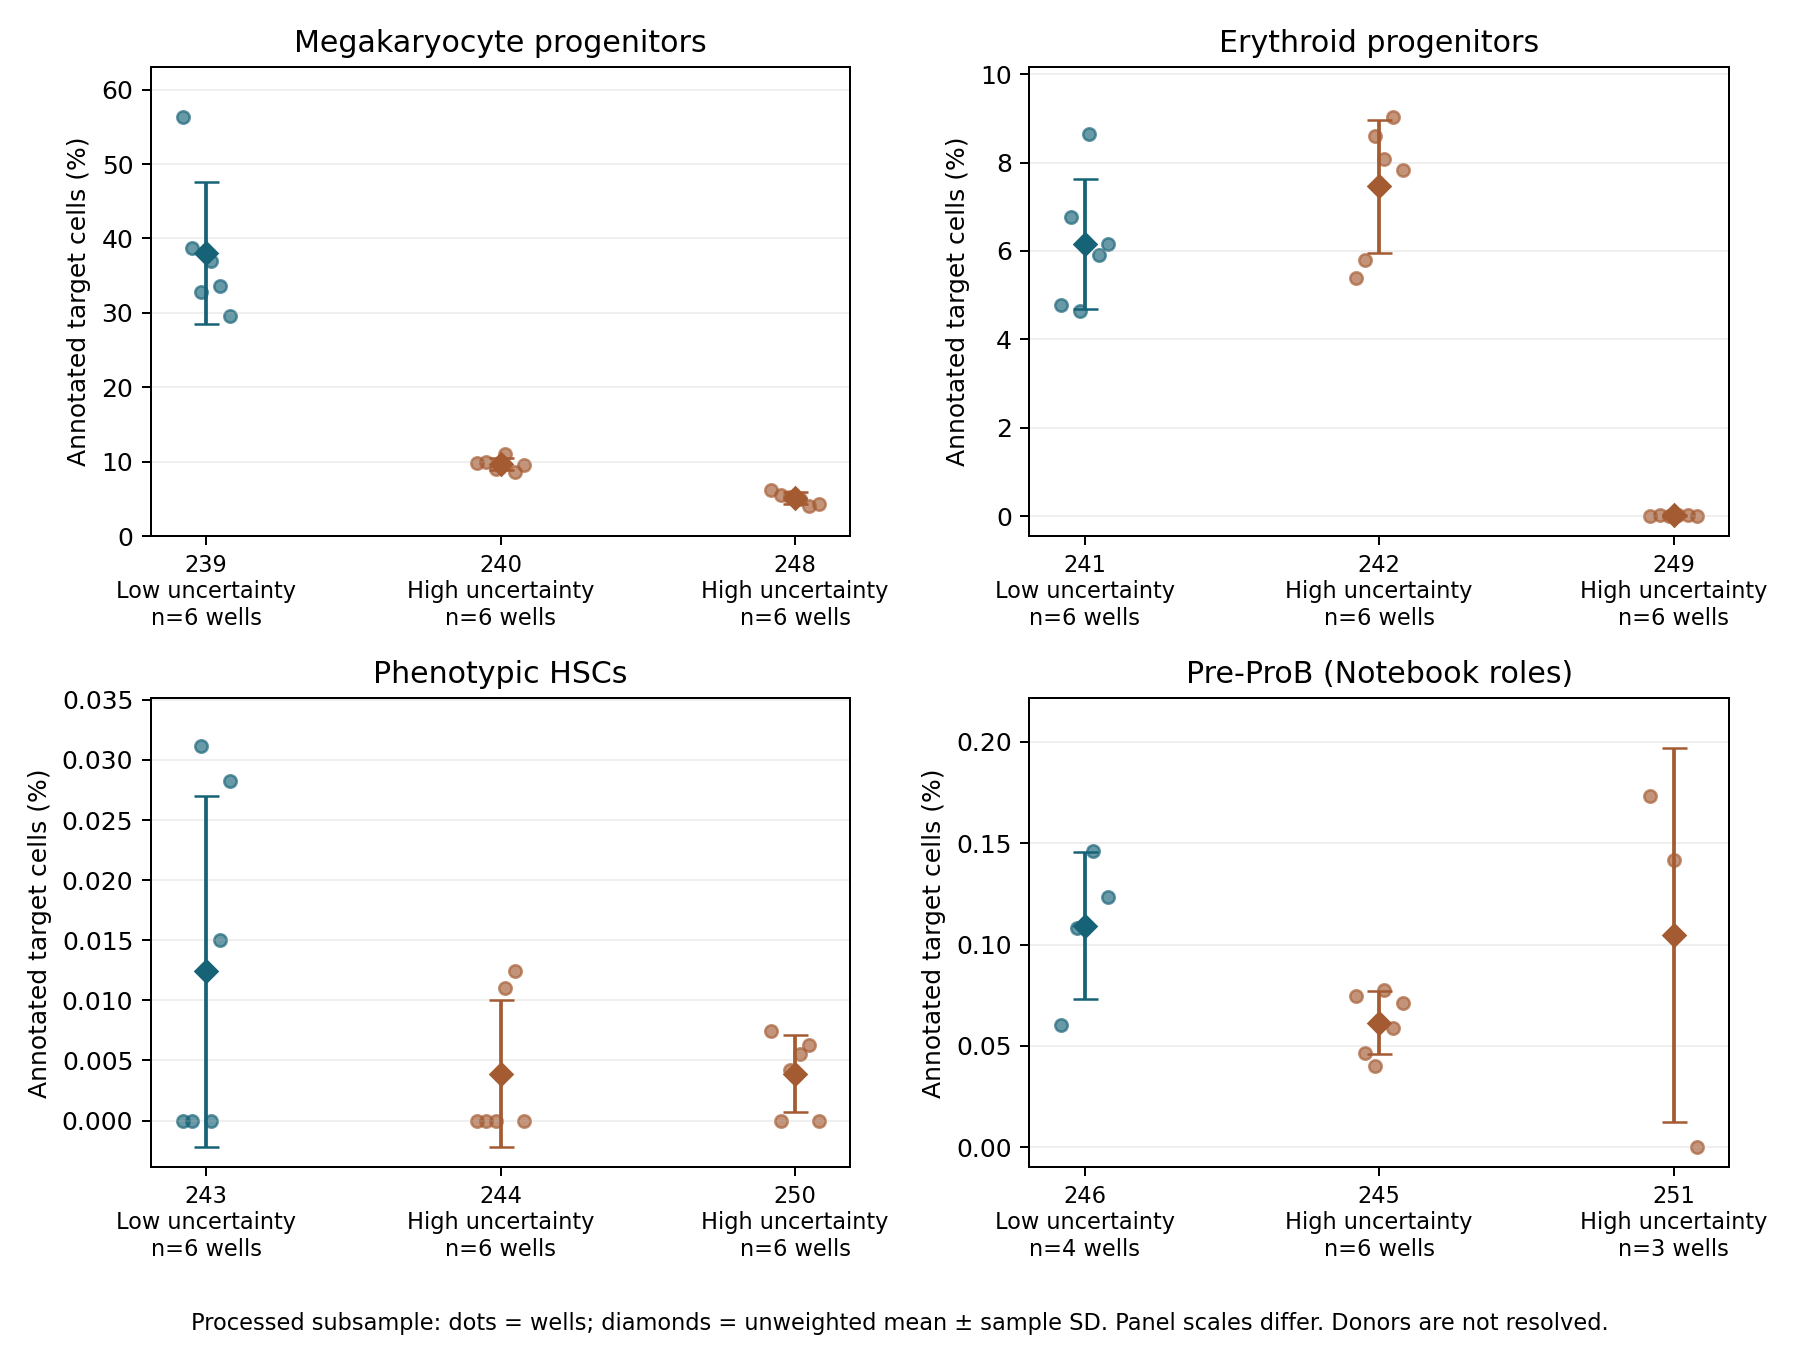
Figure 1. Circles show well fractions, diamonds the equally weighted well mean, and bars sample standard deviation. Vertical scales differ by target. Low/high uncertainty follows the public notebook and is distinct from the plotted error bars. Pre-ProB labels explicitly say Notebook because of the source discrepancy. Conditions 246 and 251 retain four and three wells, respectively; others retain six. Missing wells were not imputed. Bars are not donor-level confidence intervals.
Table 1. Loop 2 candidates and equally weighted mean target-cell fractions. Pre-ProB uncertainty categories follow the notebook.
| Target | Low-uncertainty condition / mean fraction | High-uncertainty candidate 1 / mean fraction | High-uncertainty candidate 2 / mean fraction |
|---|---|---|---|
| MgkPro | 239 / 38.0% | 240 / 9.66% | 248 / 5.08% |
| EryPro | 241 / 6.15% | 242 / 7.46% | 249 / 0.0180% |
| pHSC | 243 / 0.0124% | 244 / 0.0039% | 250 / 0.0039% |
| Pre-ProB | 246 / 0.109% | 245 / 0.0614% | 251 / 0.105% |
Low-uncertainty MgkPro condition 239 performed best. For EryPro, high-uncertainty condition 242 exceeded low-uncertainty 241. Predictive uncertainty and measured enrichment are different rankings.
Selected pHSC and Pre-ProB fractions were low. An HSC annotation does not demonstrate functional self-renewal. The paper acknowledges limited enrichment at this stage and later adds conditions affecting lymphoid and monocytic lineages to the design space. This code does not reaggregate those later results (1, Loop 3 and Discussion).
Averaging wells versus pooling cells
For condition 239, the equal-well mean was 38.0%, versus 40.9% after pooling all stored cells. Unequal stored cell counts make these quantities differ:
\[ \overline p_{\mathrm{well}}=\frac{1}{W}\sum_{w=1}^{W}\frac{k_w}{n_w}, \qquad p_{\mathrm{cell}}=\frac{\sum_w k_w}{\sum_w n_w} \]
Here \(k_w\) is the target count and \(n_w\) the stored-cell count. Neither is treated as an exact reproduction of the paper's approximately 44% MgkPro result. Reproducing that value requires matching events, annotations and aggregation in the complete processing workflow.
Descriptively leaving out one well at a time gave condition-239 means of 34.4–39.7%. No single well alone explains its high mean, but the range is not a donor-replication interval. Leaving out a well can reverse the mean ranking of Pre-ProB conditions 246 and 251. Small mean differences do not establish superiority.
Model updates after weak enrichment
Learning value requires assessment separate from enrichment. The paper adds some newly measured conditions to training while withholding 248 and 249 for before/after prediction comparisons. A later stage incorporates all conditions, so these model versions must be distinguished (1, Loop 2 and Model update between loops).
I transcribed Supplementary Tables 13–14 and calculated changes. These are arithmetic summaries of the authors' model outputs, not independent inference.
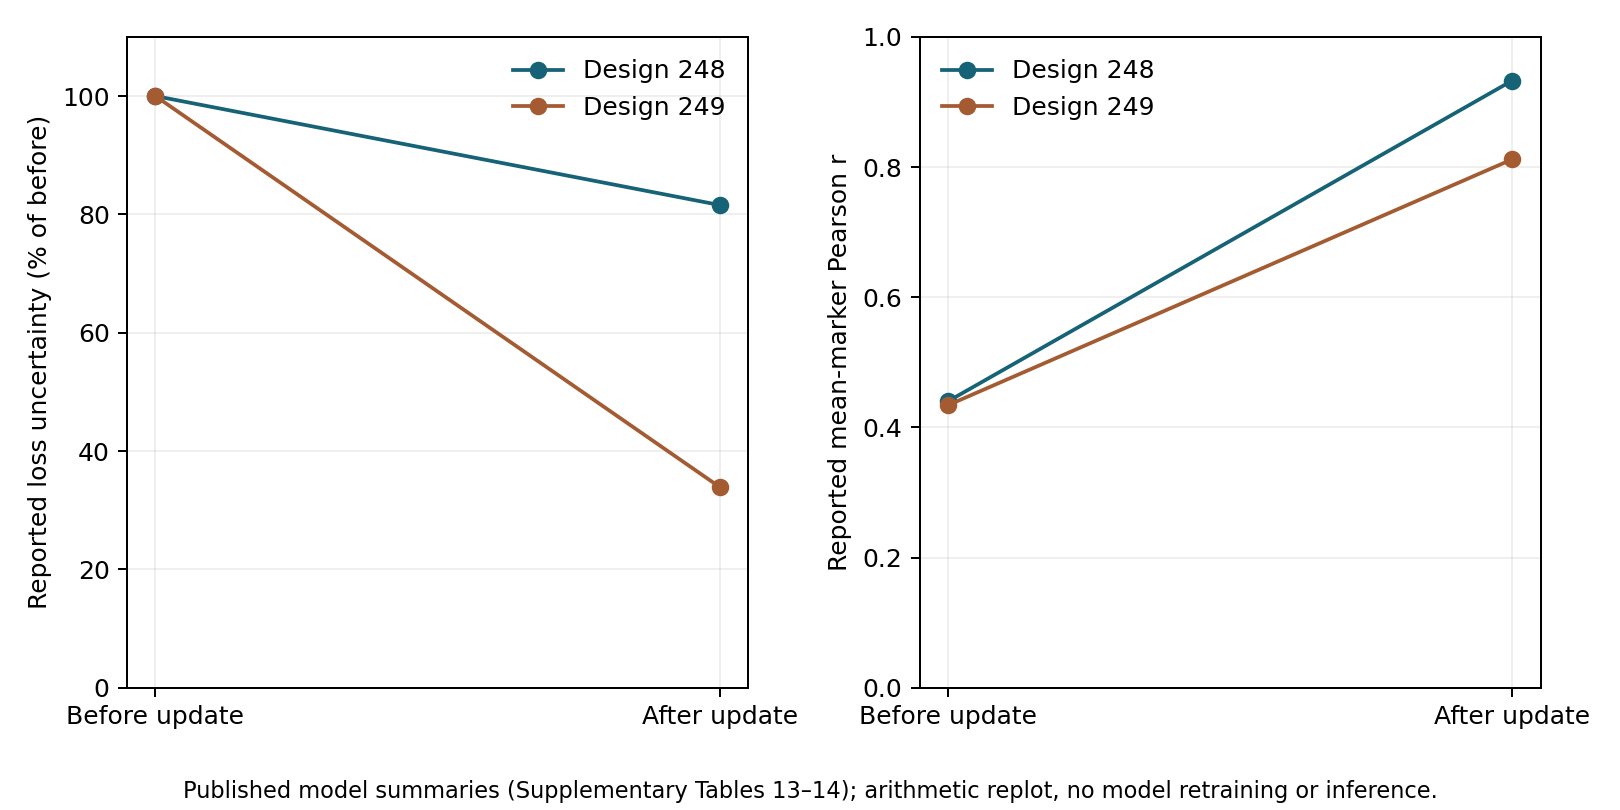
Figure 2. Left: loss-related predictive uncertainty, normalized to 100% before updating. Right: Pearson correlations between predicted and measured protein-marker means for the same conditions. Source: Supplementary Tables 13–14. No retraining or inference was performed here.
Table 2. Reported model-update metrics for conditions 248 and 249, excluded from added training.
| Held-out evaluation condition | Predictive loss uncertainty: before → after | Relative decrease | Marker-mean correlation: before → after |
|---|---|---|---|
| 248 (MgkPro) | 5.97×10⁻⁴ → 4.87×10⁻⁴ | 18.4% | 0.440 → 0.933 |
| 249 (EryPro) | 5.37×10⁻⁵ → 1.82×10⁻⁵ | 66.1% | 0.434 → 0.812 |
Uncertainty here is variation in loss over cell populations generated by the forward model. It does not directly describe observed between-well standard deviation or errors in independent donors. A smaller value alone does not establish accuracy. Improved marker correlations provide additional evidence, but correlation does not establish absolute agreement or calibrated uncertainty.
Condition 249 had only 0.0180% EryPro in this reaggregation. Although that condition was not added to training in this comparison, marker predictions reportedly improved after learning other new conditions. Finding an enriching condition and learning about a weak prediction region are distinct successes.
This does not establish that high-uncertainty selection was optimal. Random selection and alternative strategies under the same measurement budget were not compared here. Poor outcomes cannot all be relabeled retrospectively as information-gain successes.
Multiple changes do not isolate one factor
MgkPro condition 239 used UM171 at 66.54 nM and butyzamide at 110.51 nM. Condition 240 used 0 and 5.03 nM, respectively, while GM-CSF, SCF, retinoic acid, oxygen and other factors also changed. Both cultures lasted 14 days. The distributed CSV includes conditions extracted from public metadata.
This comparison cannot estimate a percentage improvement caused by increasing UM171. Factors changed together, and plates were not matched controls. Outcomes of whole conditions and causal effects of individual molecules are different questions.
The comparison does not identify factor-specific effects within a matched sample or reproducibility across donors. Absolute cell yield, function and effects on other cell types also matter beyond target fractions. Stored counts are post-sampling counts and were not used to compare absolute yield.
Uncertainty and measured enrichment ranked differently
LabCompass proposes culture conditions and returns measurements to the model. Across these 12 candidates, enrichment was uneven and predictive uncertainty did not rank candidates by observed fraction.
Obtaining more desired cells and acquiring information in poorly predicted regions are different experimental objectives. Generating candidates alone does not establish both. The tables show why enrichment or yield and model uncertainty cannot be treated as the same success metric.
Data and code availability
Download code, input CSVs and figures. Aggregation and seven computational tests use the Python standard library; plots require matplotlib. REPRODUCE.md gives instructions, and input-provenance.json records versions and hashes.
The paper is the October 9 version-1 preprint. Measurements came from the CC BY 4.0 dataset at revision 3c5002d8c9af70ad6b728d999719a26bef3dedfc; mapping came from the reproduction repository at commit 0d0ffb093431b2e0a0ff765d0423071aa380c3dc. The ZIP excludes original H5AD files, PDF, author figures, code and trained models. Figures were independently drawn from public numerical values.
This exploratory reaggregation followed inspection of public materials. It does not validate saved annotations, reproduce full raw-data processing, completely map every generated candidate to selected conditions, run model inference, establish strategy optimality or test donor-level reproducibility. Preclinical culture research is not a recommendation for clinical cell manufacturing or dosing.
References
- Paulas-Condori L, Palma A, Consoli L, Rubio-Lara JA, Hidajat O, Zheng W, et al. Generative inverse design steers human hematopoietic cell fate in vitro. bioRxiv [preprint]. 2026 Oct 9. doi:10.64898/2026.10.07.756550.
- Theis Laboratory. LabCompass-reproducibility [source code and notebooks]. Commit 0d0ffb093431b2e0a0ff765d0423071aa380c3dc. Reproduction repository.
- Theis Laboratory. LabCompass [dataset]. Revision 3c5002d8c9af70ad6b728d999719a26bef3dedfc. Hugging Face. CC BY 4.0. Dataset.