Can maximal degradation alone set the dosing interval of a targeted protein degrader?
On this page
Abstract
In designing doses for a targeted protein degrader (TPD), it is necessary to consider not only plasma concentration but also how far the target is reduced and how quickly it recovers. This article examines public data on ER-PROTACs and compares dosing frequencies with a minimal model of target degradation and recovery.
In this simulation based on assumptions, the regimen with the highest maximal degradation did not necessarily sustain degradation best. However, public data alone cannot determine a particular drug's recovery rate, the degradation it requires, or its clinical dosing interval. The reported measurements and the illustrative simulations address different questions.
Introduction
The Question of Interest (QoI) is: "When the frequency changes at the same long-term average dose, how do the maximum, minimum and time-averaged degradation change, and which measurements are missing for that comparison?"
The Context of Use (CoU) is limited to research and learning with public information, comparison of candidate models, and design of additional measurements. It is not used for dose selection of an actual drug, risk prediction for patients, or prediction of effects from animals to humans. The concentrations and doses below are in relative units and cannot be converted to mg doses of vepdegestrant or ERD-1233.
What the public data show
End-of-study ER degradation and tumor growth inhibition
In the MCF7 model shown in Figure 5C of Gough et al., daily vepdegestrant at 3, 10 and 30 mg/kg gave TGI of 85, 98 and 120%, whereas ER degradation at the end of study was at least 94% at all doses (1).
Table 1. End-of-study ER degradation and tumor growth inhibition
| Daily dose | Published TGI | ER degradation at end of study |
|---|---|---|
| 3 mg/kg | 85% | ≥94% |
| 10 mg/kg | 98% | ≥94% |
| 30 mg/kg | 120% | ≥94% |
Tumor growth inhibition (TGI) compares tumor growth with the control group; it is not a cell-kill rate or a clinical response rate. Values above 100% must also be interpreted with the definitions and experimental conditions of that paper.
This observation raises the question of whether end-of-study degradation alone can explain the difference in efficacy between doses. It does not prove that the duration of degradation is the cause. Sampling time, PD at the low-concentration end, inhibition through binding, downstream responses and variation between experiments remain candidates. End-of-study PD must not be relabeled as maximal degradation.
Plasma and tumor concentrations
The primary paper on ERD-1233 reports plasma and tumor concentrations in the ER Y537S-mutant MCF-7 model after a 10 mg/kg dose. Comparator values for ARV-471 are in the same report (2).
Table 2. Published plasma and tumor concentrations and their ratios
| Compound | Time after dose | Plasma concentration (ng/mL) | Tumor concentration (ng/mL) | Tumor/plasma ratio (calculated here) |
|---|---|---|---|---|
| ERD-1233 | 3 h | 5,365 | 312 | 0.058 |
| ERD-1233 | 24 h | 16 | 157 | 9.81 |
| ARV-471 | 24 h | 9 | 286 | 31.8 |
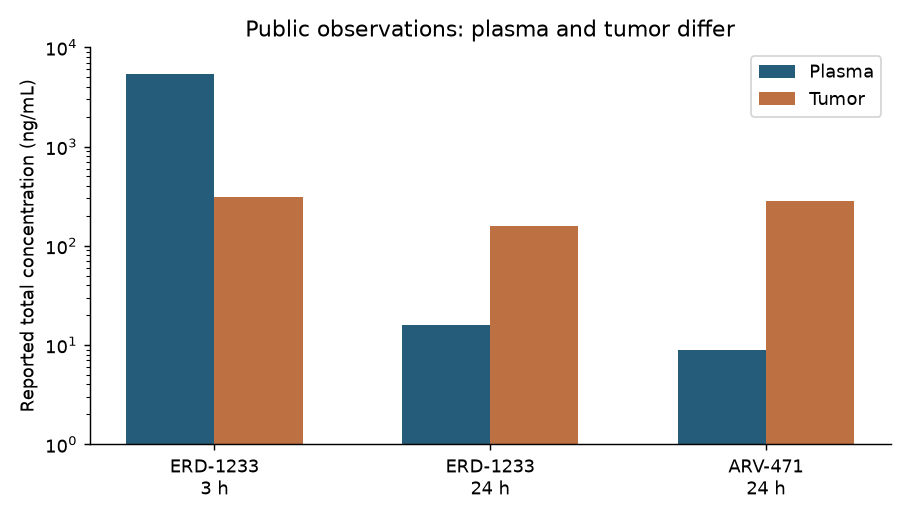
Figure 1: A redrawing of values in the ERD-1233 paper, not fitted curves or individual data. The ratios are arithmetic calculations from the published concentrations at each time point, not equilibrium partition coefficients or unbound concentration ratios. Error bars are not shown because comparable measures of measurement error are not available for this comparison.
At least under these conditions, the plasma concentration at 24 hours cannot stand in for tumor exposure. On the other hand, two time points cannot separately identify the rate of tumor penetration, the rate of elimination from the tumor and the rate of target recovery. The total concentration in tumor homogenate is not treated as the unbound intracellular concentration acting on the target.
Which source is used for what
Table 3. Uses and limitations of the sources
| Source | Use here | What this source alone cannot do |
|---|---|---|
| Vepdegestrant nonclinical paper (1) | Comparing end-of-study ER degradation and TGI | Estimating the PD trajectory over the whole dosing period |
| ERD-1233 paper (2) | Checking plasma and tumor concentrations | Independently estimating tissue penetration and recovery rates from two time points |
| Haid and Reichel on TPD modeling (3) | The approach linking PK and degradation kinetics | Treating the parameters in this article as values for an actual drug |
| AACR abstract on AZD4241 (4) | A precedent for a PK/PD/tumor model | Reproducing individual data or estimates not published in the abstract |
| Human PopPK paper on vepdegestrant (5) | A candidate source for future human exposure analysis | Transferring animal PD directly to humans |
Reference (4) is a conference abstract and does not carry the same information as a peer-reviewed paper. The individual data of reference (1) are available on request to the authors. This article uses only aggregate values from the published texts and does not claim to have reanalyzed individual data it has not obtained.
Vepdegestrant was approved by the FDA on 1 May 2026; the approved dose is 200 mg once daily with food (6). Here, public data on an existing drug are used as material for examining the model. The article is not framed as deciding a first-in-human dose for an approved drug.
Methods
Exposure: separating plasma from the site of action
A one-compartment PK model with oral administration of a relative dose is used. Amount and concentration scales are normalized within the model.
\[ \frac{dA_g}{dt}=-k_a A_g,\qquad \frac{dC_p}{dt}=k_a A_g-k_{el}C_p \]
At each dose the relative dose is added to \(A_g\). Next, an effect-site concentration that equilibrates with a delay is introduced.
\[ \frac{dC_e}{dt}=k_e(C_p-C_e) \]
\(C_e\) is a hypothetical effect-site concentration, not a measured tumor concentration. A normalization equivalent to \(K_p=1\) is assumed. This is a structure for examining separately the case in which drug remains at the site of action, not a fit to total tumor concentration.
Target amount: expressed relative to baseline
Let \(x=T/T_0\) be the target amount relative to the untreated level, with initial value 1.
\[ \frac{dx}{dt}=k_{deg}(1-x)-k_D(C_e)x \]
\[ k_D(C_e)=k_{max}\frac{C_e^h}{K_{50}^{h}+C_e^h},\qquad D(t)=1-x(t) \]
Assuming equilibrium before treatment gives \(k_{syn}=k_{deg}T_0\), which avoids treating the synthesis rate and the natural degradation rate as independent parameters.
The steady-state degradation at a constant concentration is
\[ D_{ss}(C)=\frac{k_D(C)}{k_{deg}+k_D(C)} \]
In the high-concentration limit it becomes \(k_{max}/(k_{deg}+k_{max})\). The maximal degradation of this model therefore does not need to be estimated as a separate free parameter. Also, \(K_{50}\) here is the concentration giving half the maximal induced degradation rate, which is not the same as an experimentally measured "24-hour DC50". Measured degradation depends on exposure time and target turnover as well as on concentration.
When the drug effect has disappeared completely, the target recovers as
\[ x(t)=1-\{1-x(0)\}\exp(-k_{deg}t) \]
The half-life in this equation is the half-life of the remaining target deficit. It is distinct from the apparent recovery half-life during a period when drug remains at the site of action (3).
Assumptions and dosing conditions
The following are not estimates fitted to an actual drug. They are settings for comparing structures.
Table 4. Model settings
| Parameter | Setting | Status |
|---|---|---|
| Plasma PK elimination half-life | 6 h | Assumption |
| Absorption rate | 1 h⁻¹ | Assumption |
| Effect-site equilibration half-life | 2 / 24 h | Two scenarios |
| Natural target turnover half-life | 6 / 48 h | Two scenarios |
| Maximal induced degradation rate | 1 h⁻¹ | Assumption |
| \(K_{50}\) | Relative concentration 1 | Assumption |
| Hill coefficient | 1.2 | Assumption |
| Initial target amount | Ratio to baseline 1 | Untreated equilibrium |
Table 5. Regimens with the same long-term average dose
| Regimen | Relative dose per administration | Long-term average weekly dose |
|---|---|---|
| QD (every 24 hours) | 1 | 7 |
| BID (every 12 hours) | 0.5 | 7 |
| Q2D (every 48 hours) | 2 | 7 |
| 5 days on, 2 days off | 1.4 | 7 |
With Q2D, the number of doses per calendar week alternates. Because it gives 7 doses and a relative dose of 14 over 14 days, the comparison matches the long-term average dose and uses the last 14 days of a 42-day simulation. This window contains a whole number of Q2D cycles and weekly off-treatment cycles. Linear PK and dose-independent absorption are assumed, but equal average doses do not imply equal PD profiles or equal safety.
Results
Persistence after a single dose has at least two causes
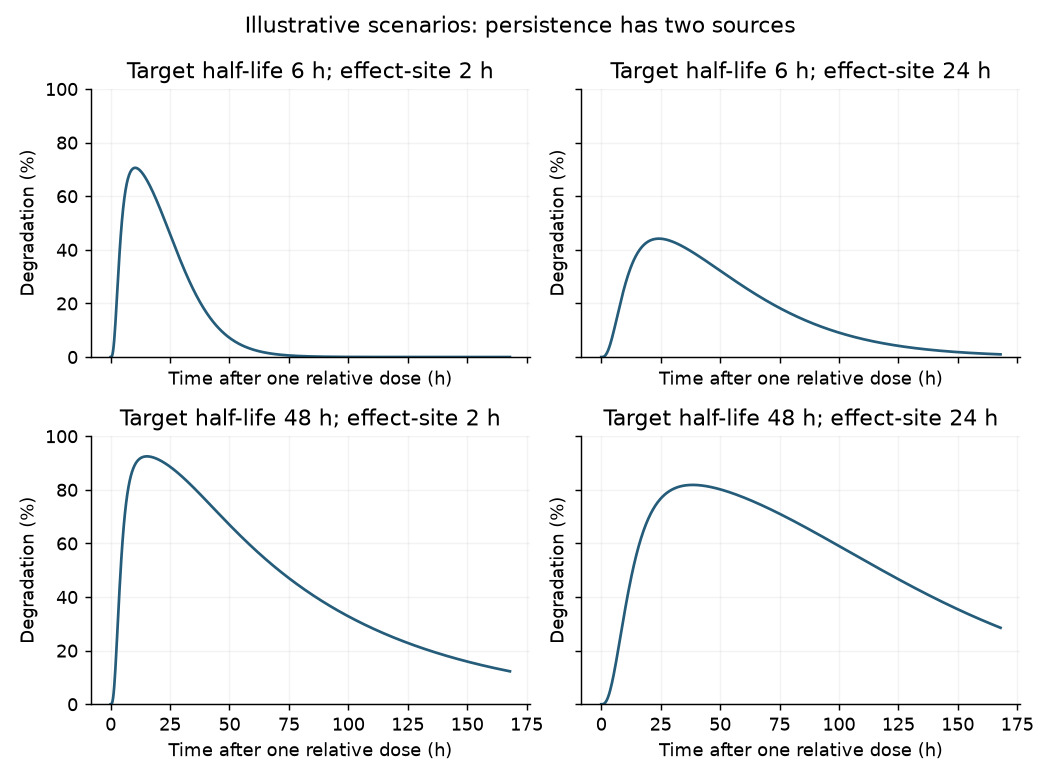
Figure 2: A single dose of the same relative size. All are calculations with assumed parameters, not fits to measured values. Degradation can persist both when target turnover is slow and when effect-site equilibration is slow.
Looking at PD alone, it is tempting to interpret persistent degradation as "the target recovers slowly". But degradation may also continue because drug remains at the site of action. Measurements that pair concentration and target amount after a single dose help distinguish these.
Maximal and sustained degradation with rapid target turnover
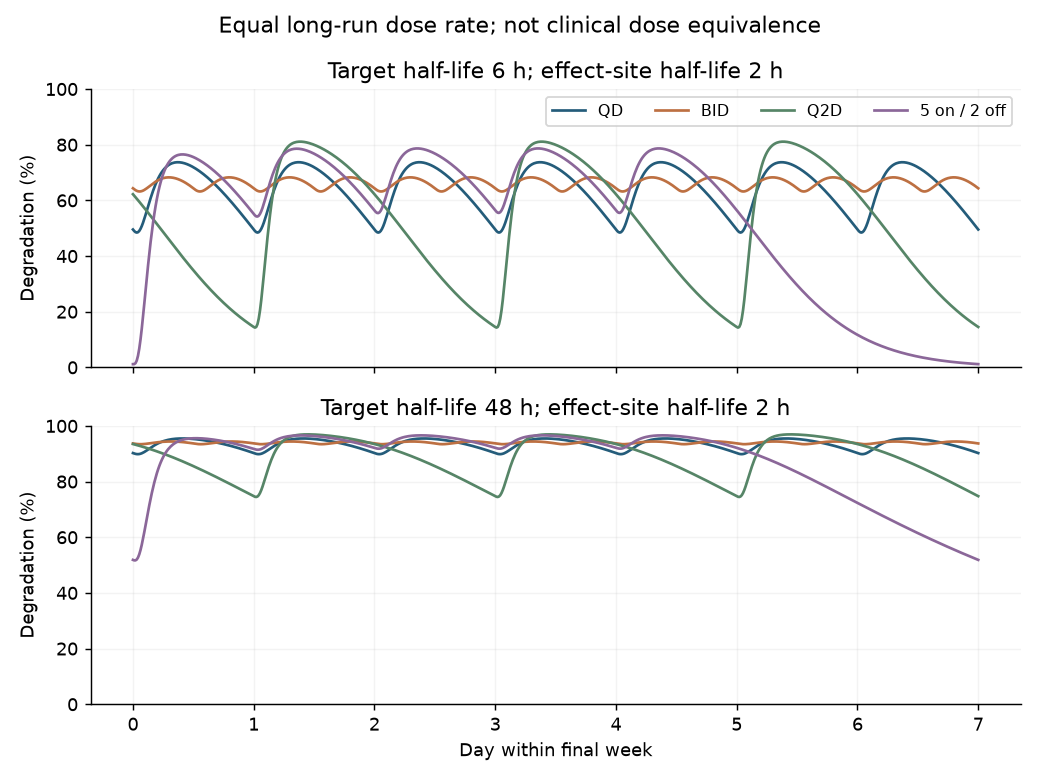
Figure 3: Effect-site equilibration half-life of 2 h. The last 7 of 42 days are shown. Top: target half-life 6 h; bottom: 48 h. Reducing the frequency and increasing each dose can deepen degradation and give the target more time to recover before the next dose.
The two scenarios with an effect-site half-life of 2 h are shown numerically. The minimum is the lowest degradation in the fixed 14-day window and is not the same as the degradation immediately before a dose.
Table 6. Degradation by target half-life and regimen
| Target half-life | Regimen | Maximal degradation | Minimal degradation | Mean degradation |
|---|---|---|---|---|
| 6 h | QD | 73.7% | 48.4% | 63.8% |
| 6 h | BID | 68.3% | 63.2% | 66.1% |
| 6 h | Q2D | 81.1% | 14.3% | 52.2% |
| 6 h | 5 on / 2 off | 78.7% | 1.2% | 53.7% |
| 48 h | QD | 95.5% | 89.9% | 93.4% |
| 48 h | BID | 94.4% | 93.4% | 94.0% |
| 48 h | Q2D | 97.0% | 74.5% | 89.1% |
| 48 h | 5 on / 2 off | 96.6% | 51.7% | 87.4% |
With a target half-life of 6 h, Q2D has a higher maximal degradation than QD but lower minimum and mean values. With 48 h, degradation is relatively well maintained, but the minimum with Q2D or two days off falls below QD. Equating "degraded deeply" with "kept suppressed for as long as needed" misses this difference.
Effect-site retention and differences between regimens
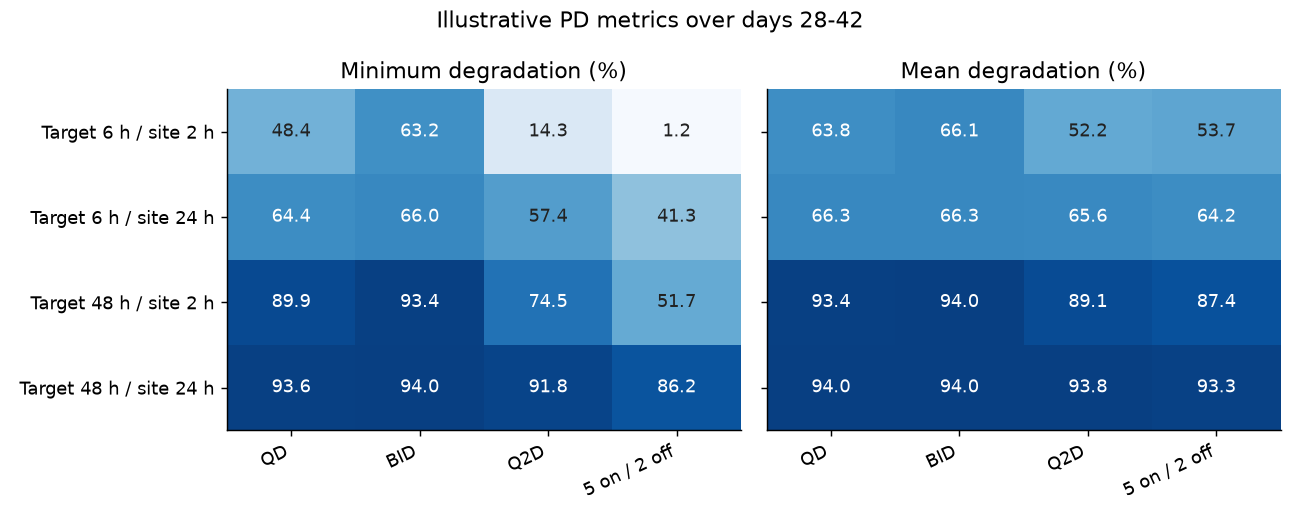
Figure 4: Metrics over the last 14 days. When effect-site equilibration is slow, exposure is smoothed and the differences between dosing frequencies shrink. The values in this figure are results under four fixed parameter conditions, not confidence intervals or predictions for a patient population.
Even with the same plasma PK and the same long-term average dose, the PD comparison changes with the assumptions about target turnover and effect-site kinetics. These 16 conditions alone cannot determine when intermittent dosing works clinically or which regimen is optimal.
Numerical implementation checks
When the time step was changed from 0.25 h to 0.125 h, the maximum, minimum, mean and time-above-threshold metrics for the reference condition differed by less than 0.001 percentage points. In all conditions the target amount stayed between 0 and 1, and recovery with zero drug effect matched the analytical solution. These checks confirm the numerical implementation, not predictive performance for an actual drug or for patients.
Discussion
Candidate metrics to compare are maximal degradation, pre-dose degradation, the minimum within a fixed period, mean degradation, the integral of degradation, and time above a threshold.
\[ \bar D=\frac{1}{L}\int_{t_0}^{t_0+L}D(t)\,dt,\qquad AUC_D=\int_{t_0}^{t_0+L}D(t)\,dt \]
Over the same evaluation period \(AUC_D=L\bar D\), so there is no point in treating them as competing, independent pieces of information. When dosing intervals differ, the integration window for the AUC must be matched.
\[ T_{D>D^*}=\int_{t_0}^{t_0+L}\mathbf 1\{D(t)>D^*\}\,dt \]
The distributed code uses 80% as a convenient threshold, but it gives no basis for 80% being necessary for ER efficacy. Setting a threshold requires data linking PD and efficacy, validation of predictions under other conditions, and checks of the correlation between candidate metrics.
If tumor volume data are added, natural growth should first be confirmed in the vehicle group, and then a model linking target degradation to downstream responses and the tumor can be considered, distinguishing growth inhibition from cell death and using the full time series at several doses. That was not done here. The required degradation threshold or a tumor kill rate must not be estimated from three TGI values and end-of-study PD alone.
Leaving one dose out within the same study is held-out validation and should be named differently from external validation with an independent study. A fit to group means does not replace PopPK or NLME analysis using individual data.
Behavior outside the monotonic model
The model does not include a hook effect or assume that one must occur at high doses. It therefore cannot describe degradation weakening at high concentrations (3, 4).
Drug retention at the site of action and slow target recovery also cannot be separated by an endpoint degradation measurement alone. Conditions with the same maximal degradation can leave different target amounts before the following dose. With recovery rates left unspecified by the public data, these simulations do not settle the choice between QD and Q2D for a particular drug.
Conclusion
At the same long-term average dose, a higher maximal degradation did not necessarily imply better sustained degradation. This comparison depends on assumed target recovery and effect-site kinetics; it does not identify the optimal dosing interval for an actual drug.
Table 7. Scope of the analysis
| Category | What this article reached |
|---|---|
| Public observations | Divergence between plasma and tumor concentrations; different dose responses for end-of-study ER degradation and TGI |
| Calculated here | Ratios of published concentrations; PD trajectories and metrics under 16 assumed conditions |
| Estimated here | No parameters of an actual drug were estimated |
| Implications that depend on assumptions | Maximal degradation alone may mislead comparisons of dosing frequency; recovery and retention need to be distinguished |
| Questions not yet answerable | The required ER degradation, the optimal interval for an actual drug, target attainment in a patient population, clinical efficacy and safety |
The 16 conditions are assumed PD trajectories, not fitted parameters for an actual drug. Site retention and target recovery cannot be separated from the published endpoint degradation alone. The analysis also does not rank the value of alternative additional measurements.
Data and code availability
Download the analysis code, inputs, results and executed notebook. The figures were created with the code in this article; no figure images from the papers are reproduced.
python -m pip install -r requirements.txt
python analysis.py
data/public-concentrations.csv is a transcription of aggregate values from the text of the papers, and results/regimen-metrics.csv contains the results of the assumed simulations. The two are not to be treated as the same observed data.
References
- Gough SM, Flanagan JJ, Teh J, Andreoli M, Rousseau E, Pannone M, et al. Oral Estrogen Receptor PROTAC Vepdegestrant (ARV-471) Is Highly Efficacious as Monotherapy and in Combination with CDK4/6 or PI3K/mTOR Pathway Inhibitors in Preclinical ER+ Breast Cancer Models. Clinical Cancer Research. 2024;30(16):3549–3563. doi:10.1158/1078-0432.CCR-23-3465. Open full text.
- Acharyya RK, Rej RK, Hu B, Chen Z, Wu D, Lu J, et al. Discovery of ERD-1233 as a Potent and Orally Efficacious Estrogen Receptor PROTAC Degrader for the Treatment of ER+ Human Breast Cancer. Journal of Medicinal Chemistry. 2024;67(21):19010–19037. doi:10.1021/acs.jmedchem.4c01521. Open full text.
- Haid RTU, Reichel A. Transforming the Discovery of Targeted Protein Degraders: The Translational Power of Predictive PK/PD Modeling. Clinical Pharmacology & Therapeutics. 2024;116(3):770–781. doi:10.1002/cpt.3273. Author manuscript.
- Quiroga A, Gutierrez PM, Nyoni L, Cureton N, Lawson M, Smith A, et al. Abstract 5019: Preclinical mechanistic PK/PD/Efficacy modeling for AZD4241, a novel oral estrogen receptor (ER) degrader (PROTAC), to support dose selection during early clinical development. [Conference abstract] Cancer Research. 2026;86(7 Suppl):5019. doi:10.1158/1538-7445.AM2026-5019.
- Yang DZ, Masters JC, Wang H, Tran L, Zhang Y, Lee KC, et al. Population Pharmacokinetics and Exposure–Response Analyses of Vepdegestrant, a First‐in‐Class PROteolysis‐TArgeting Chimera Estrogen Receptor Degrader. The Journal of Clinical Pharmacology. 2026;66(8):e70252. doi:10.1002/jcph.70252. Open full text. The parameters of this model were not used in the simulations reported here.
- US Food and Drug Administration. FDA approves vepdegestrant for ER-positive, HER2-negative, ESR1-mutated advanced or metastatic breast cancer [Internet]. 2026 May 1 [cited 2026 Oct 27]. Approval announcement.