Imlunestrant plasma exposure, tumor evidence and dosing intervals
Observed aggregate PK fitting and a public PopPK reconstruction compare equal-average schedules. Hypothetical delayed filters show why tumor enrichment alone does not identify interval-dependent target effects.
On this page
- Background and objective
- Question and intended use
- Plasma and tumor evidence answer different questions
- Aggregate dose–exposure regression
- Reconstructing public PopPK
- Equal average dose with different intervals
- What approximately 15-fold tumor enrichment means
- Sensitivity to unidentified delay
- Discussion
- Data and code availability
- References
Background and objective
Falling plasma concentration need not mean an equally rapid loss of tumor effect. Conversely, tumor enrichment does not establish that dosing intervals can be extended. Both distribution magnitude and the rates of concentration and effect changes matter.
For the oral selective estrogen receptor degrader, SERD, imlunestrant, I compared public plasma PopPK, human tumor concentrations and preoperative-biopsy pharmacodynamics. Equal-average-dose calculations describe plasma changes, but reported tumor enrichment could not identify preserved action under alternate-day dosing.
Literature was checked on October 20, 2026. US monotherapy approval in 2025 covers specified ESR1-mutant advanced or metastatic breast cancer; combination with abemaciclib was approved in 2026. The approved 400 mg once-daily regimen is the reference, not a regimen this analysis proposes to change (1, 2).
Question and intended use
The question is how changing intervals at an average 400 mg/day changes plasma peaks, predose concentrations and minima of a hypothetical delayed concentration index, and whether human tumor measurements identify that delay. Intended use is conditional model comparison, not prediction of effective tumor concentration, ER-degradation persistence, response or progression-free survival. The 200 mg every 12 hours and 800 mg every 48 hours scenarios assume fasting administration, unchanged formulation and absorption, and time-invariant PK.
Plasma and tumor evidence answer different questions
Table 1. Scope of public information.
| Source | Available evidence | Not established here |
|---|---|---|
| FDA and EMA assessments | Plasma PopPK coefficients, variability and dose-level summaries | New individual-level NLME fitting |
| EMBER-2 preoperative study | Tumor/plasma comparison and pre/post ER, PR and Ki-67 | Human tumor concentrations and ER recovery after interruption |
| Preclinical mechanistic studies | Animal tumor exposure and effect time courses | Human tumor elimination or alternate-day efficacy |
I distinguish a small aggregate-data regression, reconstruction of published PopPK, and sensitivity scenarios with unidentified time constants (3, 4).
Aggregate dose–exposure regression
Observed Day-15 summaries come from EMA Table 8. AUC and Cmax have different sample counts.
Table 2. Observed aggregate Day-15 PK.
| Daily dose | Geometric mean AUC0–24 (ng·h/mL), n | Geometric mean Cmax (ng/mL), n |
|---|---|---|
| 200 mg | 894, 14 | 62.3, 19 |
| 400 mg | 2,480, 19 | 164, 21 |
| 600 mg | 3,390, 9 | 204, 18 |
| 800 mg | 3,670, 14 | 247, 15 |
\[ \log E_D=\alpha+\beta\log(D/400) \]
I fitted each endpoint separately, with \(E_D\) its group geometric mean. Working standard errors were \(s=\sqrt{\log(1+CV^2)/n}\), with CV as a fraction, minimizing squared log residuals divided by \(s^2\). This approximates log-normal within-group endpoints and between-group independence.
Estimated dose exponents were 1.039 for AUC and 1.009 for Cmax, descriptively consistent with approximate proportionality. Four-group weighted regression is neither individual NLME nor a nonlinearity test and does not clinically validate 800 mg alternate-day administration. Cohort differences and small samples remain; no clinical confidence interval is assigned to this descriptive fit.
Reconstructing public PopPK
The published structure is two-compartment disposition with transit absorption. The FDA's Vc/F of 8,120 L must be adjusted for the advanced/metastatic breast-cancer population. At fixed weight 68.2 kg:
\[ (V_c/F)_{\mathrm{mBC}}=8120(1-0.469)=4311.72\ \mathrm{L} \]
EMA likewise reports approximately 4,310 L in this population.
Table 3. Reconstruction coefficients.
| Parameter | Value |
|---|---|
| CL/F | 166 L/h |
| Q/F | 256 L/h |
| Vc/F, mBC | 4,311.72 L |
| Vp/F | 2,280 L |
| Mean transit time, MTT | 1.84 h |
The main implementation uses three serial input states \(B_1,B_2,B_3\), with \(k_{tr}=3/MTT\):
\[ \dot B_1=-k_{tr}B_1,\quad \dot B_j=k_{tr}(B_{j-1}-B_j)\quad(j=2,3), \]
\[ \dot A_c=k_{tr}B_3-\frac{CL/F+Q/F}{V_c/F}A_c +\frac{Q/F}{V_p/F}A_p, \]
\[ \dot A_p=\frac{Q/F}{V_c/F}A_c-\frac{Q/F}{V_p/F}A_p, \qquad C_p=\frac{1000A_c}{V_c/F}. \]
Dose in mg enters \(B_1\); time is hours, volume liters and concentration ng/mL. Apparent parameters already incorporate bioavailability, so the label's approximately 10% absolute F is not applied again. Amount states are computational quantities in this oral parameterization.
This reconstructs descriptions and coefficients, not the original NONMEM code. MTT is explicitly the total mean residence time across input states. With the same MTT and one, three or four states, 400 mg QD Cmax was 130.6, 138.4 and 140.5 ng/mL; alternate-day/daily peak ratios were 1.361, 1.395 and 1.402. Direction persisted without clinical validation of the absorption implementation.
Checking absolute values
Reconstructed terminal half-life was 29.99 h, close to the reported 30 h. At 400 mg QD, AUC0–24 was 2,409.6 ng·h/mL and Cmax 138.4 ng/mL, respectively 0.972 and 0.844 times the observed summaries of 2,480 and 164.
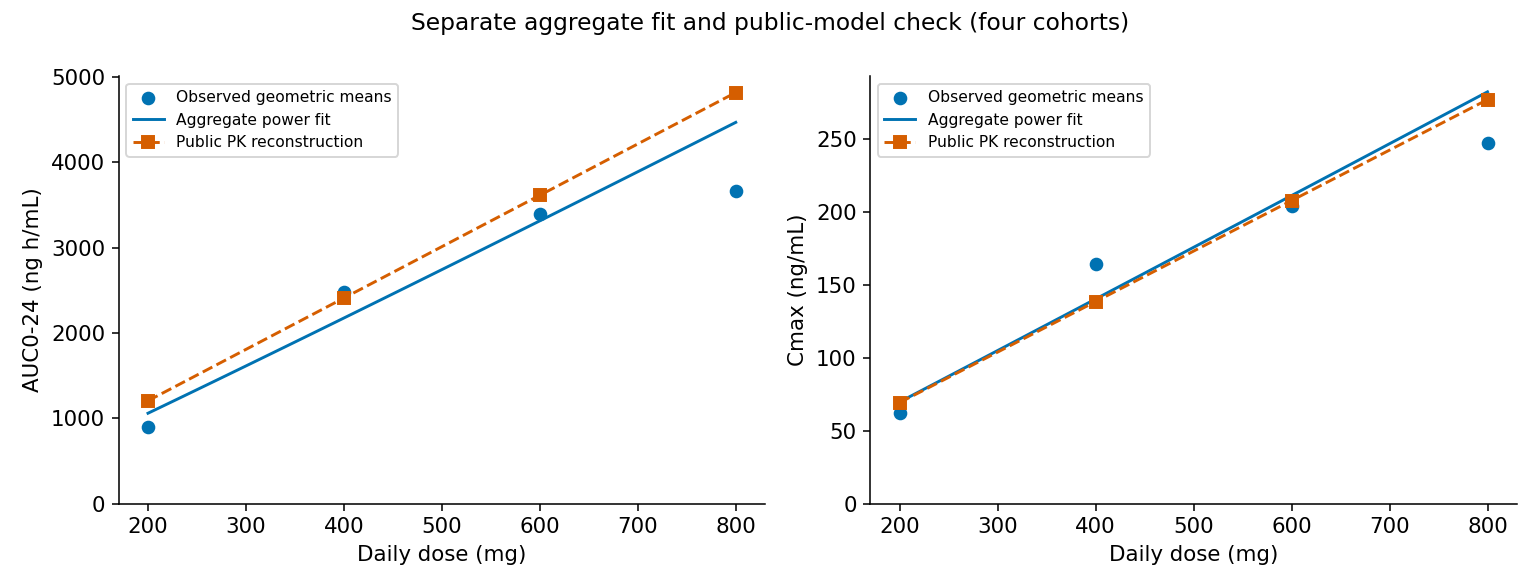
Figure 1. Observed aggregate PK compared with regression and reconstruction.
At 200 and 800 mg, AUC was 1.35 and 1.31 times the observed summaries. The reconstruction does not reproduce every group with equal accuracy. Original trial data also contributed to the published model, making this an implementation and summary check, not independent external validation. Agreement with a population average does not validate individual PK.
Equal average dose with different intervals
Periodic steady state was compared over a common 48-hour window:
\[ AUC_{48}=\frac{48}{\tau}\frac{1000D}{CL/F}. \]
Equal \(D/\tau\) gives equal AUC under linear time-invariant PK, a model property rather than clinical equivalence.
Table 4. Periodic steady-state schedules with equal average dose.
| Hypothetical schedule | Plasma Cmax (ng/mL) | Plasma predose (ng/mL) | AUC48 (ng·h/mL) |
|---|---|---|---|
| 200 mg Q12h | 114.3 | 86.0 | 4,819.3 |
| 400 mg Q24h | 138.4 | 71.7 | 4,819.3 |
| 800 mg Q48h | 193.1 | 51.8 | 4,819.3 |
Alternate-day dosing produces a higher peak and lower predose value at the same mean concentration. With delayed absorption, the strict plasma minimum can occur slightly after dosing. This table reports predose values; the delayed-index analysis below searches the entire interval for minima.
What approximately 15-fold tumor enrichment means
EMBER-2 reports Day-15 tumor concentrations in ten participants receiving 200–800 mg QD at approximately 15 times same-day predose plasma concentration, with a range of 5–31 (5).
Tumor values in the corresponding figure use µg/kg and plasma µg/L. This is a reported enrichment measure, not an equilibrium unbound partition coefficient. Tumor collection times do not form a matched postdose time series, so approximately 15 cannot identify tumor elimination half-life. The 5–31 range is not a confidence interval (6, original Figure 3E).
Table 5. Preoperative ER and Ki-67 changes.
| Daily dose | ER-evaluable participants | Geometric mean ER change (90% CI) | Geometric mean Ki-67 change in all evaluable participants |
|---|---|---|---|
| 200 mg | 22 | −89% (−96 to −72) | −69% |
| 400 mg | 27 | −82% (−91 to −60) | −71% |
| 800 mg | 26 | −70% (−78 to −59) | −72% |
ER reductions were not monotonic by dose, and 200 mg was a subsequently added nonrandomized cohort. These summaries establish neither low-dose superiority nor concentration–effect EC50. Participants had untreated early breast cancer and approximately two weeks of preoperative treatment, a different population from approved advanced disease (5, original Table 2).
The measurements support drug arrival in human tumors and biological changes. They do not measure the rate of ER or proliferation-marker recovery after extending an interval.
Sensitivity to unidentified delay
Introduce a hypothetical concentration index \(X\) lagging plasma:
\[ \dot X=k_e(C_p-X),\qquad t_{1/2,e}=\frac{\log2}{k_e}. \]
This effect compartment has plasma concentration units. It is neither total nor unbound tumor concentration nor ER abundance. Its equilibration half-time is not tumor elimination half-life.
I assumed 2, 12 or 48 h to compare buffering. These were neither estimated from human data nor transplanted from mice. Multiplying by a constant enrichment factor cancels in between-schedule ratios of the same index. Thus multiplying by 15 supplies no missing information about interval sensitivity.
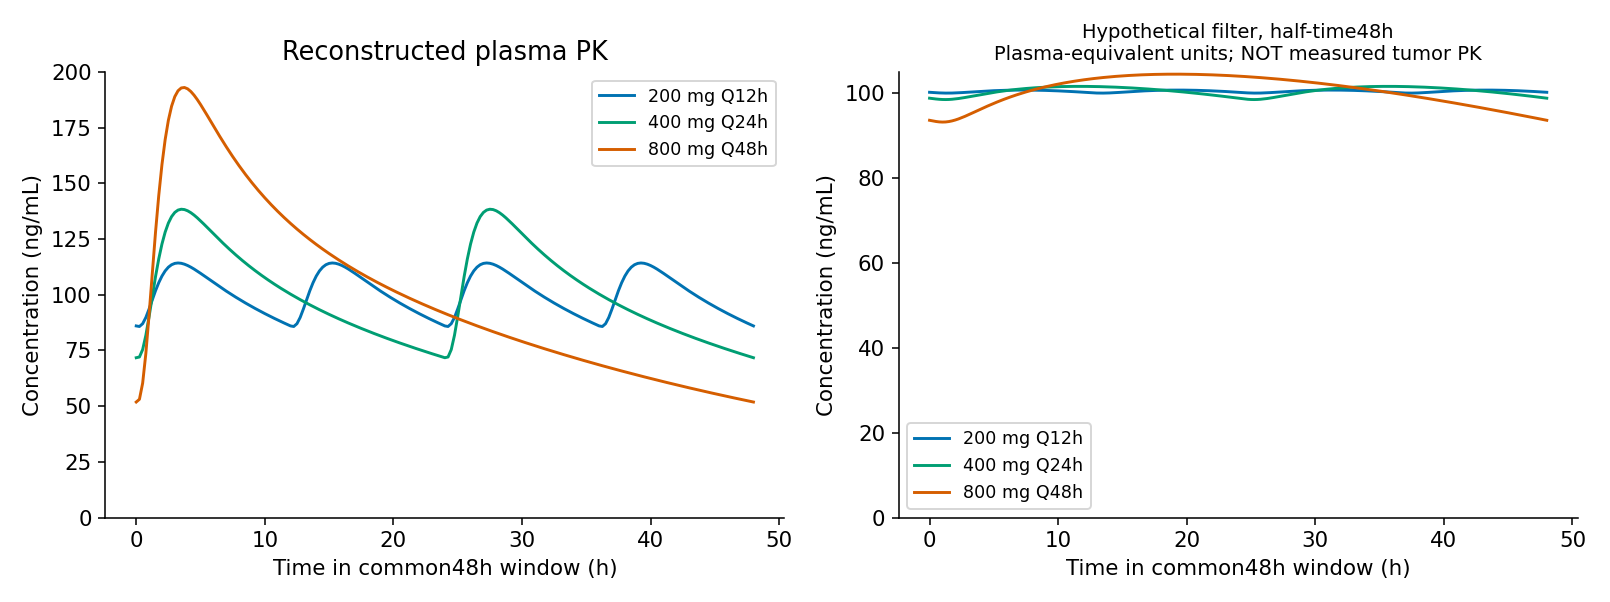
Figure 2. Plasma and a hypothetical delayed index, not predicted human tumor PK. Slower equilibration smooths fluctuations.
Conditional individual variability
Published IIV CV values for CL/F, Vc/F and MTT were 50.5%, 69.1% and 47.7%. I converted these using \(\omega^2=\log(1+CV^2)\), retained a CL–Vc log-effect correlation of 0.618 and generated 1,024 paired virtual individuals.
Weight is fixed at 68.2 kg and the population effect at mBC. F interoccasion variability of 35.4%, residual error and fixed-effect estimation uncertainty are omitted. MTT random effects are independent of the others. This conditional distribution does not represent the full patient population.
Table 6. Paired ratios: 800 mg Q48h versus the same individual's 400 mg Q24h.
| Endpoint | Median | Virtual-individual 5th–95th percentiles |
|---|---|---|
| Plasma Cmax | 1.392 | 1.191–1.652 |
| Plasma predose | 0.730 | 0.553–0.847 |
| Minimum hypothetical index: equilibration half-time 2 h | 0.728 | 0.546–0.847 |
| Same: 12 h | 0.821 | 0.695–0.905 |
| Same: 48 h | 0.947 | 0.911–0.972 |
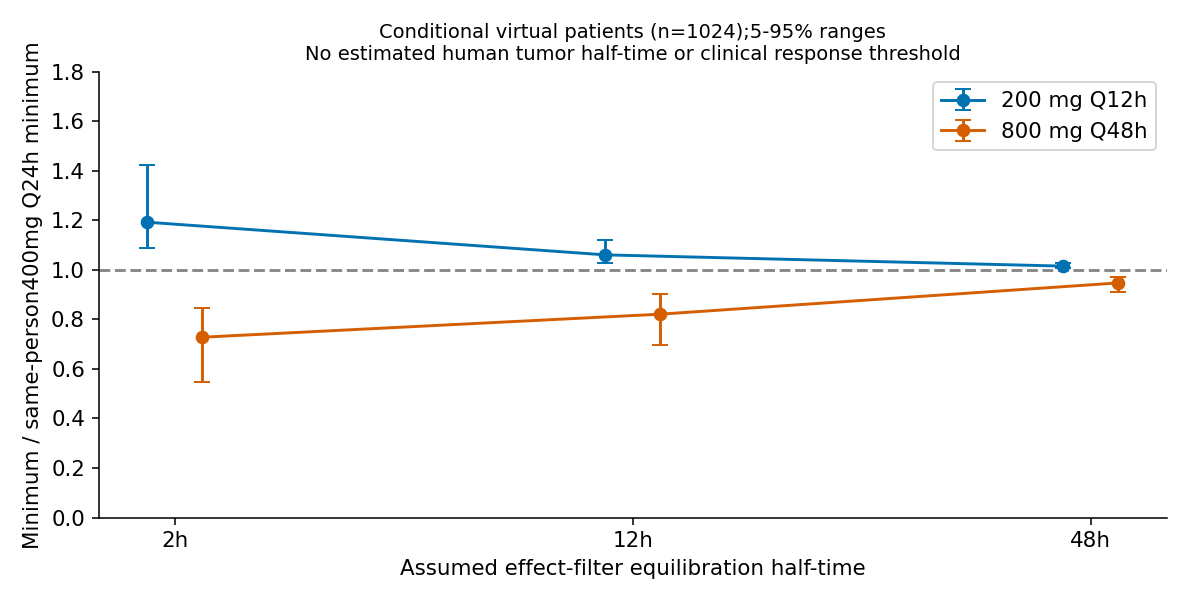
Figure 3. Minimum-ratio sensitivity to assumed equilibration half-time.
Percentiles describe conditional between-individual variability, not confidence intervals or clinically validated effect predictions. An index ratio of 0.947 does not mean preserving 94.7% of ER degradation or efficacy.
Buffering requires rate information
For a sinusoidal input with period \(T\), this linear filter has amplitude ratio:
\[ G(T)=\frac{1}{\sqrt{1+(2\pi/(Tk_e))^2}} \]
Reducing a 48-hour-period component to one-quarter or less requires an equilibration half-time of approximately 20.51 h or longer. This is a first-harmonic mathematical condition, not a bound on an arbitrary waveform, a necessary tumor-effect condition or a clinical tolerance criterion. A relevant time scale is needed in addition to enrichment magnitude.
Discussion
Predose plasma and surgical tumor measurements inform enrichment but not post-last-dose concentration decline or ER recovery. Total versus unbound concentrations and ER versus proliferation are different quantities.
I did not convert preclinical persistence up to 96 hours after the last dose into a human recovery coefficient. Continued ER suppression during treatment in cultured cells also differs from recovery after washout (6, 7).
Equal-average alternate-day dosing increased modeled plasma peaks and reduced predose concentrations. How much human tumors buffer those changes remains unidentified by the public measurements. Enrichment alone therefore cannot establish preserved alternate-day action.
Data and code availability
Calculations used Python, NumPy, SciPy, pandas and Matplotlib. Periodic solutions were evaluated every 0.25 h and checked with finer grids and an independent ODE solution. The distribution contains inputs, original code and generated figures and tables, not original-paper figures or individual data.
Download code, inputs, tables and rerun instructions.
References
- US Food and Drug Administration. FDA approves imlunestrant for ER-positive, HER2-negative, ESR1-mutated advanced or metastatic breast cancer. 2025. Approval announcement.
- Eli Lilly and Company. INLURIYO (imlunestrant) tablets: US prescribing information. Revised 2026 Sep. FDA label.
- US Food and Drug Administration. INLURIYO (imlunestrant), NDA 218881: Multi-Discipline Review. 2025. Table 19.2, PDF pp. 242–243. Review.
- European Medicines Agency. Inluriyo: EPAR public assessment report. 2025. Tables 8–9 and population PK assessment. Report.
- Neven P, Stahl N, Vidal M, Martín M, Kaufman PA, Harbeck N, et al. A Preoperative Window-of-Opportunity Study of Oral SERD, Imlunestrant, in Newly Diagnosed ER-Positive, HER2-Negative Early Breast Cancer: Results from the EMBER-2 Study. Clinical Cancer Research. 2024;30(23):5304–5313. doi:10.1158/1078-0432.CCR-24-2113.
- Bhagwat SV, Mur C, Vandekopple M, Zhao B, Shen W, Marugán C, et al. Imlunestrant Is an Oral, Brain-Penetrant Selective Estrogen Receptor Degrader with Potent Antitumor Activity in ESR1 Wild-Type and Mutant Breast Cancer. Cancer Research. 2025;85(4):777–790. doi:10.1158/0008-5472.CAN-24-2608.
- Sherman S, Sandusky ZM, Russo D, Zak D, Nardone A, Friel D, et al. Imlunestrant a next-generation oral SERD overcomes ESR1 mutant resistance in estrogen receptor–positive breast cancer. JCI Insight. 2025;10(12):e188051. doi:10.1172/jci.insight.188051.