Giredestrant dosing intervals, aggregate PK and limits of translation
An aggregate PK surrogate is fitted and checked against unused repeated-dose summaries. Conditional virtual patients compare equal-average-dose schedules without claiming heart-rate benefit or preserved efficacy.
On this page
- Background and objective
- Question and intended use
- Fitting single-dose summaries and retaining repeated-dose checks
- Overprediction in unused repeated-dose summaries
- Equal average dose changes concentration fluctuation
- Lower peaks do not establish less bradycardia
- Preserved target effect is also unestablished
- Discussion
- Data and code availability
- References
Background and objective
Equal average daily dose gives equal steady-state mean concentration under linear, time-invariant PK with unchanged bioavailability. Peaks and predose concentrations can still differ. Whether those differences improve efficacy or adverse events requires separate evidence.
I fitted a small model to public single-dose summaries for the oral selective estrogen receptor degrader, SERD, giredestrant, checked it against repeated-dose summaries, and compared hypothetical 15 mg every 12 hours, 30 mg every 24 hours and 60 mg every 48 hours. Splitting doses lowered calculated peaks but did not establish less bradycardia.
Literature and development status were checked on October 19, 2026. Giredestrant was investigational; Roche announced publication of phase III evERA results in October. This article neither reanalyzes clinical outcomes nor selects a treatment regimen (1).
Question and intended use
The question is how interval changes affect peaks and predose concentrations at an average 30 mg/day, and whether public evidence connects those changes to target effects or heart rate. Intended use is exploration of public aggregate PK, not patient treatment or trial-dose selection. The 15 mg split and 60 mg alternate-day conditions are mathematical scenarios without established tablet divisibility, adherence or efficacy.
Fitting single-dose summaries and retaining repeated-dose checks
Inputs come from Malhi and colleagues' Table 1 and Table 2 (2). They are aggregate NCA measurements in advanced breast cancer, not individual concentration records. Only four summaries from six participants receiving a single 30 mg dose were fitted. Other doses and repeated-dose values were excluded from fitting.
Table 1. Single-dose 30 mg inputs.
| Input | Geometric mean | Geometric CV |
|---|---|---|
| Cmax | 177 ng/mL | 23.5% |
| AUC0–24 | 2,100 ng·h/mL | 26.4% |
| AUC0–∞ | 5,090 ng·h/mL | 30.1% |
| Terminal half-life | 43.0 h | 14.7% |
This is new estimation from summaries, not transplantation of a published PopPK model or individual-level NLME fitting. Geometric means of several endpoints need not all arise from one typical individual's PK.
Model and estimation
I used first-order absorption and two-compartment disposition:
\[ \frac{dA_g}{dt}=-k_aA_g, \]
\[ \frac{dA_c}{dt}=k_aA_g-\frac{CL/F}{V_c/F}A_c -\frac{Q/F}{V_c/F}A_c+\frac{Q/F}{V_p/F}A_p, \]
\[ \frac{dA_p}{dt}=\frac{Q/F}{V_c/F}A_c-\frac{Q/F}{V_p/F}A_p, \qquad C=\frac{1000A_c}{V_c/F}. \]
Dose in mg is added to \(A_g\). Time is hours, volumes liters and concentration ng/mL. Apparent parameters already include bioavailability, so absolute \(F\) is not multiplied separately. Compartment amounts are computational quantities in this oral parameterization, not measured amounts in the body.
With \(k_a=1\ \mathrm{h}^{-1}\) fixed, CL/F, Vc/F, Q/F and Vp/F were fitted by least squares on a log scale. Working weights used \(\sqrt{\log(1+CV^2)/n}\), with CV expressed as a fraction. Unknown covariances between summaries from the same participants prevent treating this as a full likelihood or using it for likelihood-based intervals or model-selection tests.
Table 2. Fitted coefficients.
| Parameter | Estimate |
|---|---|
| CL/F | 5.894 L/h |
| Vc/F | 117.5 L |
| Q/F | 15.40 L/h |
| Vp/F | 197.0 L |
| ka | Fixed at 1 h⁻¹ |
A one-compartment model with the same ka could not match all four summaries simultaneously. Its Cmax was 122.4 ng/mL, AUC0–24 2,485.9 ng·h/mL, AUC0–∞ 7,426.5 ng·h/mL and half-life 39.1 h.
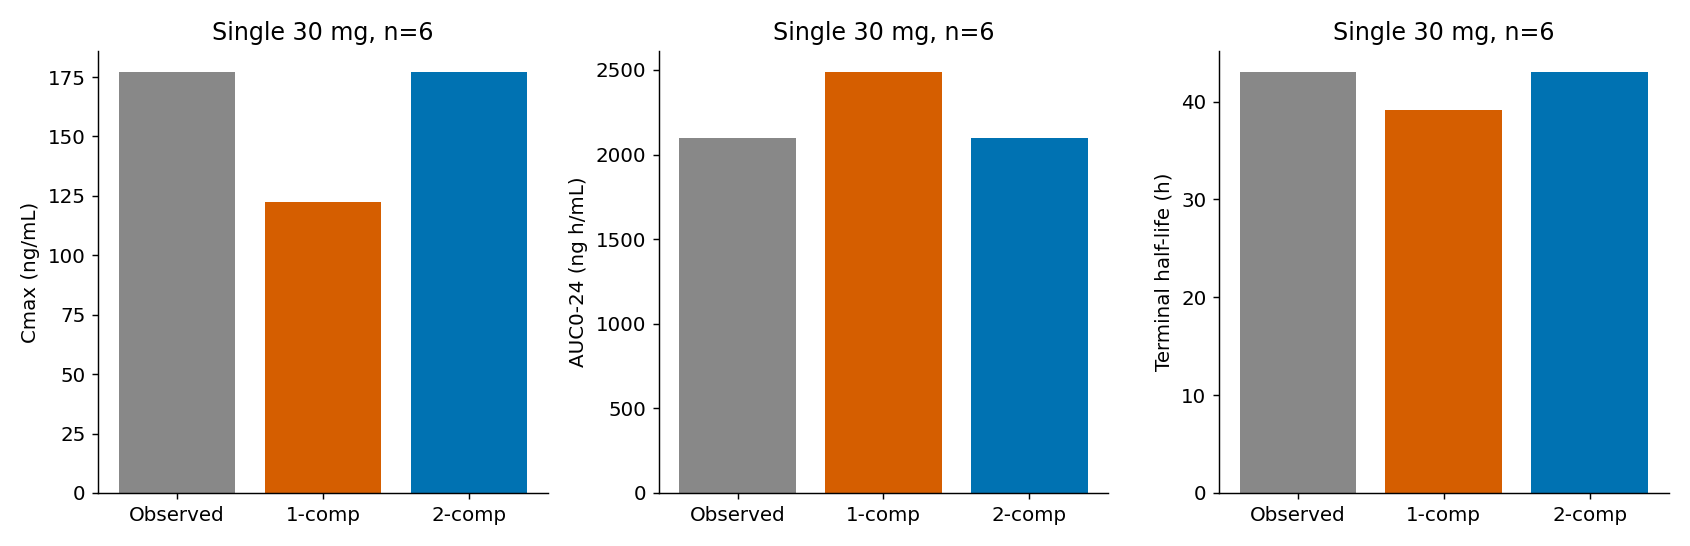
Figure 1. Fits to single-dose summaries. Matching four endpoints with four free coefficients is not independent validation and leaves no residual degrees of freedom. The figure displays Cmax, AUC0–24 and half-life; AUC0–∞ is listed above. This constructs a candidate structure accommodating both peak and terminal tail. Absorption is not uniquely identified.
Overprediction in unused repeated-dose summaries
Comparison with ten participants receiving repeated 30 mg doses uses the original Table 2 (2).
Table 3. Repeated-dose summaries excluded from fitting.
| Endpoint | Published geometric mean | Model | Model/published |
|---|---|---|---|
| Cmax,ss (ng/mL) | 266 | 322.5 | 1.21 |
| AUC0–24,ss (ng·h/mL) | 4,320 | 5,090 | 1.18 |
| Cycle 2 Day 1 predose concentration (ng/mL) | 130 | 150.8 | 1.16 |
Overprediction was 16–21% near 30 mg. At repeated doses of 10, 90 and 250 mg, Cmax ratios were 1.48, 1.35 and 1.98. Simple dose-proportional extrapolation from single-dose 30 mg therefore does not adequately reproduce absolute values across higher doses.
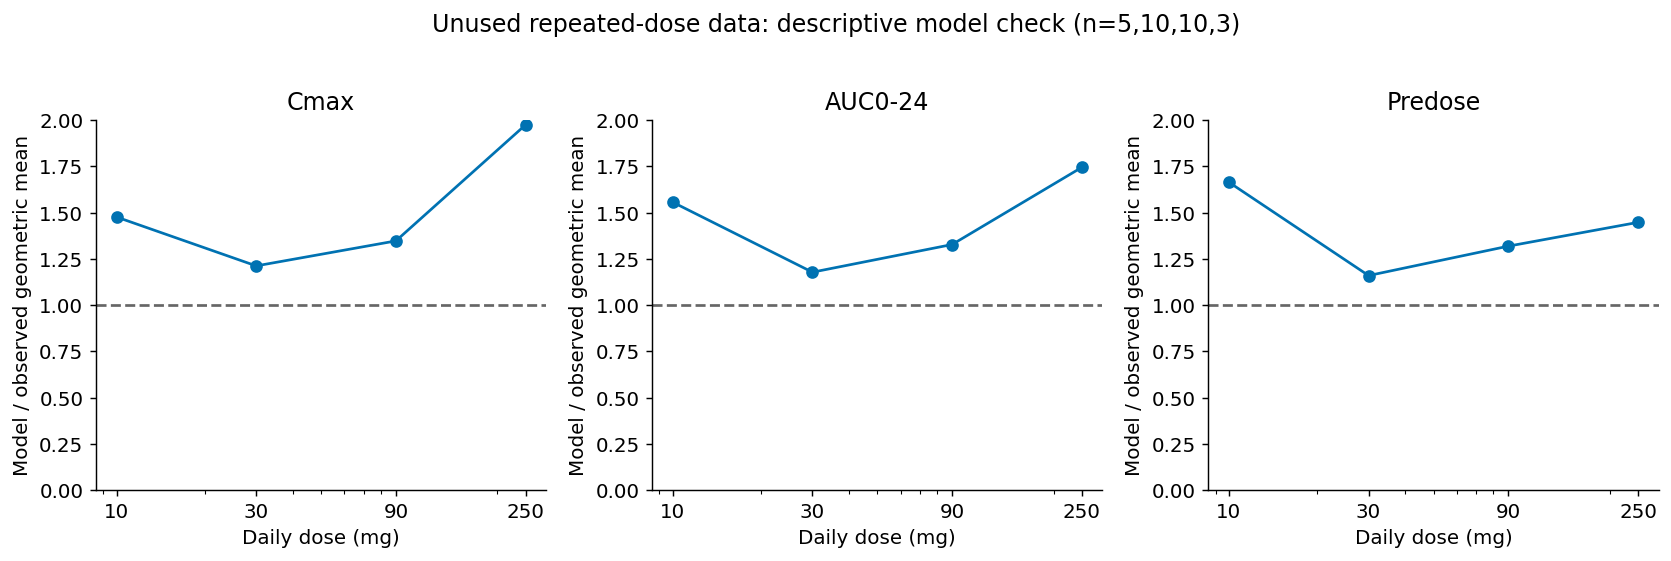
Figure 2. Model-to-published ratios for repeated-dose endpoints excluded from fitting.
The original paper's approximately dose-proportional finding does not establish the accuracy of this simplified model at every dose. Cohort differences, small samples, aggregation, variability and model structure could contribute; no specific time-dependent clearance or nonlinear-absorption explanation is established here.
These are additional summaries from the same trial, not participant-disjoint or external validation. Endpoint-specific sample counts also differ, so dividing geometric means from different groups does not reconstruct individual accumulation. Interval comparisons below are conditional relative comparisons under this structure and linearity assumption.
Equal average dose changes concentration fluctuation
All comparisons use periodic steady state, the same formulation, apparent F and absorption rate, and time-invariant parameters. A common 48-hour window aligns AUC across 12-, 24- and 48-hour intervals:
\[ AUC_{48}=\frac{48}{\tau}\frac{1000D}{CL/F}. \]
Equal \(D/\tau\) gives equal AUC48 algebraically, not as a new clinical discovery.
Table 4. Periodic steady-state comparisons at equal average dose.
| Hypothetical schedule | Cmax (ng/mL) | Predose concentration (ng/mL) | AUC48 (ng·h/mL) |
|---|---|---|---|
| 15 mg Q12h | 253.5 | 173.1 | 10,180 |
| 30 mg Q24h | 322.5 | 150.8 | 10,180 |
| 60 mg Q48h | 471.3 | 121.4 | 10,180 |
Relative to daily dosing, splitting lowers the peak and raises the predose concentration; alternate-day dosing does the reverse. An approximately 43-hour half-life does not eliminate peak–trough differences with alternate-day dosing.
Conditional virtual individuals
Without individual PK or a published covariance matrix, I did not estimate a population model. I generated 2,048 virtual individuals varying only CL/F:
\[ (CL/F)_i=(CL/F)_{\mathrm{fit}}\exp(\eta_i), \qquad\eta_i\sim N\{0,\log(1+CV_{CL}^{2})\}. \]
CV values of 30% or 60% are assumptions, not direct substitutions of aggregate PK variability for IIV. Median clearance equals the fitted value. The same individuals receive every schedule in paired comparisons; volumes, absorption, covariates and measurement error are not varied.
Table 5. Paired schedule ratios with clearance CV=60%, relative to 30 mg Q24h.
| Endpoint | Median | Virtual-individual 5th–95th percentiles |
|---|---|---|
| 15 mg Q12h: Cmax | 0.787 | 0.651–0.891 |
| 15 mg Q12h: predose | 1.147 | 1.061–1.331 |
| 60 mg Q48h: Cmax | 1.460 | 1.234–1.740 |
| 60 mg Q48h: predose | 0.806 | 0.633–0.911 |
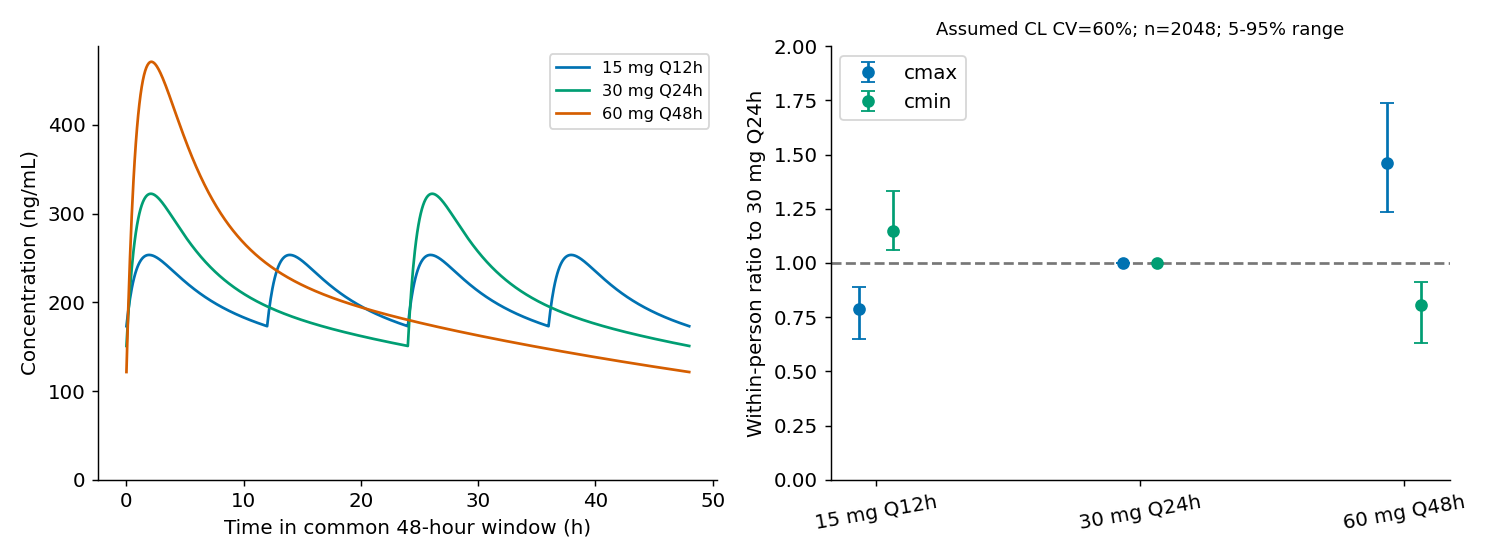
Figure 3. Periodic concentrations and conditional paired schedule ratios.
These assumed between-individual ranges are neither confidence intervals nor prediction intervals validated in patients. CV30% outputs are also distributed. Aggregate-fit parameter uncertainty is not propagated as a distribution.
Refitting with ka fixed at 0.5, 2 or 4 h⁻¹ gave 30 mg Q24h Cmax of 320.9–326.2 ng/mL but single-dose Tmax of 0.92–2.74 h. The published median was 1.75 h. Thus absorption timing remains incompletely identified. The interval-comparison direction persisted in this sensitivity range, without covering all structural uncertainty.
Lower peaks do not establish less bradycardia
The clinical paper reports bradycardia during monotherapy regardless of attribution (3, original Table 2).
Table 6. Recorded bradycardia in once-daily cohorts.
| Daily dose cohort | Bradycardia |
|---|---|
| 10 mg | 0/6 |
| 30 mg | 3/41 |
| 90/100 mg, pooled in the paper | 6/55 |
| 250 mg | 2/9 |
Small nonrandomized cohort counts cannot supply individual concentration–response curves. The 30 mg group includes a grade 2 event attributed to concomitant beta-blocker and digoxin. Follow-up and background differences also prevent predicting rates for a new interval from these counts.
The ECG analysis found no clear acute dose- or exposure-dependent heart-rate change after the first dose, but an exposure-associated reduction at steady state stabilizing after Day 15 (4). That delay complicates a peak-only explanation. Published QTc coefficients cannot substitute for heart-rate coefficients. The examined public materials did not provide individual time series and coefficients sufficient to estimate heart-rate EC50 or delay kinetics. A 2026 zebrafish study supports nuclear ER signaling involvement, not reduced human bradycardia from split dosing (5).
If a slow response is driven mainly by average exposure, moving peaks without changing average exposure might have little heart-rate benefit. This remains a hypothesis, not a result of the PK calculation.
Preserved target effect is also unestablished
FES-PET reported greater-than-90% tracer-uptake reduction in 11 of 14 evaluable participants. That does not identify the slope or EC50 of a concentration–effect relationship, establish sufficient effect at hour 48 under alternate-day dosing, or provide a clinical-efficacy threshold (3, 6).
Public summaries cannot jointly identify within-individual concentration–heart-rate relationships and adaptation toward Day 15. The present model therefore cannot separate peak-driven from delayed average-exposure effects or determine whether lower troughs alter target action.
Discussion
A simplified structure could match single-dose peak and terminal summaries, but overpredicted unused repeated-dose measurements and was inadequate for precise absolute concentrations. Conditional on its limitations, splitting equal average dose lowered peaks and alternate-day dosing lowered predose concentrations.
The analysis establishes neither less bradycardia with splitting, preserved action with alternate-day dosing nor a clinically optimal regimen. Aggregate-data PK calculation and decisions requiring individual PK/PD remain separate.
Data and code availability
Calculations used Python, NumPy, SciPy, pandas and Matplotlib. Inputs, code, tables and figure-generation instructions are distributed. Original figures, individual records and conditionally accessed materials are not redistributed.
Download code, inputs, tables and rerun instructions.
References
- Roche. Roche’s giredestrant combination significantly improved progression-free survival in ER-positive advanced breast cancer in phase III evERA data published in The New England Journal of Medicine. 2026 Oct 1. Announcement.
- Malhi V, Agarwal P, Gates MR, Liu L, Wang J, De Bruyn T, et al. Optimizing Early-stage Clinical Pharmacology Evaluation to Accelerate Clinical Development of Giredestrant in Advanced Breast Cancer. Cancer Research Communications. 2023;3(12):2551–2559. doi:10.1158/2767-9764.CRC-23-0324.
- Jhaveri KL, Bellet M, Turner NC, Loi S, Bardia A, Boni V, et al. Phase Ia/b Study of Giredestrant ± Palbociclib and ± Luteinizing Hormone-Releasing Hormone Agonists in Estrogen Receptor–Positive, HER2-Negative, Locally Advanced/Metastatic Breast Cancer. Clinical Cancer Research. 2024;30(4):754–766. doi:10.1158/1078-0432.CCR-23-1796.
- Brooks L, Dolton M, Langenhorst J, Yoshida K, Lien YTK, Malhi V, et al. Concentration QTc analysis of giredestrant: Overcoming QT/heart rate confounding in the presence of drug‐induced heart rate changes. Clinical and Translational Science. 2023;16(5):823–834. doi:10.1111/cts.13491.
- Basu S, Rosas Diaz AN, Narvaez-Paliza JM, Curtin C, Kurella S, Urias M, et al. Selective Estrogen Receptor Degraders Induce Bradycardia by Modulating Nuclear Estrogen Signaling. JACC: Basic to Translational Science. 2026;11(2):101454. doi:10.1016/j.jacbts.2025.101454.
- Lim E, Yu J, Li C, Shah MD, Eng-Wong J, Pérez-Moreno PD, et al. Optimizing dose selection in oncology: the rationale for the clinical dose selection of giredestrant, an oral selective estrogen receptor degrader. Expert Opinion on Investigational Drugs. 2026;35(1):19–28. doi:10.1080/13543784.2026.2613290.