When does individual information improve PK/PD prediction?
A reanalysis of warfarin PK/PCA data, revised with an absorption lag and a Hill exponent: effect delay, held-out prediction and the limits of extra PK.
Key findings
- In 32 subjects with public single-dose warfarin PK and PCA data, a turnover model described the delay between concentration and response better than direct inhibition (held-out RMSE 0.0827 vs 0.0987 at the 24 h cutoff); version 1.1 added an absorption lag and version 1.2 a Hill exponent (1.28).
- Adding each subject's PK measurements up to 24 or 48 h did not improve later PCA prediction: paired MSE differences were +0.0077 (0.0003 to 0.0174) and +0.0051 (−0.0013 to 0.0114), worse at 24 h.
- The Hill exponent improved the in-sample fit but not held-out prediction; every refit starts from generic values after 20 of 67 version 1.0 PK refits were found not to have moved; nothing here supports a dose, INR target or bleeding-risk claim.
On this page
- A warfarin reanalysis of the value of limited PK measurements
- The decision question
- Audit the observations before fitting
- The minimum models
- What the fit and diagnostics show
- Does limited PK information help a held-out subject?
- A paired dose experiment, with information available at the right time
- Numerical checks and uncertainty
- What can be concluded?
- Sources and reproducibility
A warfarin reanalysis of the value of limited PK measurements
Revised 20 October 2026 (version 1.2). Both PD models now estimate the Hill exponent instead of fixing it to one. It improved the in-sample turnover fit (objective function −17.3 for one parameter) but not held-out population prediction (RMSE 0.0827 vs 0.0807), and limited PK now worsens later PCA prediction at the 24 h cutoff with an interval that excludes zero. The version 1.1 results are kept in the companion archive.
Version 1.1 (19 October 2026). The PK model now includes an absorption lag time with between-subject variability. Version 1.0 had no lag; four independent AI-agent reanalyses of the same data all added one, and it lowered the PK objective function by about 198. Every refit (cross-validation folds, bootstrap resamples, sensitivity runs) now starts from generic initial values rather than the full-data estimates; in version 1.0, 20 of 67 PK refits had not moved from those estimates. The conclusions are unchanged in direction: limited PK still does not improve later PCA prediction, and now points slightly further towards worse prediction. The version 1.0 results are kept in the companion archive.
Additional concentration measurements did not improve prediction of subsequent prothrombin complex activity (PCA) in this reanalysis; at the 24 h cutoff they made it worse. A turnover model described the delay between concentration and response better than direct inhibition, but more PK information was not enough to recover individual PD sensitivity. This is an exploratory assessment of publicly distributed observations, not a dosing recommendation.
日本語要約: 公開された単回投与の個人別PK/PCAデータを解析した。第1.1版でPKモデルに吸収の遅れ(ラグタイム)とその個人差を加え、すべての再推定を全データの推定値ではない初期値から行うよう改めた。第1.2版では、阻害曲線の傾き(Hill係数)も推定した。傾きは当てはまりを改善したが、未使用の被験者での予測は改善しなかった。作用の遅れを表現するturnoverモデルはdirect-effectモデルより良好だった。一方、24・48時間までの濃度情報を追加しても、その後のPCA予測は改善せず、24時間の区切りでは悪化した。個別化の価値は情報量だけでなく、何の個人差を測定できるかに依存する。推定警告が残るため、投与条件比較は探索的な感度分析と位置づける。
The decision question
Can weight or limited postdose PK observations reduce uncertainty in a person's later PD response? The context of use is a research evaluation of the value of information under a single oral challenge. PCA is an activity measure. It is not interchangeable with a measured INR, a bleeding probability, or a therapeutic target. The work does not address chronic anticoagulant treatment.
The distinction matters: better concentration prediction need not imply better response prediction. PK variability and PD sensitivity are different quantities. A repeat-challenge simulation can explore this distinction, but it cannot establish benefit to patients.
Audit the observations before fitting
The nlmixr2data documentation describes a 32-subject warfarin dataset. I acquired a pinned upstream commit, saved source hashes, and checked the numerical records against the University of Auckland original-data download. That page also supplies a separate simulated dataset; it was not used here. All seven numerical columns match exactly, and endpoint and sex recodings match.
| Audit item | Actual input / treatment |
|---|---|
| Subjects / records | 32 / 515; documentation states 519 records |
| Dose / PK / PCA records | 32 / 251 / 232 |
| Administration | One oral dose per subject, approximately 1.5 mg/kg |
| Concentration / time units | mg/L / h |
| Measured PCA baselines | 30; values range from 82 to 100 |
| Primary PD likelihood | 188 postbaseline observations in those 30 subjects |
| Missing baseline | Two subjects excluded from PD, retained for PK |
| Zero concentrations | Four observations at 0.5 h, retained; no supplied LLOQ |
| Repeated PK time keys | Four in one subject, with different values; retained |
Each PCA observation was divided by that subject's measured baseline. The baseline itself was then excluded from the PD likelihood: using it both as a fixed normalizer and a residual observation would artificially lower the residual variance. Normalization still propagates baseline assay error and creates within-subject correlation that this minimal residual model does not represent. One subject has no PCA beyond 48 h, so the 48 h validation contains 29 subjects rather than 30. No later response was imputed.
The administered dose already depends on weight. This is not an experiment contrasting randomly assigned fixed and weight-based doses. Age, sex and genotype effects were not searched. Individual trial provenance, duplicate-sample provenance, assay censoring and interoccasion variability are not supplied. Upstream package licensing and acquisition information accompany the code; raw records are acquired rather than bundled.
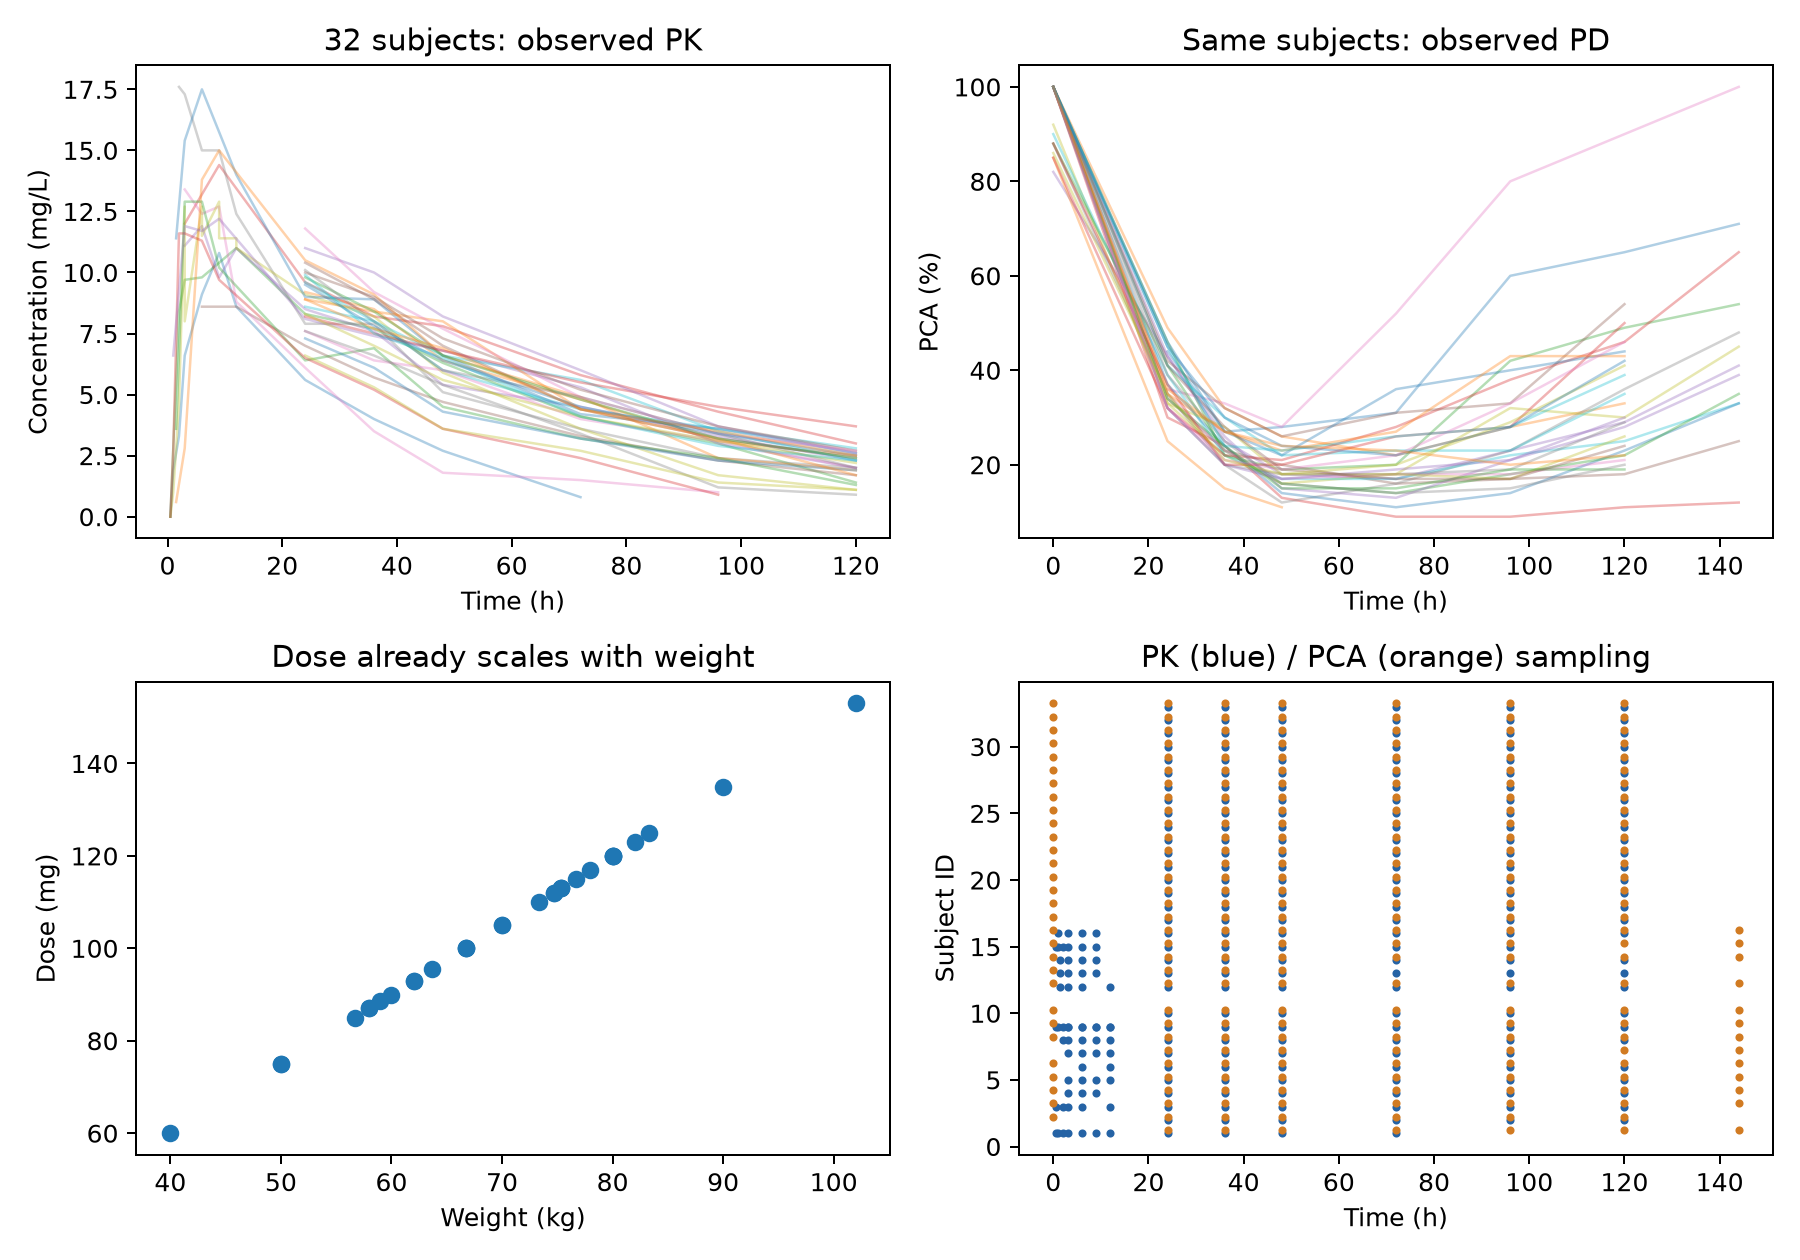
Figure 1. Actual observations and design. Unequal early sampling matters: 19 subjects first have PK measured at 24 h, leaving absorption chiefly informed by the densely sampled subset.
The minimum models
The oral one-compartment model has first-order absorption after a lag time, apparent clearance CL/F and apparent volume V/F. Bioavailability cannot be separated from clearance or volume using these oral data. Individual CL/F, V/F, absorption rate and lag time are lognormally distributed with diagonal covariance. The lag places the four zero concentrations at 0.5 h before absorption begins in the subjects whose lag exceeds 0.5 h. Concentration error is normal on the natural scale, with standard deviation sqrt(add² + (prop × concentration)²), matching nlmixr2's combined2 implementation. The four zeros therefore enter as observations, not logged zeros or invented BLQ values.
The PK model is written as differential equations. With nlmixr2's closed-form solution (linCmt()) and a lag, the model without weight stopped near an objective function value of 383 from every start I tried, whereas the same model as differential equations reached 223. The allometric model reached 192 with either form.
Prespecified allometry scales CL/F by (weight/70)^0.75 and V/F by weight/70. The comparator has no weight scaling. These are candidate PK descriptions, not discovered causal weight effects.
For normalized PCA R and concentration C, the direct model is R = 1/(1+(C/IC50)^γ). The turnover alternative is:
dR/dt = kout [1/(1+(C/IC50)^γ) − R], R(0) = 1.
Maximum inhibition is fixed to one; the Hill exponent γ is a typical-value parameter without between-subject variability (fixed to one in versions 1.0 and 1.1). The turnover rate delays the response even when plasma concentration changes promptly. This is consistent with the distinction between concentration and the time course of effect described by Wright, Winter and Duffull (2011). It is a deliberately reduced biomarker model, not a model of individual clotting factors.
PK is estimated first with FOCEi; its empirical Bayes individual estimates, including the individual lag, drive the PD model. PD has random IC50 and, for turnover, random kout, with additive normalized-PCA error. This is sequential conditional estimation, not simultaneous PK/PD estimation. PD random effects may absorb PK estimation error. Subject resampling refits both stages, but does not remove this conditioning limitation or baseline-normalization bias.
What the fit and diagnostics show
Typical constant-PK estimates were CL/F 0.134 L/h, V/F 8.03 L, ka 1.22 h⁻¹ and lag time 0.99 h. Turnover estimates were IC50 1.46 mg/L, Hill exponent 1.28 and kout 0.0495 h⁻¹, corresponding to a turnover half-life of 14.0 h. With γ fixed to one (version 1.1), IC50 was 1.18 mg/L and kout 0.0536 h⁻¹. In version 1.0 (no lag, γ = 1) the estimates were CL/F 0.134 L/h, V/F 7.84 L, ka 0.567 h⁻¹, IC50 1.15 mg/L and kout 0.0515 h⁻¹. These are conditional estimates from this implementation, not replacements for a clinically qualified model.
| model | AIC | warning |
|---|---|---|
| direct-refined | -302.3559 | False |
| pk-refined | 706.3630 | True |
| turn-refined | -565.8188 | False |
| weight-refined | 677.7457 | True |
| weight-turn | -563.6735 | True |
Compare AIC only within the PK candidates or within the two PD candidates, where the likelihood observations are identical. AIC across PK and PD is not meaningful. The PK objective function fell from 423.4 (version 1.0) to 225.1 with the lag. Estimating γ lowered the turnover objective function by 17.3 (−906.0 to −923.3, with the same PD observations and PK inputs) and the direct model's by 119.7. The refined candidates follow a second optimizer initialized from the first fit; all original outputs and warnings are preserved. The turnover model improves conditional PD fit substantially, but PK optimization still reports failure to establish a minimum. A small objective difference between starts does not resolve that warning.
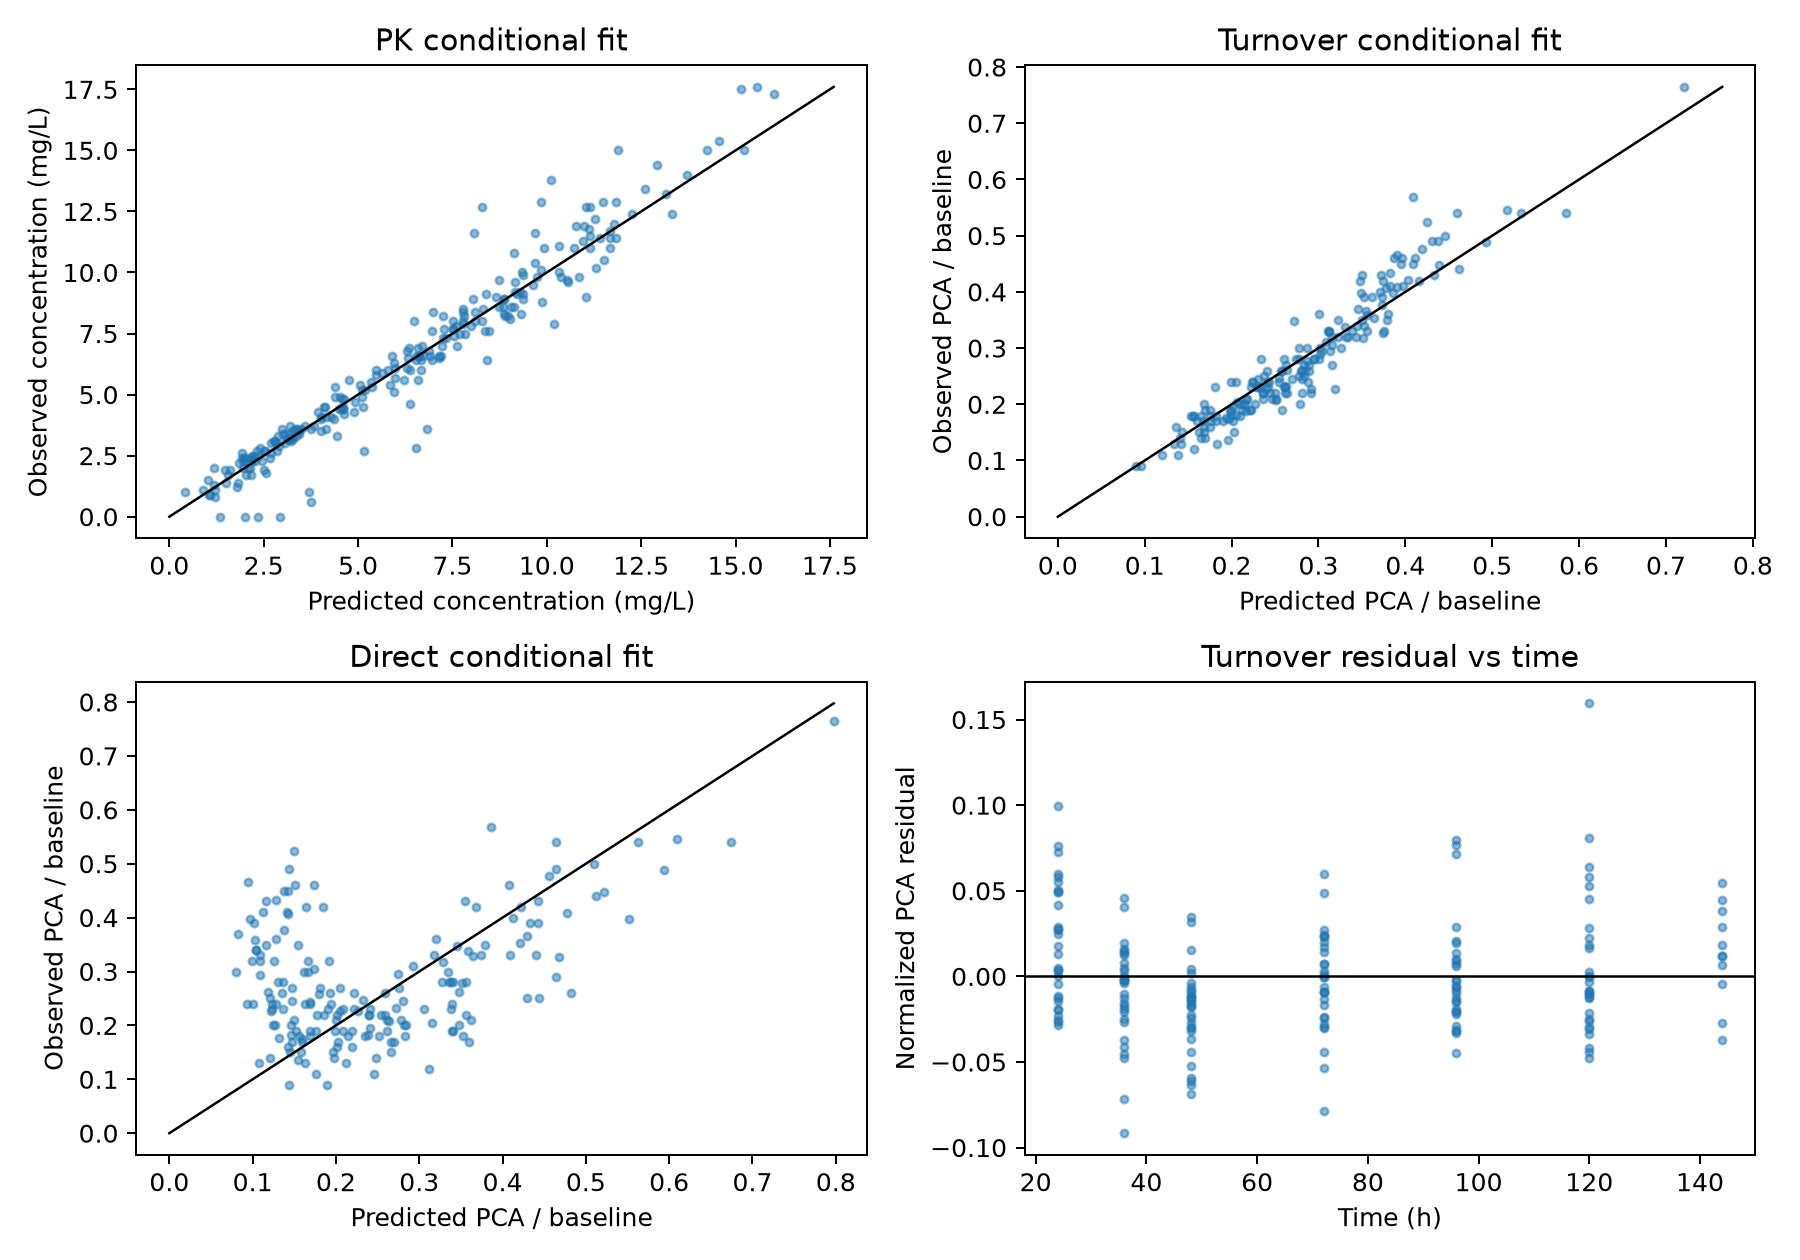
Figure 2. Conditional predictions use the subjects' fitted random effects; these panels are in-sample diagnostics, not validation. Time-patterned residuals leave possible structural misspecification; a good conditional fit is not proof of a biological mechanism.
Variance shrinkage is high for the absorption rate (83%) and the lag time (85%), and 37% for kout: sparse early sampling makes individual absorption weakly informed. Removing the four zero PK values and averaging the four repeated time keys were separate sensitivity refits, not changes to the primary data; CL/F changed from 0.134 to 0.133 and 0.132 L/h. No formal parameter confidence intervals are claimed from warning-bearing fits.
All 147 refits (folds, resamples and sensitivity runs) start from the same generic initial values. One bootstrap PK refit did not move from them and was excluded, so 59 of 60 planned subject-bootstrap sequences are used; 2 passed the explicit optimization-warning screen. Across them, γ ranged from 1.12 to 1.45 (2.5th to 97.5th percentile). Parameter variation from these finite fits is retained only as sensitivity.
Does limited PK information help a held-out subject?
Five deterministic folds split subjects, not observations. Each fold reestimates PK and both PD structures without its held-out subjects, from generic initial values. Baseline PCA is available in every strategy. Population prediction uses typical constant PK and PD parameters; weight prediction uses the fitted allometric PK parameters and the same turnover structure reestimated after allometric PK. Neither uses test-subject postdose measurements. The direct-effect comparison belongs to the constant-PK sequence; no unestimated allometric direct-effect result is shown.
PK-informed prediction estimates individual PK random effects (including the lag) by MAP using only actual concentration measurements at or before 24 or 48 h, with the fitted population prior and combined measurement error. It does not use future PK or any postbaseline PCA. Subsequent PCA is scored strictly after the cutoff. Prediction integrates the turnover equation using typical PD sensitivity, because this strategy has not measured individual PD sensitivity. It is a conditional point-prediction comparison, not a claim that the MAP estimate is known truth or a fully Bayesian predictive distribution.
| cutoff | strategy | subjects | RMSE | direct_RMSE | mean_PK_measurements |
|---|---|---|---|---|---|
| 24 | PK-informed | 30 | 0.1205 | 0.1010 | 2.7333 |
| 24 | population | 30 | 0.0827 | 0.0987 | 0.0000 |
| 24 | weight | 30 | 0.0826 | — | 0.0000 |
| 48 | PK-informed | 29 | 0.1241 | 0.1155 | 4.6552 |
| 48 | population | 29 | 0.1016 | 0.1150 | 0.0000 |
| 48 | weight | 29 | 0.1007 | — | 0.0000 |
Estimating γ did not improve held-out population prediction of the turnover model (24 h: 0.0827 vs 0.0807 with γ = 1; 48 h: 0.1016 vs 0.0987), although it improved the in-sample fit. It narrowed the gap of the direct model, which remains worse than turnover. Errors are normalized PCA units, computed by averaging squared error within each subject, then across subjects before taking the square root. Different cutoffs contain different future windows and must not be compared as if the scored outcomes were identical. “24 h” also does not mean one sample: the actual earlier sampling varies. The 48 h subset excludes the subject with no later PCA.
| cutoff | subjects | mean_MSE_difference | low | high |
|---|---|---|---|---|
| 24 | 30 | 0.0077 | 0.0003 | 0.0174 |
| 48 | 29 | 0.0051 | -0.0013 | 0.0114 |
Negative MSE difference favors PK information. Both point estimates favor the population prediction, and at 24 h the interval excludes zero (version 1.1: +0.0052 and +0.0030; version 1.0: +0.0015 and +0.0021). A few subjects with large losses drive the difference; 12 of 30 subjects improved at 24 h and 12 of 29 at 48 h. These 2,000 subject-resampling intervals condition on the existing folds and fitted training models; they do not include model-selection uncertainty and are not external-validation intervals. The numerical comparison is exploratory because the training PK fits also have optimization warnings. These results do not support a claim that extra PK alone improves subsequent PCA prediction in this dataset; with the current model, using it with typical PD sensitivity made predictions worse.
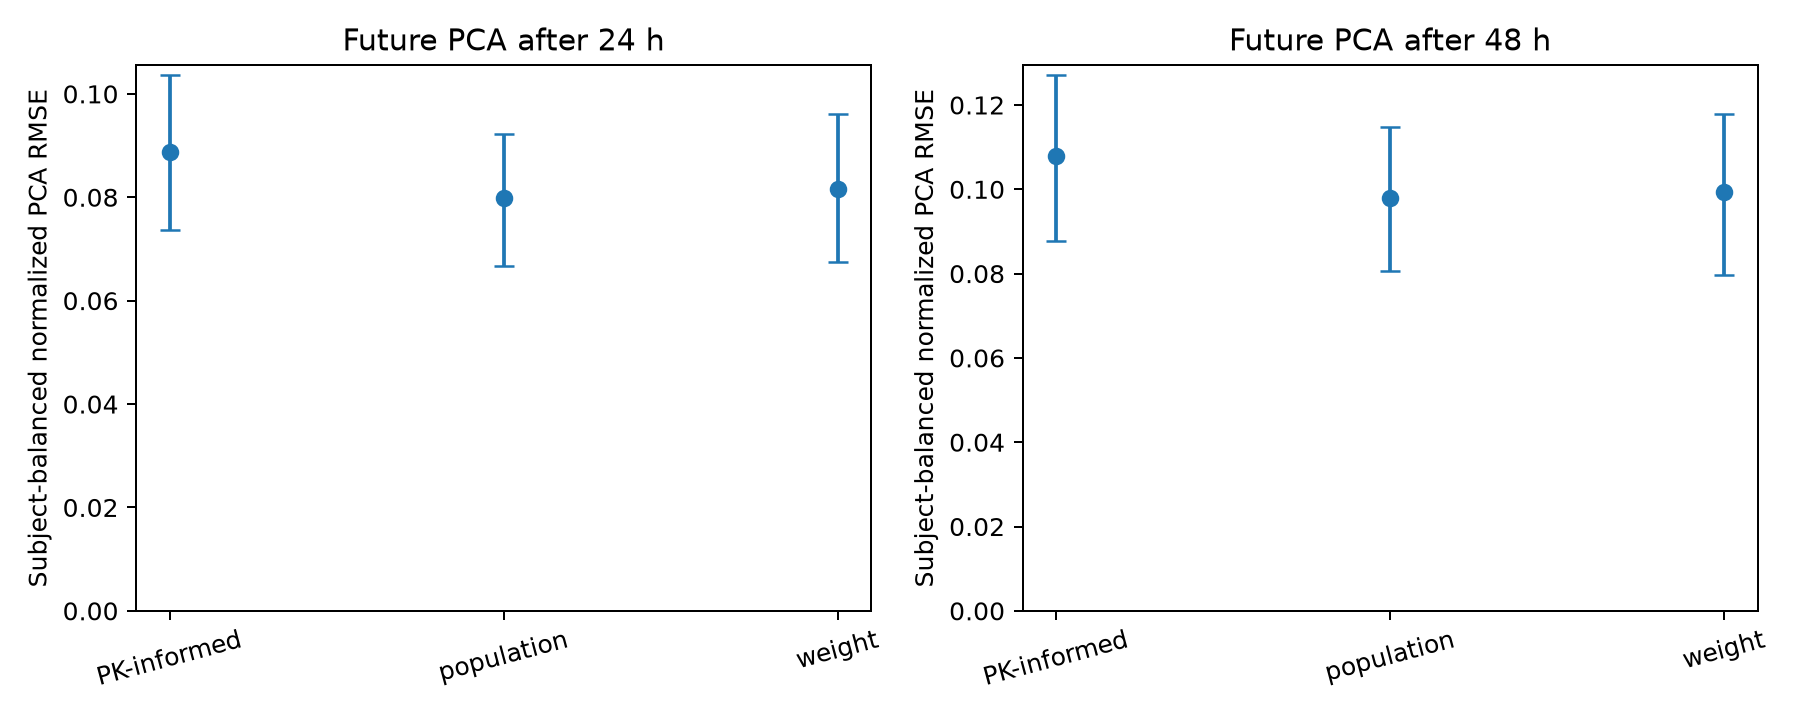
Figure 3. Turnover-model RMSE and subject-bootstrap intervals. The direct model's errors are reported in the table. Population prediction is a typical-individual predictor, not integration over the full random-effect distribution.
A paired dose experiment, with information available at the right time
To examine the consequence for dose design, I simulated a second single challenge after complete washout, with invariant individual PK/PD parameters. A subject's noisy concentration at 24 h, or at both 24 and 48 h, comes from a preceding reference challenge of 1.5 mg/kg. This makes the information available before the hypothetical second dose. Applying the same postdose information to the already administered first dose would be impossible.
The experiment uses 300 virtual subjects sharing the same random effects across strategies. Weight is sampled from the observed distribution. The comparator's fixed dose is calibrated to a typical individual's normalized PCA nadir of 0.25; weight scaling and PK-informed MAP estimates are alternatives. A separate oracle knows all true PK and PD parameters. It is an ideal upper bound, not a usable strategy. The acceptance band 0.20–0.30 is an arbitrary algorithm test, with no clinical therapeutic interpretation. Every strategy is constrained to the observed dose range of 60–153 mg.
| strategy | n | nadir_median | nadir_SD | target_fraction | dose_bound_fraction |
|---|---|---|---|---|---|
| PK24 | 300 | 0.2399 | 0.0756 | 0.4800 | 0.1867 |
| PK24+48 | 300 | 0.2357 | 0.0743 | 0.5233 | 0.2500 |
| fixed | 300 | 0.2472 | 0.0851 | 0.4400 | 0.0000 |
| oracle | 300 | 0.2500 | 0.0369 | 0.7967 | 0.4367 |
| weight | 300 | 0.2478 | 0.0860 | 0.4600 | 0.3033 |
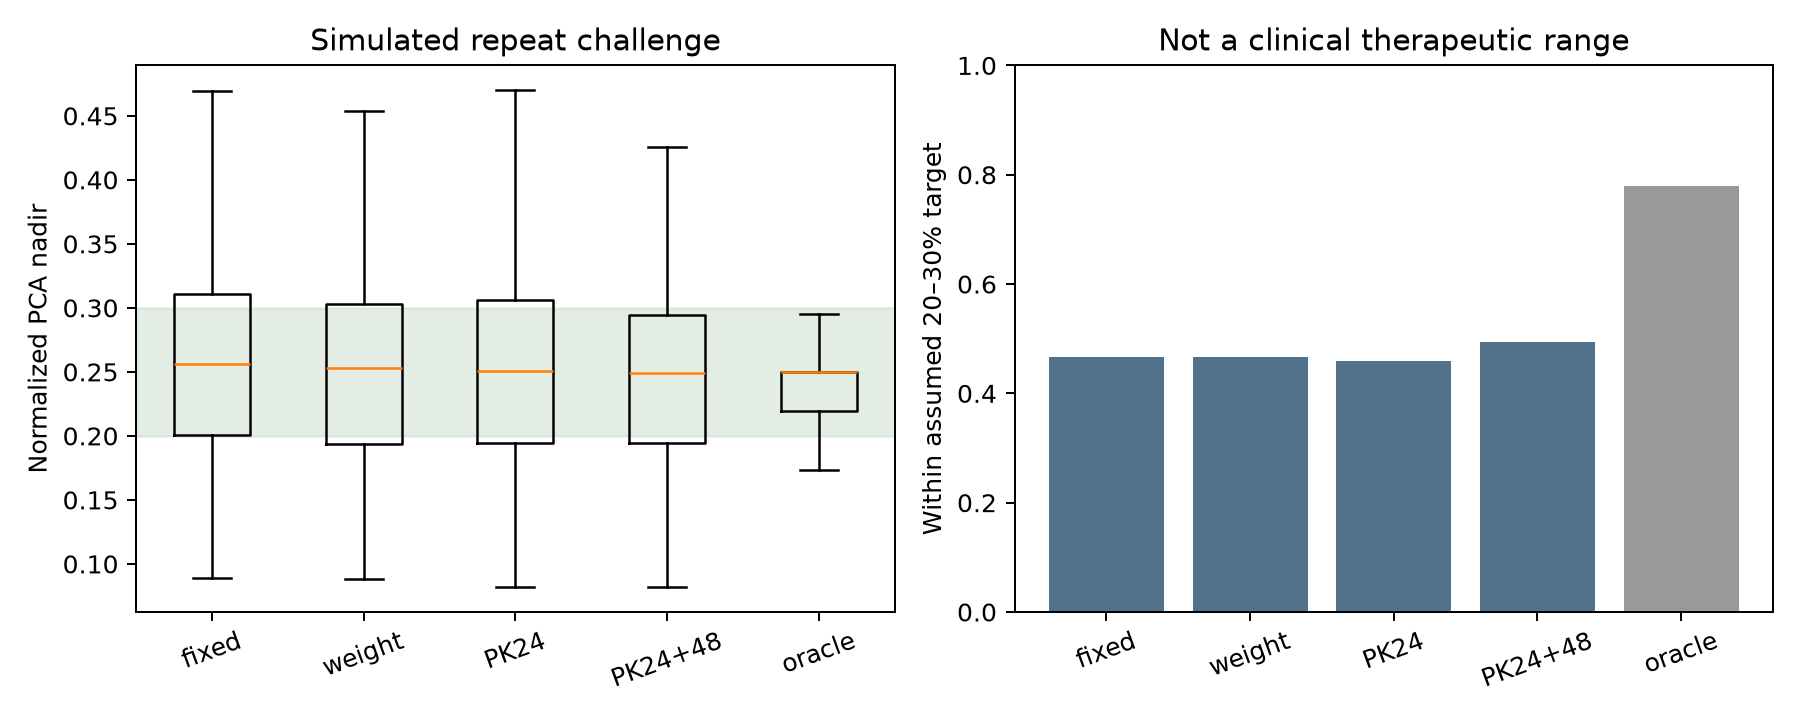
Figure 4. Simulated normalized PCA nadirs and arbitrary target attainment. These are model-generated outcomes, not observed treatment effects.
In this simulation, PK-informed dosing increased attainment of the arbitrary band by 4.0 percentage points with the 24 h concentration (paired 95% interval −0.3 to 8.0) and 8.3 points with 24 and 48 h (3.3 to 13.3) over the fixed dose; in version 1.1 the gains were 6.0 and 7.3 points, and in version 1.0 −0.7 and 2.7 points. The simulation assumes the fitted model is true, including the lag, so it can show a benefit that the held-out comparison above does not. The two results answer different questions and should not be combined.
A further 20 evenly selected finite subject-bootstrap parameter sets repeat the experiment in 150 paired virtual subjects each, with the same seeds. They include estimation variation and PK measurement noise, but remain warning-dependent sensitivity rather than a formal probability of clinical success. Changing from constant PK to fitted allometry also changes the relation between weight and exposure:
| PK_structure | strategy | target_fraction | nadir_SD | dose_bound_fraction |
|---|---|---|---|---|
| constant | PK24 | 0.4800 | 0.0756 | 0.1867 |
| constant | PK24+48 | 0.5233 | 0.0743 | 0.2500 |
| constant | fixed | 0.4400 | 0.0851 | 0.0000 |
| constant | oracle | 0.7967 | 0.0369 | 0.4367 |
| constant | weight | 0.4600 | 0.0860 | 0.3033 |
| allometry | PK24 | 0.4733 | 0.0757 | 0.2433 |
| allometry | PK24+48 | 0.5100 | 0.0748 | 0.2933 |
| allometry | fixed | 0.4433 | 0.0888 | 0.0000 |
| allometry | oracle | 0.8033 | 0.0388 | 0.5067 |
| allometry | weight | 0.4733 | 0.0814 | 0.2500 |
A weight-based strategy cannot be judged solely under a truth model that assumes no weight effect. Both structures are therefore retained. For the allometric sensitivity, turnover PD was reestimated after allometric PK; this remains sequential conditional estimation, not a joint likelihood. There is no observed repeated challenge to validate parameter stability, washout, the counterfactual dose responses or absence of interoccasion variability. Dose bounds also limit what even the oracle can attain.
Numerical checks and uncertainty
Independent Python concentration formulas (with the lag) and fine-grid turnover integration were checked against R's individual predictions:
| check | max_absolute_error |
|---|---|
| pk-refined | 8.74e-06 |
| turn-refined | 7.32e-05 |
| direct-refined | 2.79e-07 |
Agreement verifies implementation, not biology or clinical validity. The in-sample predictive check uses 500 subject-level random-effect draws per original subject at actual sampling times, then adds PD residual error. Its bands include IIV and residual error at fixed fitted parameters; they are not parameter confidence bands or held-out coverage.
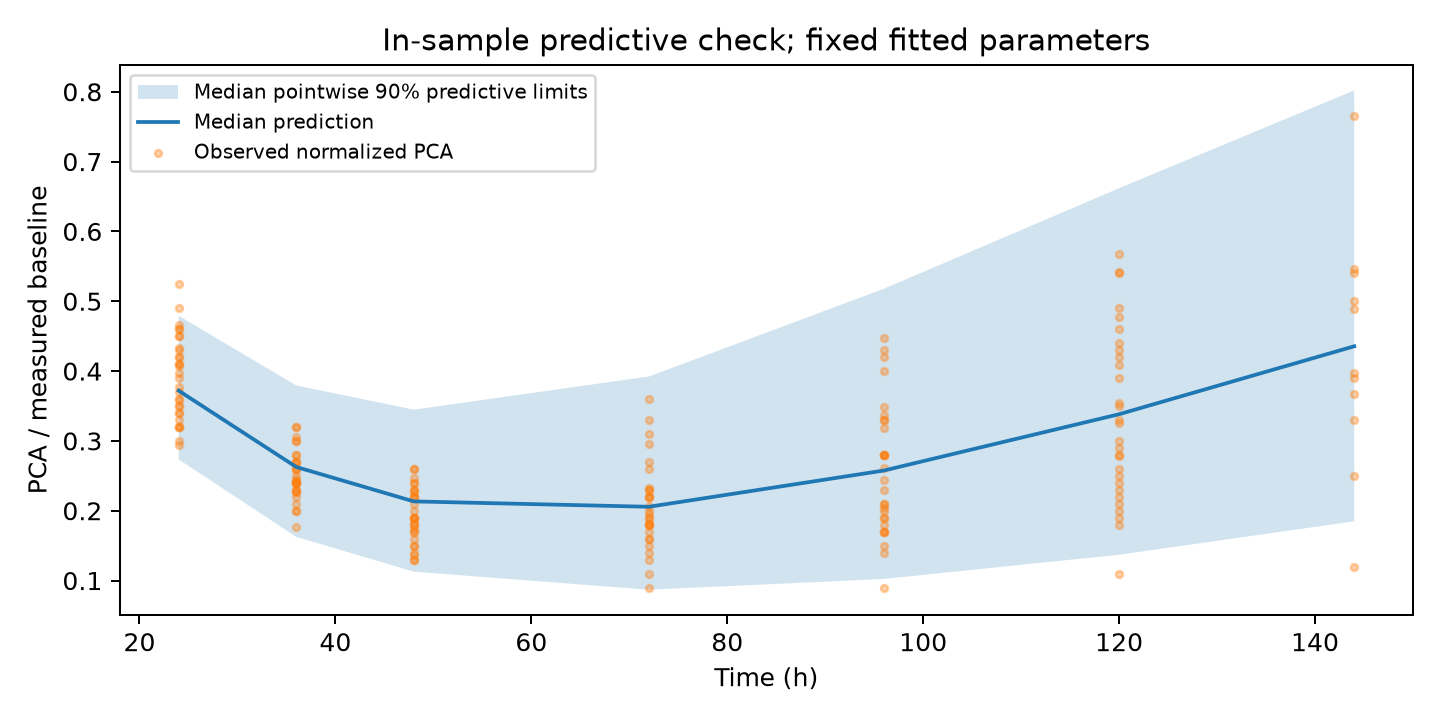
Figure 5. Pointwise predictive limits summarized across subjects, with normalized observations. The exact subject/time quantiles remain in the private analysis archive; aggregate review files accompany the article.
What can be concluded?
This measured-data example supports a limited methodological conclusion: representing effect delay matters, while additional PK measurements need not resolve response heterogeneity. The held-out comparison gives no evidence of improved PCA prediction from PK alone, with or without the absorption lag or an estimated Hill exponent. A better in-sample fit (the Hill exponent) also did not translate into better held-out prediction. It does not prove PK monitoring has no value in other settings.
The revisions themselves are a reminder of why model structure and refit behaviour need to be checked: adding the lag changed the PK fit substantially, nearly a third of the version 1.0 PK refits (20 of 67) had silently not moved, and the Hill exponent improved the fit without improving prediction. The direction of the main conclusion survived all three changes.
The next discriminating experiment would measure information about PD sensitivity, assess baseline measurement uncertainty and test prediction in an independent cohort or repeat occasion. It should be motivated by a clearly defined future decision rather than by collecting more concentrations automatically. No comparison here justifies a patient dose, chronic regimen, INR target or bleeding-risk claim. A simultaneous PK/PD likelihood, better characterized assay error and robust optimization would be necessary before stronger quantitative qualification.
Sources and reproducibility
- nlmixr2data warfarin reference, pinned source commit
f2cfb01ade88d4d30e66f56b19efce2a2c6e26bd; acquisition records distinguish documented and actual row counts. - University of Auckland original and simulated datasets, used to establish which file contains the original observations.
- O’Reilly, Aggeler and Leong, 1963, Studies of the coumarin anticoagulant drugs: The pharmacodynamics of warfarin in man. Historical provenance cited by the data distributor; record-level mapping to the original publications is unavailable.
- Wright, Winter and Duffull, 2011, Understanding the time course of pharmacological effect: a PKPD approach.
See the executed review notebook, reproduction instructions, and the downloadable reproduction bundle. The notebook executes aggregate checks and figure display; full estimation is a documented separate command, not silently rerun when opening the notebook. Individual observation files, fitted RDS objects and private planning materials are not distributed. The bundle also contains the version 1.0 and 1.1 scripts and aggregate results.
Download the companion: code, aggregate results and executed notebook
Cite this article
Kumakura, D. (2026). When does individual information improve PK/PD prediction?. daikikumakura.github.io. https://daikikumakura.github.io/writing/warfarin-pkpd.html