Recomputing daraxonrasib 300 mg target-inhibition predictions from FDA-published values
On this page
Abstract
Problem. The US Food and Drug Administration (FDA) review of the RAS(ON) inhibitor daraxonrasib refers to an approved indication in metastatic pancreatic cancer (1, p. 17) and assesses the dosage of 300 mg once daily as acceptable (1, p. 76). In the applicant-written part of the same review, one reason given for choosing 300 mg is a translational prediction that bridges animal efficacy data to humans with a pharmacokinetic/pharmacodynamic (PK/PD) model. According to it, 100% of patients at 300 mg reach at least 90% RAS-pathway inhibition (75% reach at least 95%), compared with 91% (38%) at 200 mg (1, p. 75). The review does not describe the details of this model.
Methods. I recomputed the same question using only numbers printed in the review: the coefficients of the human population PK (PopPK) model (1, Table 59) and the concentration–response of target inhibition in mouse tumours (1, p. 37). Tumour concentration was simply assumed to be R times whole-blood concentration. Virtual patients (4,096) were generated for each dose and each R.
Results. With R set to 4–7, the tumour-to-blood ratio of the area under the concentration–time curve (AUC) measured in mice, the share of patients reaching at least 90% inhibition on day 28 as a 24-hour average was 11.9–54.3% at 300 mg and 1.2–20.5% at 200 mg. By the pre-dose (trough) metric, the shares were 0.9–13.3% at 300 mg and 0.1–2.3% at 200 mg. For 99% of patients at 300 mg to reach at least 90% inhibition by the 24-hour average, R had to be about 22, and at that R, 95% of patients at 200 mg also reached it.
Conclusion. Within the published numbers and this simple assumption, the size of the applicant's predicted difference (100% at 300 mg versus 91% at 200 mg) could not be reproduced. This discrepancy is not evidence that the applicant's model is wrong; it is consistent with dependence on assumptions the review does not describe (the potency basis, the time course in tumour, species corrections and the definition of the metric are candidates), but this analysis cannot identify which. The FDA assessed 300 mg as acceptable (1, p. 76), and this calculation does not overturn that dose decision.
Introduction
The review does not show how much the target-inhibition prediction separates 200 mg from 300 mg. It contains sections written by the FDA and sections written by the applicant that do not necessarily reflect FDA's views (1, p. 1). This article recomputes the applicant's prediction from published inputs only and examines which assumptions the conclusion depends on.
Daraxonrasib (RMC-6236) is a noncovalent RAS(ON) multi-selective inhibitor that forms a tri-complex of cyclophilin A and GTP-bound RAS. A preclinical paper by the developer's researchers reported that tumour exposure in xenografts was about 3–7 times blood exposure and that a single 25 mg/kg dose suppressed tumour DUSP6 mRNA, a transcriptional target of the RAS/MAPK pathway, by more than 90% for up to 24 h (2). In the phase 3 trial RASolute 302 in previously treated metastatic pancreatic cancer, 500 patients were randomized, and median overall survival in the overall population was 13.2 versus 6.7 months, with a hazard ratio of 0.40 (3). The clinical efficacy of 300 mg does not depend on the recomputation here. What the recomputation addresses is only how much a target-inhibition prediction separates 200 mg from 300 mg.
The same paper shows part of the framework for such predictions (2). A model that adds tumour PK/PD to the mouse whole-blood PK was combined with the Simeoni tumour growth model to obtain the average blood concentration needed for tumour stasis (158 nM in mice), and after correcting for species differences in blood–plasma partitioning and protein binding the human equivalent was about 80 nM. Human PK was predicted from preclinical data; a daily dose of about 100 mg was projected to keep the average concentration above this value, and about 300 mg to give the same average blood concentration as 25 mg/kg daily in mice. I confirmed only the main text of this paper and did not read its supplementary methods. Whether the review's "100% and 91%" came from this model is stated neither in the review nor in the text I confirmed. The recomputation here lacks a dynamic tumour compartment and species corrections and substitutes a fixed ratio R, which is where it differs from this framework.
Question of interest (QOI): At 300 mg and 200 mg once daily, what fraction of patients can suppress the tumour RAS pathway by at least 90%?
Context of use (COU): To recompute the applicant's prediction from public material and show the assumptions behind it. It is not used for prescribing decisions.
Methods
Input data
All inputs were taken from the FDA multidisciplinary review of NDA (new drug application) 220910 (1). Table 1 lists the inputs and the type of statement. Tables in the source are written as, for example, "Table 59 of the review" to distinguish them from the tables of this article.
Table 1. Inputs and applicant statements taken from the FDA review.
| Item | Value | Type of statement |
|---|---|---|
| Population PK (Table 59) | 2 compartments, first-order absorption, lag 0.305 h. CL/F (apparent clearance) 53.8 L/h, Vc/F (apparent central volume of distribution) 516 L, Q/F (apparent intercompartmental clearance) 26.1 L/h, Vp/F (apparent peripheral volume of distribution) 255 L, ka (absorption rate constant) 0.735 /h (at 160 mg or below, 2.49-fold) | Final PopPK model in the review (1) |
| Time-dependent relative bioavailability | Maximum decrease EM 0.357, days to half of it ET50 5.90 d | Same |
| Between-subject variability (variance) | CL 0.139, Vc 0.168 (covariance 0.0949), ka 0.847 | Same |
| Molecular weight | 811.05 g/mol | Review (1) |
| Preclinical target inhibition (Capan-2 xenograft, KRAS G12V, single dose) | Inhibition of tumour DUSP6 mRNA against intratumour concentration: EC50 54 nM, EC90 966 nM, maximum inhibition about 99% | Pharmacology section of the review (1) |
| Tumour-to-blood exposure ratio (mouse) | Tumour AUC is 4–7 times blood AUC. Tumour concentration persists longer than blood concentration | Same |
| Applicant's prediction (applicant statement) | At 300 mg, at least 90% inhibition in 100% and at least 95% in 75%. At 200 mg, 91% and 38% | Applicant statement (1) |
| Phase 3 (RASolute 302, applicant statement) | No significant exposure–response for efficacy (overall survival, progression-free survival, response, duration of response). Safety endpoints (grade 3 or higher adverse events, skin disorders, stomatitis and others) were significantly related to exposure, but the predicted difference between 200 mg and 300 mg was 10% or less. Median relative dose intensity 93.1%, median 1-day average dose 279.3 mg, interruption 56.0%, reduction 36.1% | Applicant statement (1) |
Note: Source pages are p. 47 for molecular weight, p. 37 for the pharmacology section, p. 75 for the applicant's prediction, pp. 75–76 for the exposure–response and dose intensity, and p. 90 for the number of patients in the efficacy exposure–response analysis. Pages are the printed pages of the review; PDF page numbers are one higher. DUSP6 is a gene whose expression changes downstream of RAS signalling and is used as a marker of pathway activity. EC50 and EC90 are the concentrations producing 50% and 90% of the maximum effect. I did not determine whether each paragraph of the pharmacology section was written by the applicant.
The review states that in mice no simple relationship between blood concentration and DUSP6 inhibition could be derived, whereas one was obtained with intratumour concentration (1, p. 37). It also states that at 25 mg/kg the tumour concentration stayed above the EC90 for at least 24 h and repeated dosing reduced tumours by more than 50% (1, p. 37).
The exposure–response row of Table 1 rests, for efficacy, on an analysis of 215 patients in RASolute 302 who received 300 mg once daily and had PK, and, for safety, on a combined analysis of the phase 1 study RMC-6236-001 (10–400 mg) and RASolute 302 (1, pp. 75, 90). The efficacy exposure–response analysis compares exposure (quartiles of average concentration at steady state) among patients who received 300 mg and is not a randomized comparison with 200 mg. The review itself suggests that the narrow exposure range may explain the lack of a significant relationship and states that every exposure quartile had longer survival than the control arm (1, p. 90). The FDA assessment agrees with the applicant's position and considers the proposed 300 mg once daily acceptable (1, p. 76). The position with which the FDA is recorded as agreeing is that, together with the translational PK/PD analyses, this regimen reaches exposures associated with biologically active RAS-pathway inhibition (1, p. 90). In the material examined, the review does not record the FDA independently reproducing the "100% and 91%" figures.
Model
Pharmacokinetics. I implemented an approximate model from the published coefficients, supplying functional forms that were not published. Three points were added.
- Relative bioavailability falls with treatment day \(t\) (days) as \(F(t)=1-0.357\,t/(5.90+t)\), assumed to be an Emax form, that is, saturating towards an upper limit.
- The coefficient 1.49 on ka at 160 mg or below was applied as a factor of \((1+1.49)\), following the note to Table 59 of the review, which defines categorical covariate effects as \(k(1+\theta)\). This term is not used for the 300 mg and 200 mg results.
- Covariates were fixed to the reference patient reported in the review (65 years, 70 kg, bilirubin 8 µmol/L, one or more prior therapies), and individual differences were represented only by between-subject variability. Between-subject variability took the form \(P_i=P\exp(\eta_i)\), with \(\eta\) drawn from a multivariate normal distribution with mean 0 (including the CL–Vc covariance). Q and Vp have no between-subject variability (Table 59 of the review has no term for them). Describing between-subject variability by normally distributed deviations is the standard framework of population PK (4).
Dosing was simulated for 28 days, and whole-blood concentration on day 28 was used.
Target inhibition. Tumour concentration was set to R times whole-blood concentration, and inhibition \(I\) (dimensionless, 0–0.99) was given by
\[I=\frac{0.99\,C_t^{\,h}}{EC_{50}^{\,h}+C_t^{\,h}},\quad C_t=R\cdot C_{\text{blood}}\]
where \(C_t\) is tumour concentration and \(C_{\text{blood}}\) is whole-blood concentration (converted to nM). The Hill coefficient \(h\), which describes the steepness of the concentration–response curve, was set from the EC90 to EC50 ratio as \(h=\ln 9/\ln(966/54)=0.76\). A sigmoid model with three coefficients (maximum inhibition, EC50 and Hill coefficient) is a standard form of Emax-type concentration–response (5, 6), and the developer's preclinical paper also derived EC50 and EC90 with a three-parameter sigmoid model (2). However, \(h\) here was back-calculated from the two points EC50 and EC90 in the review together with the maximum inhibition; it was not fitted to the underlying data. R was explored from 1 (tumour equals blood) through the mouse AUC ratio of 4–7. Two inhibition metrics are reported: the inhibition at the day-28 trough (immediately before the next dose) and the average of inhibition over the 24 hours of day 28.
Weakness of the assumption. Mechanism-based PK/PD models that represent distribution to the target site as one step on the causal path place a target-site compartment separate from blood (7). Setting tumour concentration to blood concentration at each time point multiplied by R omits prolonged retention of the drug in tumour. In mice, tumour concentration persists longer than blood concentration, so the tumour-to-blood ratio at trough may exceed the AUC ratio. If such retention also occurs in humans, trough inhibition with a fixed R could be underestimated, but this analysis did not test the direction or size of the effect. Because inhibition is a nonlinear function of concentration, the same AUC with a different time course gives a different average inhibition. There is no guarantee that using the average reduces bias.
Random numbers and scale. The random seed for between-subject variability was fixed at 20261023, and 4,096 patients were generated for each dose. All shares use these 4,096 patients as the denominator.
Results
Model check
The median day-28 Cmax (maximum concentration) at 300 mg was 320.5 ng/mL. The review gives the geometric mean total Cmax at 300 mg as 391 ng/mL (0.48 µM) and the AUC as 4,060 h·ng/mL (the interval cannot be confirmed from the table) (1, pp. 45, 47). The model median Cmax is 18.0% lower, and the median 24-hour AUC (3,947 ng·h/mL) is 2.8% lower. The statistics differ, and the time point and population need not be the same.
The closeness of the AUC is consistent with including a relative bioavailability that falls over time. Relative bioavailability on day 28 is about 0.71, so the apparent clearance corresponds to 53.8 L/h divided by 0.71, about 76 L/h, close to the 74.0 L/h that the review gives as the geometric mean after repeated dosing (1, p. 74). Only the Cmax is low, however, so the model peak may be blunter than the real one. The terminal half-life computed from the Table 59 coefficients is about 13 h, longer than the terminal half-life of 8.8–9.7 h that the review reports (1, p. 74). Whether these differences bias the trough up or down cannot be known, because observed trough values could not be confirmed in the review. The AUC interval and population were not confirmed as matching, so numerical proximity does not establish small exposure bias. Even equal AUC can produce different average inhibition when profile shapes differ; neither inhibition metric is validated by this comparison.
Attainment of target inhibition
Figure 1 shows day-28 concentrations and the share reaching at least 90% inhibition at trough. Table 2 gives the shares for the main doses. With R of 1, 90% inhibition needs a whole-blood concentration of about 1,100 nM. This is higher than the EC90 in the review (966 nM) because the maximum inhibition is 99% and 90% is about 91% of that maximum.
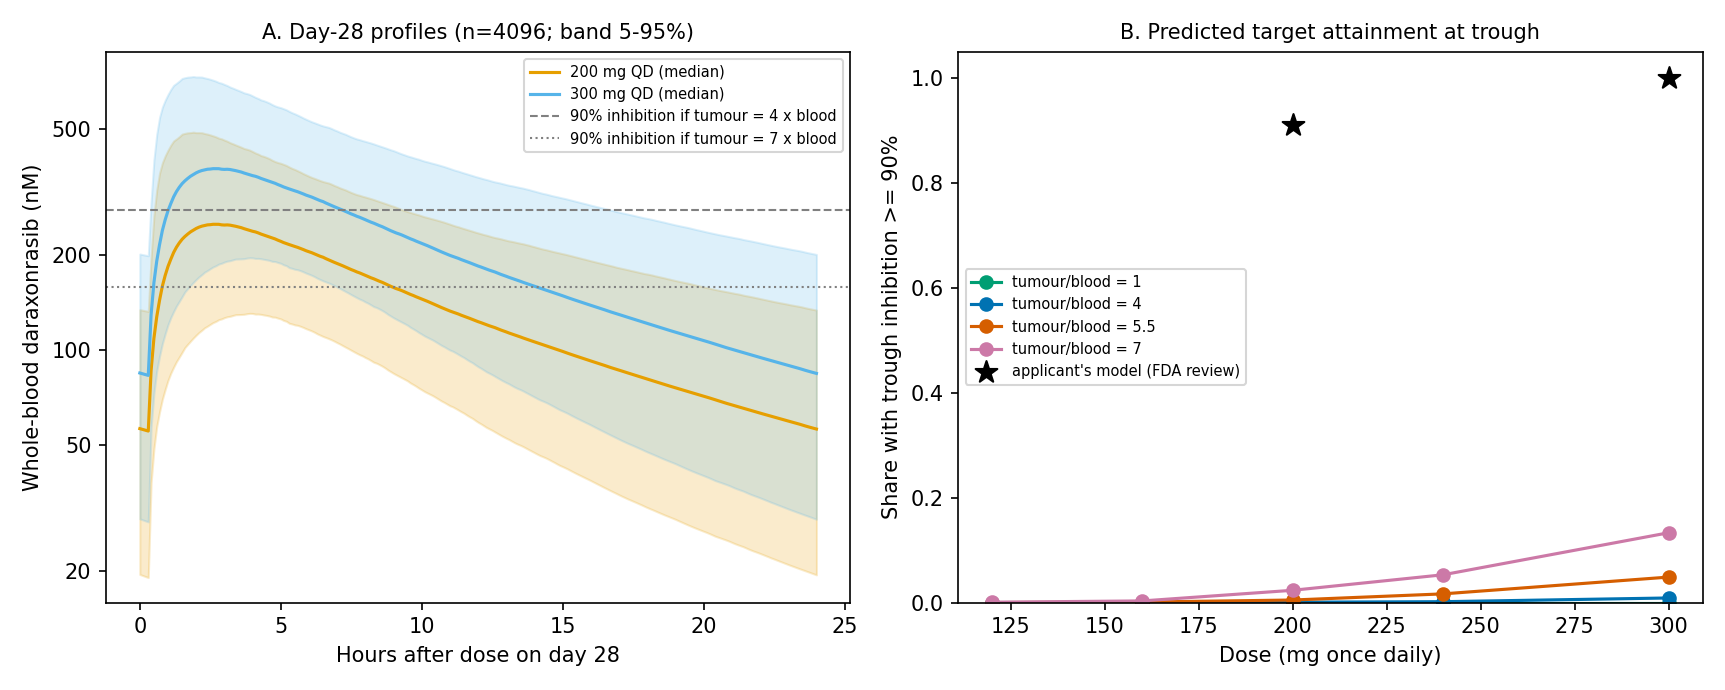
Figure 1. Day-28 whole-blood concentrations of virtual patients and attainment of target inhibition at trough. A: whole-blood concentration (median and 5th–95th percentile range of 4,096 virtual patients per dose). Horizontal lines show the blood concentration required for 90% inhibition when tumour concentration is 4 or 7 times blood concentration. B: share of patients reaching at least 90% inhibition at trough. Tumour/blood in the figure is R in the text, with tumour concentration assumed to equal R times blood concentration. Stars show the applicant's prediction (applicant statement in the review). The review does not define the applicant's metric, so the stars are not necessarily on the same scale as the trough metric. QD, once daily.
Table 2. Conditional predictions based on fixed tumour-to-whole-blood concentration ratios (day 28; share of 4,096 virtual patients per dose).
| Dose | Trough blood concentration (median) | At least 90% by 24-hour average (R = 4) | At least 90% by 24-hour average (R = 7) | At least 90% at trough (R = 4) | At least 90% at trough (R = 7) |
|---|---|---|---|---|---|
| 300 mg | 68 ng/mL (84 nM) | 11.9% | 54.3% | 0.9% | 13.3% |
| 240 mg | 55 ng/mL | 3.6% | 33.8% | 0.2% | 5.3% |
| 200 mg | 46 ng/mL | 1.2% | 20.5% | 0.1% | 2.3% |
| 160 mg | 33 ng/mL | 0.2% | 7.1% | 0.0% | 0.3% |
Note: R is the assumed ratio of tumour to whole-blood concentration. "24-hour average" means that the inhibition at each time point on day 28, averaged over 24 hours, is at least 90%; "trough" means that inhibition immediately before the next dose is at least 90%. Source: results/target_attainment.csv.
With R of 4–7, the share reaching at least 90% inhibition by the 24-hour average was 11.9–54.3% at 300 mg and 1.2–20.5% at 200 mg. At trough, it was 0.9–13.3% at 300 mg and 0.1–2.3% at 200 mg.
Rather than matching the applicant's 100% exactly, I used 99% as a convenient target and back-calculated the required R. For 99% of patients at 300 mg to reach at least 90% inhibition by the 24-hour average, R had to be about 22 (about 13 for 90% of patients, and about 7 for half). At R of about 22, 95% of patients at 200 mg also reached at least 90%. By the trough metric, the R required for 99% of patients at 300 mg was about 62, and at that R, 96% at 200 mg also reached it. By either metric, the size of the applicant's predicted difference (100% at 300 mg and 91% at 200 mg) was not reproduced by this simple model.
The structure of this result can be estimated roughly from numbers in the review. Conditionally treating the reported AUC of 4,060 h·ng/mL as a 24-hour value and dividing by 24 h gives an average whole-blood concentration of about 169 ng/mL (about 209 nM). With R of 4–7, tumour concentration is about 830–1,460 nM, which straddles the roughly 1,100 nM needed for 90% inhibition (the value at R of 1). This is an illustration using a population summary and an assumed interval, not an estimate of a median patient’s average inhibition. In addition, the between-subject variability of CL alone (variance 0.139) spreads the AUC to about 0.54–1.85 times the median at the 5th–95th percentiles. In a population whose median lies near the threshold, almost everyone cannot be placed above it. The exposure at 200 mg is two thirds of that at 300 mg, and the review states that exposure is approximately dose-proportional over 80–300 mg (1, p. 72). This 1.5-fold difference is small compared with the between-subject spread, and the distributions at the two doses overlap widely. That is why, when R is raised to about 22 and 99% of patients at 300 mg exceed the threshold, 95% at 200 mg do as well.
Discussion
Using only the preclinical concentration–response published in the review, the human pharmacokinetics, and the simple assumption that tumour concentration is R times blood concentration, only a fraction of patients at 300 mg reach at least 90% inhibition when R is 4–7. Raising R to about 22 brings 99% of patients at 300 mg to that level, but then 95% of patients at 200 mg also reach it, and the difference in the applicant's prediction does not appear. An R of about 22 is more than three times the mouse tumour-to-blood AUC ratio (4–7 for Capan-2 in the review, and about 3–7 across several models in the developer's paper (2)), so this simple construction cannot reproduce "100% and 91%" together. The applicant's prediction is therefore considered to depend on assumptions not described in the review.
I distinguish the candidate assumptions as follows. None was tested here.
- The potency basis. This analysis used the EC50 of 54 nM, based on total concentration against DUSP6 mRNA in mouse tumour lysates. The review also gives an IC50 for ERK phosphorylation in cells of 0.417–3.55 nM (1, p. 35). The EC50 is about 15–130 times larger. If compared with the mean maximum unbound blood concentration of 3.56 nM at 300 mg in humans (1, p. 40), the choice of basis alone moves the ratio of exposure to potency by more than an order of magnitude, far more than the 1.5-fold exposure difference between 200 mg and 300 mg.
- The time course in tumour. A fixed R does not represent retention in tumour. The developer's paper uses a model with tumour PK separate from blood (2).
- Species corrections. That paper corrected for species differences in blood–plasma partitioning and protein binding and obtained a human-equivalent tumour stasis concentration of about 80 nM (2). The review also states that human plasma protein binding is 97.7% and that the drug distributes preferentially to red blood cells (1, p. 32). This analysis used whole-blood concentration as it is.
- The definition of the metric. The review does not say whether "at least 90% inhibition of the RAS pathway" is based on trough or 24-hour average, or on whole-blood or plasma concentration. The stasis threshold in that paper (about 80 nM) refers to average blood concentration (2). The median trough in this analysis is 84 nM, so the median of the average concentration exceeds it. If the metric were whether such a threshold is exceeded rather than 90% inhibition, the attained share could be higher than in this analysis. However, whether the threshold refers to whole-blood or plasma concentration cannot be determined from the text I confirmed, and I did not calculate it.
Three things cannot be concluded from this calculation.
- That the applicant's model is wrong. The applicant may have used one of the candidates above or another assumption. Because the model details are not published, it is unknown which assumption differs.
- That 300 mg is unnecessary. The dose tested clinically was 300 mg. RASolute 302 reported a median overall survival of 13.2 versus 6.7 months in the overall population, with a hazard ratio of 0.40 (3). Including dose reductions and interruptions, median relative dose intensity was 93.1% (1, p. 75). This calculation does not overturn that clinical result.
- The actual value of inhibition in human tumours. Data on target inhibition in tumour biopsies are not in the material examined.
Implications
On reading "100% and 91%" in the review. These figures are the output of a model whose metric, potency basis and estimate of tumour concentration are not described, not an observation that every patient at 300 mg exceeds an inhibition threshold. From the same public inputs, the share of patients at 300 mg reaching at least 90% inhibition moved from 0.9% (R = 4, trough) to 54.3% (R = 7, 24-hour average) with the choice of R and metric alone. The position with which the FDA is recorded as agreeing is that this regimen reaches exposures associated with biologically active inhibition (1, p. 90); it is not a confirmation of the figures "100% and 91%" themselves.
On reading the dose rationale. The difference in target inhibition between 200 mg and 300 mg is large at intermediate R, where the threshold lies within the population distribution, and narrows as R grows and most patients at both doses exceed the threshold. With the 24-hour average metric, the difference in attained share was 10.7 percentage points at R = 4 (11.9% and 1.2%), 33.8 percentage points at R = 7 (54.3% and 20.5%), and 4 percentage points at an R of about 22, where 99% of patients at 300 mg are reached (99% and 95%). The difference depends jointly on dose-related shifts in exposure and the position of the threshold within the distribution. An argument that draws a ranking of 200 mg and 300 mg from a target-inhibition prediction needs evidence for that location. The clinical evidence the review cites is that the predicted difference between 200 mg and 300 mg in the safety exposure–response was at most 10% across all evaluated endpoints and that the efficacy exposure–response was confined to a narrow exposure range within 300 mg (1, pp. 75–76, 90); this is a separate question from the target-inhibition prediction.
On what cannot be identified. Unless human tumour concentration and target inhibition are measured as pairs, public information cannot separate whether R or the metric drives the result. The 0.9–54.3% span is conditional on the four chosen R/metric scenarios, not a confidence interval or bounds on the true attained share. No such paired data could be confirmed in the review.
The related dose-fractionation analysis also uses the same published PK coefficients (8).
Limitations
- The concentration–response of target inhibition comes from single-dose data in a mouse xenograft (KRAS G12V) and may not apply to human tumours or to tumours with mutations other than G12. The tumour-to-blood ratio is also from mice, and its time course was not included. DUSP6 suppression is not the same as tumour shrinkage: the developer's paper reports weak tumour responses despite strong DUSP6 suppression in the NCI-H2122 and KP-4 xenografts (2).
- Preclinical concentrations are total concentrations. Differences in protein binding between mice and humans were not handled (the mean maximum unbound blood concentration at 300 mg in humans is 3.56 nM (1, p. 40)). Human plasma protein binding is 97.7% and the drug distributes preferentially to red blood cells (1, p. 32). These differences could change the inhibition prediction substantially.
- Covariates were fixed at the reference patient, and the distribution of patient characteristics was not included. The functional form of the time-dependent bioavailability is an assumption.
- The PK model gives a Cmax 18.0% below the value in the review and a terminal half-life longer than the non-compartmental value (about 13 h versus 8.8–9.7 h). The direction of their effect on the trough metric could not be confirmed.
- The model equations and the target-inhibition metric actually used by the applicant are not in the examined material. Differences in the computed values cannot separate shortcomings of the approximation here from differences in the applicant's assumptions.
Conclusion
What share of patients can suppress the tumour RAS pathway (DUSP6) by at least 90% at 300 mg and 200 mg once daily? With the published inputs and the simple assumption that tumour concentration is R times blood concentration, taking R as 4–7 (the mouse AUC ratio), the share was 11.9–54.3% at 300 mg and 1.2–20.5% at 200 mg by the 24-hour average, and 0.9–13.3% at 300 mg and 0.1–2.3% at 200 mg by the trough. The applicant's prediction (100% at 300 mg and 91% at 200 mg) was not reproduced by this construction. Reaching 99% at 300 mg required an R of about 22 for the 24-hour average and about 62 for the trough. Under those respective assumptions, 95% and 96% of patients at 200 mg also exceeded the threshold. This discrepancy is consistent with the review not describing the potency basis, the time course in tumour, the species corrections or the definition of the metric, but which of them is responsible cannot be identified. This calculation does not judge the correctness of the applicant's model or the clinical appropriateness of 300 mg.
Data and code availability
Code, inputs and results are collected in daraxonrasib-target.zip. The tables and the figure can be regenerated with python analysis/run_analysis.py (NumPy, SciPy, pandas and Matplotlib; random seed 20261023). The inputs are values transcribed from the public PDF of the FDA review (1); the PDF itself is not redistributed. The supplementary arithmetic in the text (the comparison of apparent clearance and terminal half-life, the rough average concentration, the 5th–95th percentile spread of AUC, and the differences in attained share) was calculated from the distributed inputs and tables and is not an output of the distributed code.
References
- US Food and Drug Administration, Center for Drug Evaluation and Research. Multi-discipline review: NDA 220910, RASONQUE (daraxonrasib), Reference ID 5858563 [Internet]. Silver Spring (MD): FDA; 2026 [cited 2026 Oct 29]. Available from: https://www.accessdata.fda.gov/drugsatfda_docs/nda/2026/220910Orig1s000MultidisciplineR.pdf. Page numbers refer to the printed review pages.
- Jiang J, Jiang L, Maldonato BJ, Wang Y, Holderfield M, Aronchik I, et al. Translational and therapeutic evaluation of RAS-GTP inhibition by RMC-6236 in RAS-driven cancers. Cancer Discov. 2024;14(6):994–1017. doi:10.1158/2159-8290.CD-24-0027. Main text read; supplementary methods not read. A correction (a duplicated image panel in Figure 3A) was published: Cancer Discov. 2025;15(10):2186.
- O'Reilly EM, Wainberg ZA, Hendifar AE, Borad MJ, Pietrantonio F, Pant S, et al. Daraxonrasib or chemotherapy in previously treated metastatic pancreatic cancer. N Engl J Med. 2026;395(4):325–337. doi:10.1056/NEJMoa2605555. Abstract read; full text not read.
- Mould DR, Upton RN. Basic concepts in population modeling, simulation, and model-based drug development-part 2: introduction to pharmacokinetic modeling methods. CPT Pharmacometrics Syst Pharmacol. 2013;2(4):e38. doi:10.1038/psp.2013.14.
- Holford NH, Sheiner LB. Understanding the dose-effect relationship: clinical application of pharmacokinetic-pharmacodynamic models. Clin Pharmacokinet. 1981;6(6):429–453. doi:10.2165/00003088-198106060-00002.
- Goutelle S, Maurin M, Rougier F, Barbaut X, Bourguignon L, Ducher M, et al. The Hill equation: a review of its capabilities in pharmacological modelling. Fundam Clin Pharmacol. 2008;22(6):633–648. doi:10.1111/j.1472-8206.2008.00633.x.
- Danhof M, de Jongh J, De Lange EC, Della Pasqua O, Ploeger BA, Voskuyl RA. Mechanism-based pharmacokinetic-pharmacodynamic modeling: biophase distribution, receptor theory, and dynamical systems analysis. Annu Rev Pharmacol Toxicol. 2007;47:357–400. doi:10.1146/annurev.pharmtox.47.120505.105154.
- Kumakura D. Daraxonrasib dose fractionation: opposing exposure metrics [Internet]. Daiki Kumakura; 2026 Nov 21. Available from: daraxonrasib-dose-fractionation-en.html.