Predicting week-12 ctDNA detection from a week-3 measurement
A participant-level reanalysis of public tebentafusp data compares baseline and early detection states for predicting recorded week-12 ctDNA detection in 54 complete cases.
On this page
- The outcome is recorded detection at week 12
- Why 69 participants become 54
- Numeric zero is not zero biological concentration
- Estimating a probability from two states
- Adding week 3 reduces error in this sample
- Nondetection at week 3 did not always persist
- Uncertainty remains in the improvement
- Analysis material
- References
- Cite this article
Nondetection of ctDNA during tebentafusp treatment does not necessarily persist. Conversely, some patients with detectable ctDNA at week 3 have no recorded detection at week 12. Using an early measurement requires more than showing its association with prognosis: its ability to predict a subsequent measurement can be examined directly.
Public data from 69 patients with metastatic uveal melanoma yielded 54 with evaluable measurements at baseline, week 3 and week 12. Adding week-3 detection status to baseline status reduced leave-one-patient-out Brier score from 0.165 to 0.141. The resampling interval for the improvement nevertheless crossed zero. Some patients with early progression had no week-12 sample, so this performance must be distinguished from performance in everyone starting treatment.
The outcome is recorded detection at week 12
QOI: Does adding week-3 ctDNA detection status to baseline status reduce the error in predicting week-12 detection?
COU: Evaluate the information that an early ctDNA measurement adds about a subsequent recorded detection state within this public cohort. This is not used to stop treatment, omit week-12 sampling or change dose.
Tebentafusp combines a TCR recognizing a gp100-derived peptide–HLA complex with a CD3-binding domain. Rodrigues and colleagues monitored plasma ctDNA by ddPCR before treatment and at week 3, week 12 and progression. The input here is their public Source Data; the purpose is not to reproduce their prognostic analyses of PFS or OS (Rodrigues et al., 2024).
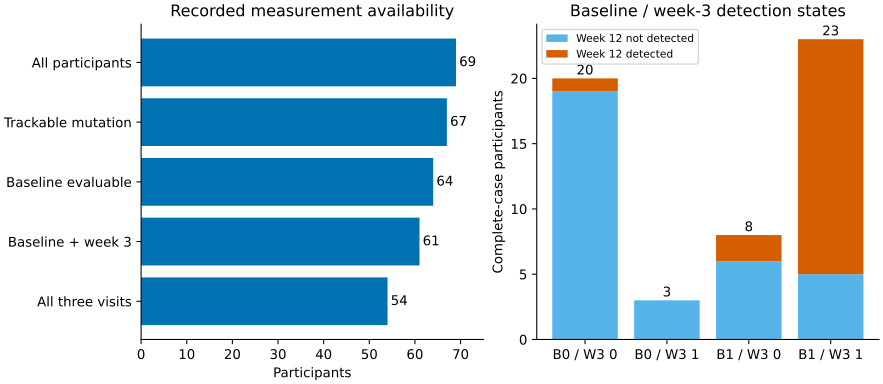
Why 69 participants become 54
The Source Data contain 69 unique anonymous participant IDs. A trackable mutation was identified in 67. Numeric zero, blank, NA and Not analysable* were retained as distinct states. The ctDNA columns agree between the Source data and Figure 1 sheets for all 69 participants (original Source Data).
| Time | Numeric recorded result | Detected | Numeric zero | Blank | NA | Not analysable |
|---|---|---|---|---|---|---|
| Baseline | 64 | 39 | 25 | 2 | 2 | 1 |
| Week 3 | 64 | 31 | 33 | 3 | 2 | 0 |
| Week 12 | 56 | 21 | 35 | 11 | 2 | 0 |
There were 61 baseline/week-3 pairs and 54 complete three-timepoint records. Models were compared on the same 54 participants. There are also 54 baseline/week-12 pairs, but the complete three-timepoint overlap was established by participant IDs rather than assumed from that count.
All seven participants with baseline/week-3 measurements but no week-12 measurement had recorded PFS shorter than 12 weeks. One also had recorded OS shorter than 12 weeks. Missingness cannot be treated simply as random missed blood collection. Missing results were not replaced with either detection or nondetection.
Numeric zero is not zero biological concentration
The original analysis classified samples as positive when they exceeded assay-specific detection limits. Required numbers of positive droplets differed by mutation. Samples with fewer than 300 amplifiable genomes and no ctDNA detected were excluded. Here a numeric zero represents a recorded nondetection in that analysis, not proof that no ctDNA was present in the body (original ddPCR methods).
Specimen-specific genomic input and the information required to recalculate detection limits were not recovered from this table. Instead of extrapolating copy numbers as precise continuous concentrations, the models use recorded detection states. Log fold changes were not calculated by treating nondetection as 0 copies/mL.
Estimating a probability from two states
Let \(B_i\), \(W_i\) and \(Y_i\) denote detection at baseline, week 3 and week 12. Each equals one for detection and zero for a recorded numeric zero.
\[ \begin{aligned} M_B &: \operatorname{logit}(p_i)=\alpha+\beta_B B_i\\ M_{BW} &: \operatorname{logit}(p_i)=\alpha+\beta_B B_i+\beta_W W_i \end{aligned} \]
A model using week 3 alone was fitted for comparison. A simple persistence rule, \(\widehat Y_i=W_i\), assumes that week-3 status continues unchanged at week 12.
Some of the small combinations of binary states can produce separation. A fixed ridge penalty was therefore applied to the slopes, minimizing the following objective without penalizing the intercept:
\[ L=\sum_i\{\log(1+e^{\eta_i})-Y_i\eta_i\} +\frac{\lambda}{2}\sum_j\beta_j^2, \qquad \lambda=1 \]
The 0/1 predictors require no standardization. No interactions or additional clinical variables were added; the main model has at most two predictors.
Coefficients were fitted to 53 participants after excluding one, and the excluded participant's week-12 state was predicted. This was repeated for all 54 participants. Their own held-out outcome entered neither coefficient estimation nor penalty selection. This is retrospective internal validation with the source and results already accessible, not blinded prospective validation.
Adding week 3 reduces error in this sample
Brier score is \(\frac{1}{n}\sum_i(Y_i-\widehat p_i)^2\), with smaller values indicating less error. Lower log loss is also better. The hard persistence rule assigns probabilities zero or one, giving infinite log loss when it misclassifies a participant. No arbitrary smoothing was added, so that log-loss entry is not reported.
| Model or rule | Brier score | Log loss |
|---|---|---|
| Baseline only | 0.1653 | 0.4994 |
| Baseline and week 3 | 0.1408 | 0.4498 |
| Week 3 only | 0.1684 | 0.5175 |
| Carry forward week-3 state | 0.2037 | Not reported |
The main-model Brier-score difference was −0.02454. Adding week-3 status to the baseline-only model reduced prediction error in this cohort.
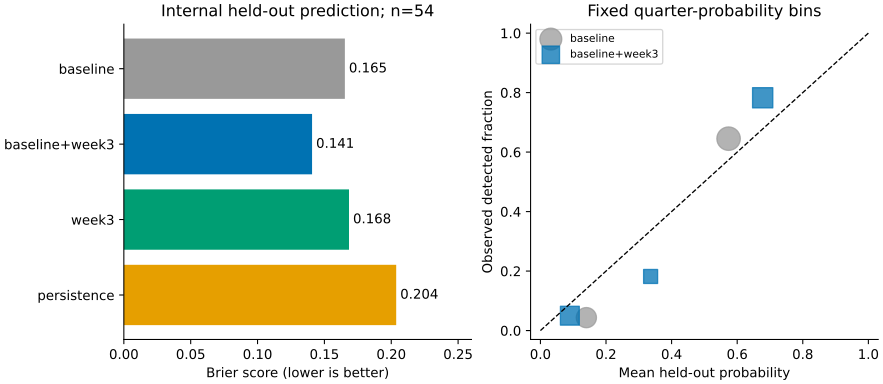
The right panel compares mean predicted probability with observed detection frequency in fixed probability bins of width 0.25. Point size represents the number of participants in the bin. A few points close to the diagonal do not establish calibration in a different population.
ROC AUC is preserved in the downloadable table but is not the principal basis for interpretation. Binary predictors give many participants the same state. Small changes in training prevalence after excluding one participant can reverse rankings among participants in that state. Comparing leave-one-out AUC directly with the AUC of a hard persistence rule includes this effect.
Nondetection at week 3 did not always persist
Transitions among the 54 participants were also counted separately from the model.
| Baseline | Week 3 | Participants | Detected at week 12 | Not detected at week 12 |
|---|---|---|---|---|
| Not detected | Not detected | 20 | 1 | 19 |
| Not detected | Detected | 3 | 0 | 3 |
| Detected | Not detected | 8 | 2 | 6 |
| Detected | Detected | 23 | 18 | 5 |
Eleven participants changed state between week 3 and week 12: eight went from detection to nondetection, and three from nondetection to detection. At a fixed probability threshold of 0.5, the main model predicted nondetection for three of the 21 participants with week-12 detection and detection for five of the 33 with week-12 nondetection. The threshold illustrates classification; it was not selected from the results as a clinical cutoff.
For description, fitting all 54 participants gave the following equation. These full-data coefficients were not used to generate the excluded-participant predictions above.
\[ \operatorname{logit}(p)=-2.3325+1.6458B+1.4476W \]
Uncertainty remains in the improvement
Participant-level loss differences were resampled with replacement 4,000 times while holding the existing held-out predictions fixed. The 2.5th–97.5th percentiles of the Brier-score difference were −0.05526 to 0.00561, crossing zero. This is a resampling interval conditional on the existing predictions, not an interval obtained by refitting the models in every draw. It does not include model-training or external-cohort uncertainty.
Repeating the evaluation with fixed penalties of 0.25, 0.5, 1, 2 and 4 gave lower Brier score for baseline plus week 3 than for baseline alone at all five settings. These results were not used to select a new best penalty.
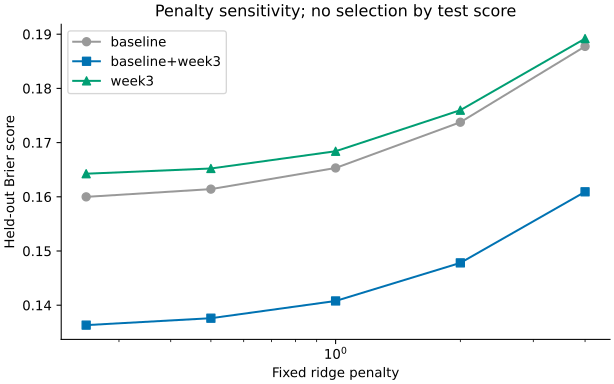
The observed improvement is consistent with week-3 sampling carrying information about the later detection state. It remains weak evidence for a confirmed improvement or for omitting a measurement. In particular, selection of participants with a week-12 sample and missingness after early progression are consequential.
ctDNA nondetection does not establish tumor elimination, and week-12 detection is not itself treatment benefit. The analysis compares small prediction models for 54 participants with the same assay and all three measurement opportunities recorded. Its performance is not established for all 61 participants with early measurements or for patients measured with another assay.
Analysis material
The code retrieves the original public Source Data, verifies its hash, and generates the missingness audit, participant-exclusion predictions, sensitivity analysis and new figures and tables. The original XLSX, original participant records and original figures are not redistributed. Manuscript numbers correspond to outputs/results.json; aggregate tables are in outputs/tables/. This is a reanalysis of recorded states in public data, not a clinical treatment-decision predictor.
Analysis code and aggregate outputs
References
- Rodrigues M, Ramtohul T, Rampanou A, et al. Prospective assessment of circulating tumor DNA in patients with metastatic uveal melanoma treated with tebentafusp. Nature Communications. 2024;15:8851. Published October 14, 2024. doi:10.1038/s41467-024-53145-0. Original article and Source Data: CC BY-NC-ND 4.0. This article reports new statistical analyses; no original figure or source workbook is redistributed.
Cite this article
Kumakura D. Predicting recorded week-12 ctDNA detection from early measurements during tebentafusp treatment. Personal research article. 2026. Exploratory internal prediction using public participant-level data.