What changes in paired tumor immune-expression measurements during nivolumab?
Fixed immune scores in 43 public RNA pairs, with paired change, normalization sensitivity and patient-separated response-association diagnostics.
Key findings
- In 43 public pre/on-nivolumab RNA pairs, a fixed cytolytic score rose in 33 of 43 participants (median +0.346, 95% interval +0.154 to +1.108), stable across FPKM and CPM (Spearman 0.996).
- Adding the change to baseline expression raised held-out response AUC from 0.599 to 0.673, but the interval (−0.084 to +0.269) included no improvement, with only nine responders.
- An observed on-treatment change is pharmacodynamic evidence, not a qualified predictive biomarker; biopsy dates, selection into a second biopsy and a validation cohort are needed next.
On this page
In 43 publicly available pretreatment/on-treatment RNA pairs, a fixed cytolytic-expression summary usually increased. However, its change added only uncertain information about recorded best response beyond baseline expression. The useful distinction is between observing a pharmacodynamic change and qualifying it as a predictive biomarker.
日本語要約:43人の治療前後RNAを対応付けると、免疫関連指標の上昇が見られた。一方、反応が分かる42人で変化量を加えたモデルの改善は不確実だった。治療後に観測できる変化を、治療前の予測や治療選択の根拠へ読み替えない。
Question and information time
The question of interest was whether a small, fixed immune-expression summary changes within participants and whether that change adds conditional information about recorded best overall response. The context of use is prioritizing pharmacodynamic monitoring hypotheses. This is not a clinical biomarker assay, treatment-selection rule, survival surrogate, or prospective prediction study.
The source study scheduled a pretreatment biopsy 1–7 days before dosing and an on-treatment biopsy during days 23–29. Individual exact biopsy dates are absent from the downloaded GEO metadata. Response denotes best overall RECIST 1.1 response. Riaz et al., Cell, 2017.
That distinction determines the analysis. On-treatment expression cannot be used to describe what was knowable before treatment. Nor can the study schedule substitute for every participant's actual biopsy and event dates. Without those dates, a survival landmark analysis and immortal-time correction cannot be qualified from these files.
Audit the pairs before scoring them
Official GSE91061 SOFT metadata, FPKM and raw-count files were downloaded and hashed. Sample titles contain participant and visit identifiers; visit labels were checked against the metadata characteristics. Expression columns matched metadata samples exactly. Response labels agreed within participants. NCBI GEO GSE91061.
| Data audit | Count |
|---|---|
| RNA samples / participants | 109 / 65 |
| Pretreatment / on-treatment samples | 51 / 58 |
| Participants with exactly one sample at each visit | 43 |
| Participants excluded as unpaired | 22 |
| Duplicate participant–visit rows | 2, belonging to one unpaired participant |
| Paired PRCR / SD / PD / unknown response | 9 / 15 / 18 / 1 |
| Response-known paired analysis | 42 participants, 9 responders |
| Genes in each expression matrix | 22,187 |
The duplicate on-treatment samples were not chosen between by response or expression. Their participant lacked an eligible pretreatment pair and did not enter the paired analysis. Unknown response remained in the change description and was excluded only from response-associated models. These rules preserve the observed sampling structure rather than manufacture a complete cohort.
Fixed scores, with assay differences made explicit
The primary cytolytic-inspired score was the mean of log2(FPKM+1) for GZMA and PRF1. The gene choice follows the biological summary proposed by Rooney et al., but the published CYT measure used TPM. The present transformation, normalization, and pseudocount make this an adaptation rather than a reproduction of that assay. Rooney et al., Cell, 2015.
A secondary, descriptive IFN-related score averaged log2(FPKM+1) over IFNG, STAT1, IDO1, CXCL9, CXCL10 and HLA-DRA. The literature motivates the panel; its NanoString-based scoring and clinical cutoffs are not imported into these RNA-seq measurements. Ayers et al., Journal of Clinical Investigation, 2017.
No genes or threshold were selected using this cohort's response labels. Change was defined as on-treatment minus pretreatment score. As a normalization sensitivity, the primary score was also computed from log2(CPM+1), using each raw-count library total. CPM does not perform gene-length normalization and does not establish equivalence to FPKM or TPM.
Paired changes
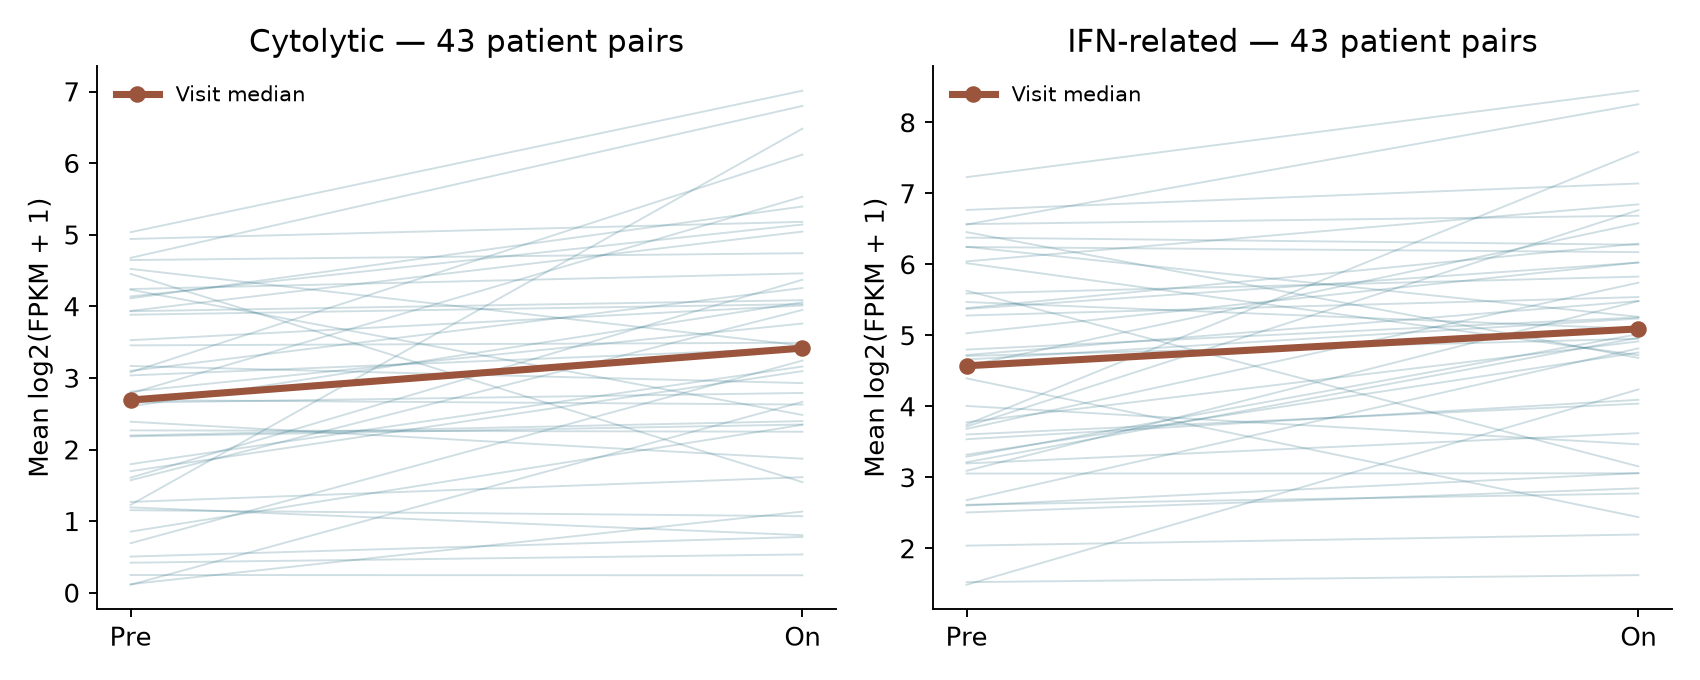
| Score | Pairs | Median change | Participant-bootstrap 95% interval | Positive changes |
|---|---|---|---|---|
| Cytolytic-inspired, FPKM | 43 | +0.346 | +0.154 to +1.108 | 33 / 43 |
| IFN-related, FPKM | 43 | +0.454 | +0.242 to +0.803 | 34 / 43 |
| Cytolytic-inspired, CPM sensitivity | 43 | +0.419 | +0.184 to +1.138 | 34 / 43 |
Intervals resampled participants 2,000 times and summarized the median paired difference. The thick figure lines connect the median at each visit; their vertical difference is not the median of individual changes. The two summaries should not be conflated.
The FPKM and CPM primary-change ranks were strongly correlated, Spearman rho 0.996. This supports stability of the rank pattern to this normalization change. It does not validate absolute score units, tissue comparability, or an immune-cell-count interpretation.
Bulk RNA changes can reflect changing cell composition, tumor content, sampling, or expression within cells. With no untreated longitudinal control, an observed change is not a randomized estimate of nivolumab's causal effect on the score. The paired design removes a fixed participant level; it does not remove every time-varying explanation.
Does change add information about recorded response?
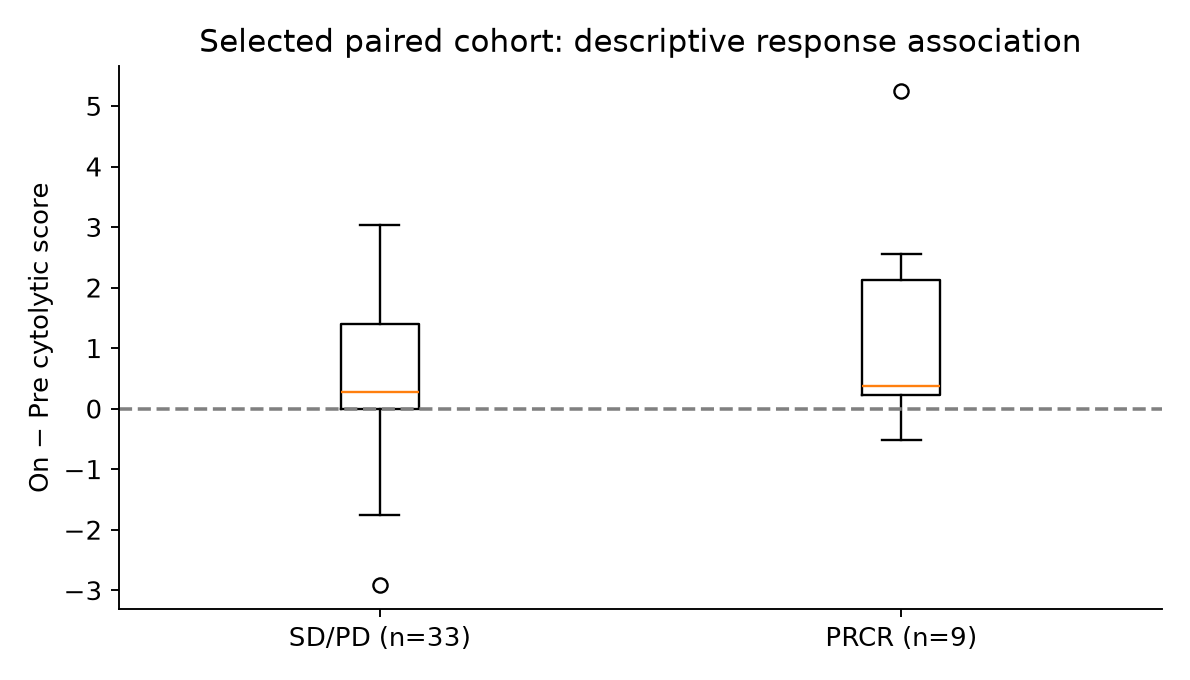
Two ridge logistic models were fixed: baseline primary score alone, and baseline plus its change. PRCR was compared with SD/PD; stable disease was not reclassified as response. There were only nine responders, so no extra clinical interactions, nonlinear terms, or outcome-selected cutoffs were added.
Three patient-stratified folds were repeated 20 times. Centering, scaling and coefficients were estimated in the training fold only. Both visits from a participant stayed together. The slope penalty was fixed at one; it was not selected to maximize the result. Repeated held-out probabilities were averaged per participant.
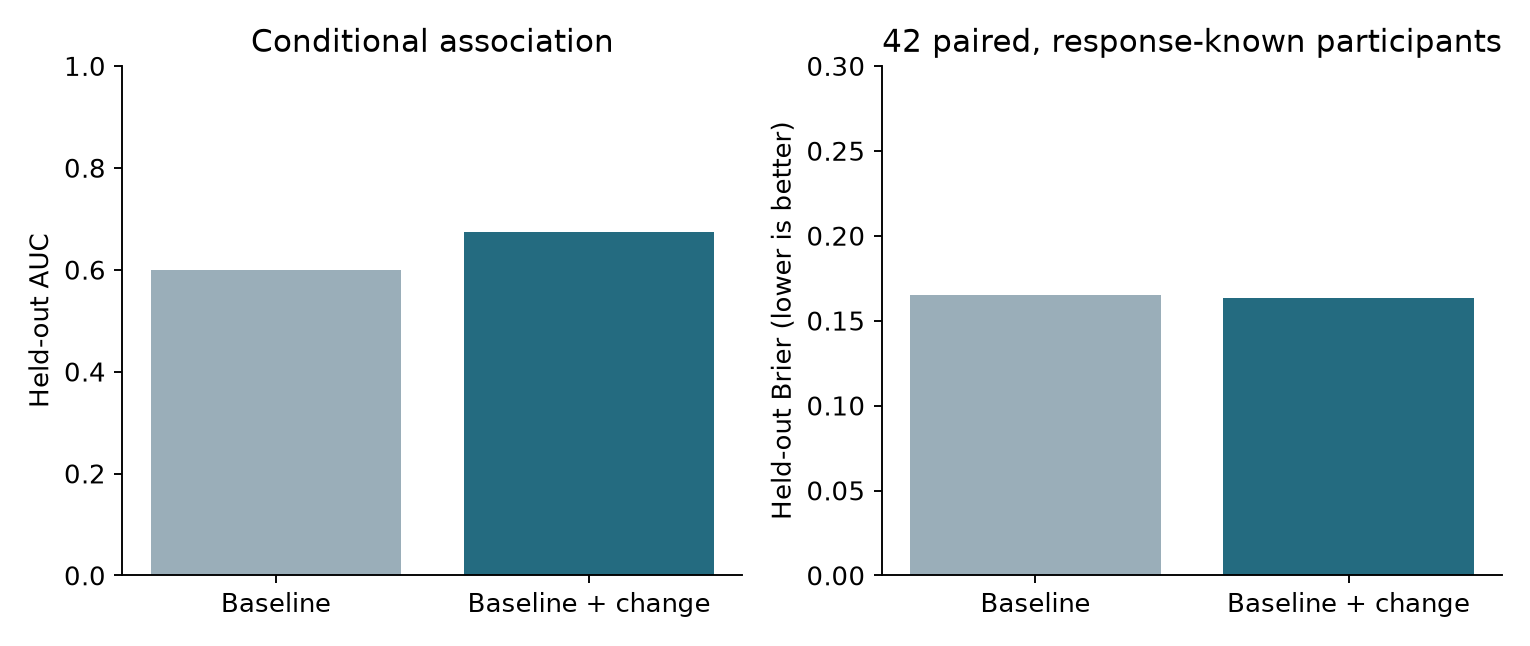
| Held-out measure | Baseline | Baseline + change |
|---|---|---|
| AUC | 0.599 | 0.673 |
| Brier score, lower is better | 0.1650 | 0.1635 |
| Log loss, lower is better | 0.5198 | 0.5042 |
The AUC difference was +0.074, with a stratified conditional bootstrap interval of −0.084 to +0.269. The Brier difference was −0.0015 (−0.0251 to +0.0232); log-loss difference was −0.0157 (−0.0946 to +0.0610). Each interval included no improvement. They condition on fitted held-out predictions, preserve the observed responder count, and omit uncertainty from refitting.
The extended model's held-out calibration slope was 0.648, with intercept −0.417 from an unpenalized calibration regression. With nine responders, these estimates are imprecise diagnostics; they do not qualify individual probabilities. The CPM sensitivity gave AUC 0.677 and Brier 0.1630 for the extended model, preserving the modest point improvement but not establishing clinical utility.
These are conditional association diagnostics in participants with available pairs, not pretreatment prediction. Best-response timing and individual biopsy dates cannot be ordered from these files. Patient-level cross-validation limits fitting leakage; it cannot repair selection into a second biopsy or qualify the information time of a clinical endpoint.
What observable selection reveals—and misses
| Pretreatment samples | Participants | Known responses | PRCR | Median baseline primary score |
|---|---|---|---|---|
| Also have an eligible on-treatment pair | 43 | 42 | 9 | 2.692 |
| No eligible on-treatment pair | 8 | 7 | 1 | 2.298 |
This small comparison records observable differences. It neither explains why an on-treatment biopsy is missing nor demonstrates that missingness is random. Other participants had only on-treatment specimens and could not enter this baseline comparison. Prior treatment, exact lesion composition and individual collection timing are not adjusted here.
What follows for a monitoring study
The data support a within-participant immune-expression shift among observed pairs. They provide weaker evidence that the primary change adds useful information about response. A further monitoring study should jointly record collection days, progression and response-assessment dates, biopsy failures, lesion/site identity, prior treatment, and assay quality. A prespecified post-biopsy endpoint and distinct validation cohort would allow the next question to be tested at a legitimate information time.
This analysis provides no PK measurements or exposure-linked response, and cannot justify dose adjustment. It also does not establish a novel immune biology discovery; it is a bounded reanalysis of an existing longitudinal cohort. Its contribution is a reproducible pairing audit, fixed low-dimensional summaries, normalization sensitivity, and an explicit separation of pharmacodynamic observation from predictive qualification.
Reproduce
The companion includes acquisition and analysis code, aggregate results, figures, and an executed notebook. Participant metadata, expression matrices, scores and prediction rows remain outside the archive. See README. Source manifests retain official URLs and SHA-256 hashes.
References
- Riaz N et al. Tumor and Microenvironment Evolution during Immunotherapy with Nivolumab. doi:10.1016/j.cell.2017.09.028, 2017.
- NCBI GEO GSE91061, official sample metadata and processed expression files.
- Rooney MS et al. Molecular and genetic properties of tumors associated with local immune cytolytic activity. doi:10.1016/j.cell.2014.12.033, 2015.
- Ayers M et al. IFN-γ-related mRNA profile predicts clinical response to PD-1 blockade. doi:10.1172/JCI91190, 2017. Gene-panel motivation; the original assay and cutoff were not reused.
Download code, aggregate results and executed notebook
Cite this article
Kumakura, D. (2026). What changes in paired tumor immune-expression measurements during nivolumab?. daikikumakura.github.io. https://daikikumakura.github.io/writing/on-treatment-immune-change.html