Do early tumor measurements improve prediction of subsequent survival?
A patient-separated landmark analysis of public colorectal cancer data, including calibration, censoring, uncertainty and temporal-integrity sensitivity.
Key findings
- In a public 150-patient colorectal-cancer subset, a week-16 landmark analysis (128 patients) used only tumor measurements available before the prediction time.
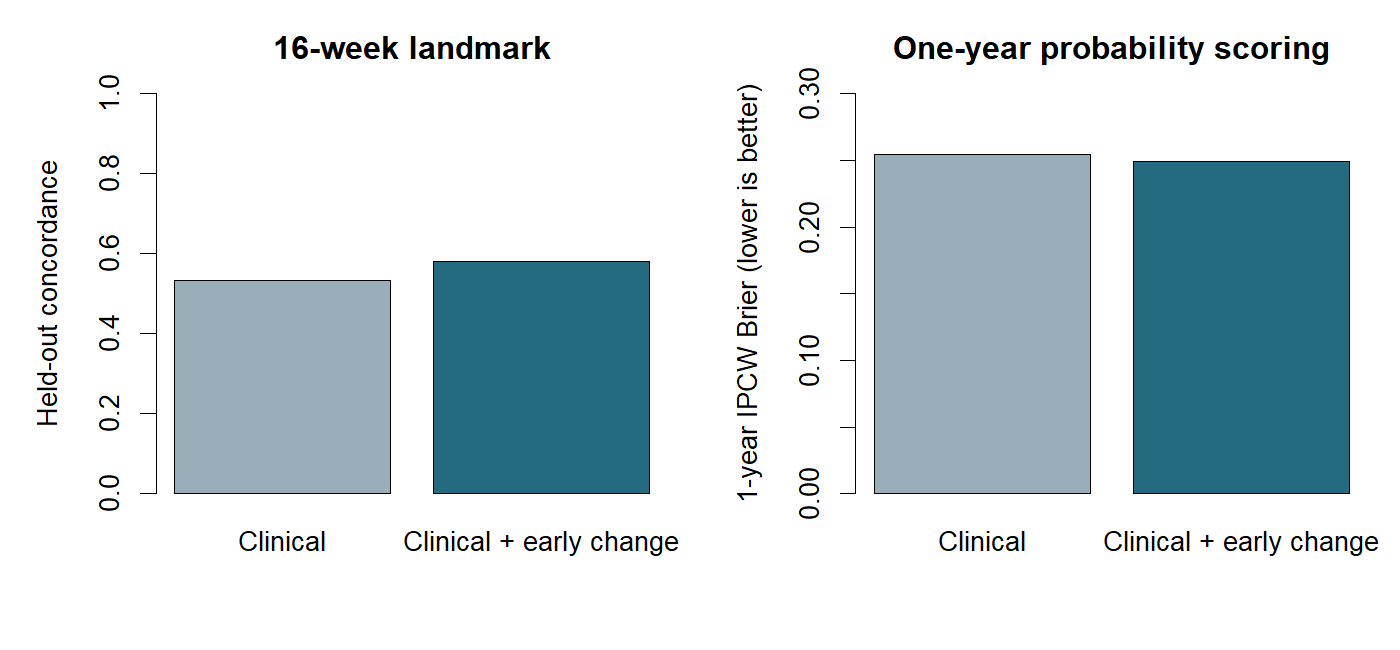
- Adding early tumor change raised held-out concordance from 0.532 to 0.581 (difference +0.049, 95% interval −0.005 to +0.106), and calibration stayed weak (slope 0.464).
- Early tumor change is a candidate for further study, not a survival surrogate or decision rule; a separate validation cohort and denser longitudinal data are needed.
On this page
In a public subset of a colorectal-cancer trial, adding early tumor change modestly improved held-out discrimination. The uncertainty interval included no improvement, and calibration remained weak. The data therefore support a candidate for further study rather than a survival surrogate or treatment decision rule.
日本語要約:早期腫瘍変化と、その後の生存との関連を、情報を利用できる時点をそろえて検証した。128人の16週landmark集団では検証時のC-indexが0.532から0.581へ上がったが、改善幅の区間はゼロを含んだ。腫瘍変化と生存が関連することと、臨床判断に使えることを区別する必要がある。
The question comes before the model
The question of interest was whether an early tumor measurement adds out-of-sample information about later overall survival beyond baseline clinical factors and tumor burden. The context of use is research prioritization: deciding whether early monitoring deserves further predictive study. This analysis does not assess treatment switching, dosing, causal mediation, or qualification of a treatment-effect surrogate.
A tempting analysis uses each patient's smallest tumor measurement, wherever it occurred, to predict survival from treatment initiation. That analysis uses information that was unavailable at the prediction time. It also gives patients who survive longer more opportunities to have a response recorded. Here, the prediction time is explicitly fixed at week 16, and only earlier measurements enter the predictors.
Data and the audit that changed the analysis
The colorectal and colorectalLongi datasets distributed in frailtypack 3.8.1 contain a random subset of 150 participants from the FFCD 2000–05 trial, comparing sequential and combination chemotherapy for metastatic colorectal cancer. The source-specific description in Chiou et al. establishes the time unit as years and corroborates the stored age categories. This is a secondary analysis of the distributed subset, not a reanalysis of the entire randomized trial. frailtypack documentation, Chiou et al., Journal of Statistical Software.
| Audit item | Finding and consequence |
|---|---|
| Participants | 150, with 906 longitudinal measurements and 289 survival/recurrent-event intervals |
| Terminal outcome | 121 deaths and 29 right-censored participants before exclusions |
| Record linkage | Participant IDs and stored clinical categories agreed across files |
| Time inconsistency | One measurement followed recorded death; exclude the affected participant in the primary analysis |
| Tumor scale | Box–Cox transformed, lambda 0.3; 34 measurements at a censoring floor |
| Endpoint | Overall survival; new-lesion records are not a qualified PFS definition |
| Age dictionary | Use stored <60, 60–69 and >69 years; preserve the discrepancy with the package help file |
Neither the time inconsistency nor the age dictionary was silently corrected. A sensitivity analysis retained the affected participant after removing only the inconsistent measurement. Raw participant records are not included in the companion archive; the acquisition and export scripts retrieve the official distribution. A software-package license does not establish every underlying clinical-data right.
A conditional landmark estimand
The primary landmark was 16 weeks, converted using 52.1775 weeks per year. Eligibility required survival and observation beyond the landmark, a baseline tumor measurement, and at least one positive-time measurement on or before week 16. After the integrity exclusion, 128 participants with 101 subsequent deaths entered the primary analysis. The target population is therefore the observed, landmark-eligible subset, not every randomized participant.
Two Cox models used exactly the same participants:
| Model | Predictors available by the landmark |
|---|---|
| Clinical | Treatment arm, two age-category indicators, WHO status ≥1, previous resection, baseline transformed tumor burden |
| Clinical + early change | Clinical predictors plus last early tumor value minus baseline and the time of that measurement |
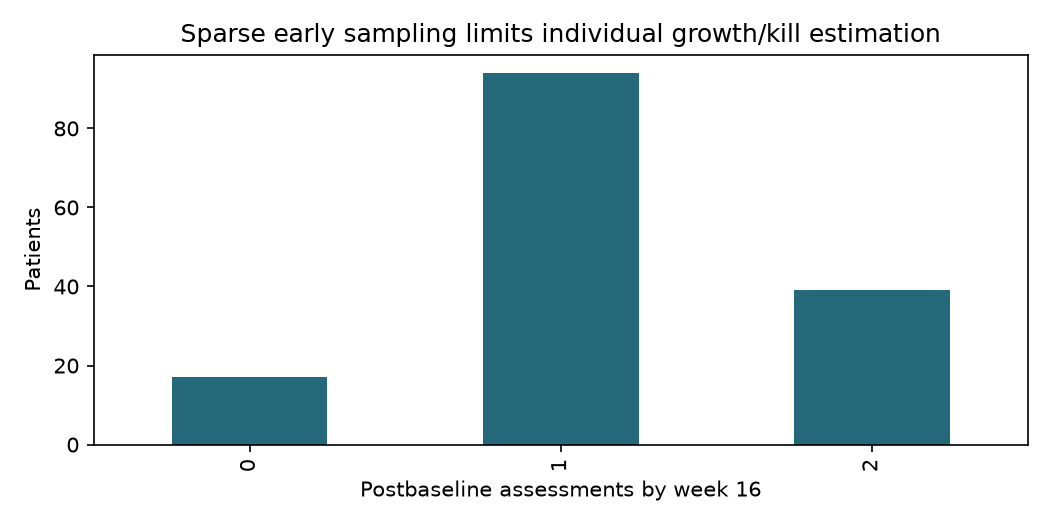
The measurement time enters because a change observed early and a change observed near week 16 have different observation windows. The extended model is an observed-feature model, not a mechanistic tumor-growth inhibition model. Sparse early sampling does not justify estimating individual growth and kill rates.
The floor-censored last measurement occurred in one primary participant. A bounded sensitivity used the transformed nonnegative-size lower bound −1/0.3 and the documented rounded floor −3.33. It is an approximate sensitivity analysis, not a censored longitudinal likelihood. It also does not fully address floor censoring in every baseline or follow-up measurement. Tumor values are not interpreted as millimeters or RECIST percentage changes.
Validation instead of an in-sample association claim
Five patient-separated folds were repeated ten times using a fixed seed. Each Cox model and its baseline hazard were estimated in the training fold. Test participants' later measurements never entered the predictors. Repeated held-out predictions were averaged per participant, yielding a cross-validated ensemble assessment rather than an estimate of the performance of one final deployed fit.
Reported measures were concordance, one-year IPCW Brier score, and calibration. Training-fold censoring survival at one year was at least 0.963, exceeding the prespecified 0.20 support threshold. For the averaged-prediction assessment, censoring estimates were also averaged over repeats; this is an approximation to repeated cross-fitted IPCW evaluation. Paired bootstrap intervals resampled participants 1,000 times conditional on these predictions. They exclude uncertainty from refitting and are not prospective external-validation intervals.
| Primary result | Clinical | Clinical + early change |
|---|---|---|
| Held-out concordance | 0.532 | 0.581 |
| One-year IPCW Brier score, lower is better | 0.2543 | 0.2492 |
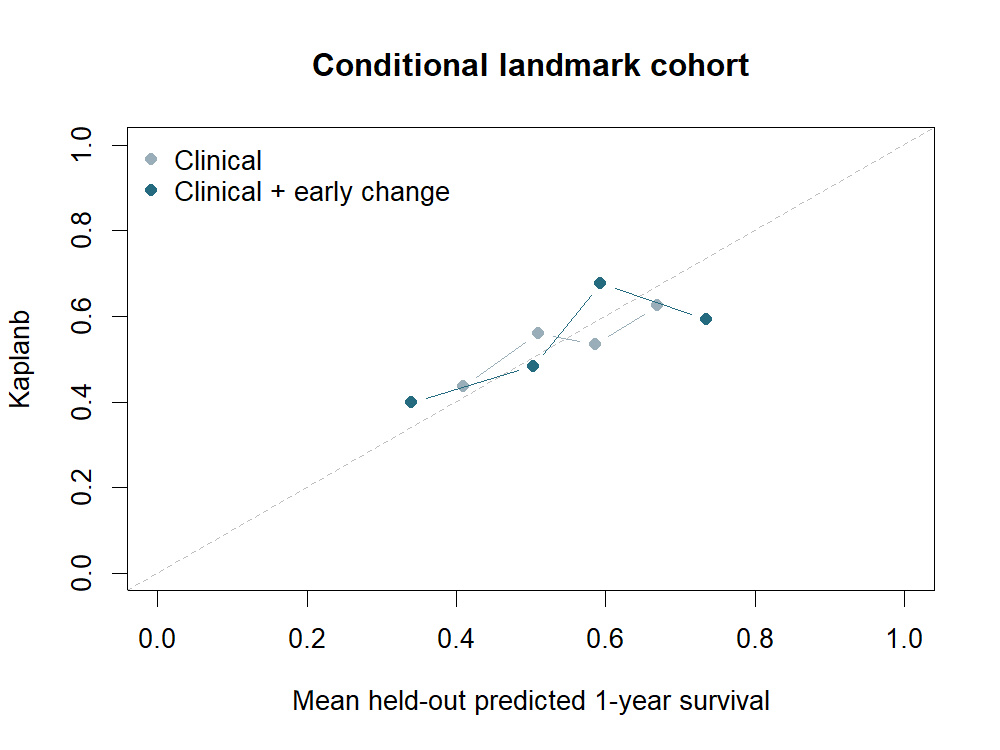
| Held-out calibration slope | 0.266 | 0.464 |
The concordance difference was +0.049, with a conditional 95% interval of −0.005 to +0.106. The Brier difference was −0.0051, with an interval of −0.0272 to +0.0172. Both intervals included zero. The extended model's calibration slope was 0.464 (0.081–0.847); a slope appreciably below one suggests overly strong risk separation in the held-out predictions.
The full-data extended model associated increasing transformed tumor burden with worse survival, but that association did not establish useful prediction. Schoenfeld-residual tests did not detect a global proportional-hazards departure (clinical p=0.58; extended p=0.76). These tests have limited power and do not certify the model.
Sensitivity changes the target population
| Landmark or integrity sensitivity | Participants / deaths | Clinical C | Extended C | Clinical Brier | Extended Brier |
|---|---|---|---|---|---|
| Week 12 | 116 / 91 | 0.551 | 0.588 | 0.2531 | 0.2469 |
| Week 16, primary | 128 / 101 | 0.532 | 0.581 | 0.2543 | 0.2492 |
| Week 24 | 123 / 97 | 0.514 | 0.550 | 0.2479 | 0.2308 |
| Week 16, retain participant but drop inconsistent row | 129 / 102 | 0.531 | 0.572 | 0.2542 | 0.2485 |
Changing landmarks changes eligibility and the information available. The week-24 result is not evidence that waiting longer is a superior clinical policy. The floor-bound sensitivity used identical primary folds and changed the extended Brier score by less than 0.000001. That small difference concerns this particular bounded numerical assumption; it does not remove selection bias or validate the tumor scale.
What the analysis supports
Early tumor change retained some association with subsequent survival and slightly improved held-out scores. The uncertainty and weak calibration prevent a stronger predictive claim. Further work would need denser longitudinal measurement, explicit censoring-aware trajectory estimation where identifiable, a distinct validation cohort, and an observation-process analysis.
The randomized origin does not make this landmark-selected secondary analysis a causal comparison of treatment strategies. Treatment effects on tumor change and survival are not sufficient to qualify a surrogate, and this dataset lacks the PK and dose histories needed for a dose–exposure–tumor–survival chain. For model-informed research, the practical lesson is to establish the information time and endpoint before escalating the model's complexity.
Reproduce the analysis
The companion contains acquisition scripts, R estimation code, aggregate tables, figures, and an executed notebook. It excludes participant-level CSVs and private planning documents. Run acquisition, R export, and analyze.R in that order. Numerical work used R 4.5.1 and survival 3.8-3. See the companion instructions.
Sources
- frailtypack 3.8.1, official CRAN distribution and longitudinal dataset documentation. Source archive SHA-256 and extracted-file hashes are recorded with the acquisition script.
- Chiou SH et al. Regression Modeling for Recurrent Events Possibly with an Informative Terminal Event Using R Package reReg. Journal of Statistical Software 105(5), 2023. doi:10.18637/jss.v105.i05. Used to reconcile source-specific units and cohort definitions.
- survival package documentation, Cox regression, concordance and proportional-hazards diagnostics. Methods were implemented locally; this article reports secondary-analysis results, not findings attributed to the package authors.
Download code, aggregate results and executed notebook
Cite this article
Kumakura, D. (2026). Do early tumor measurements improve prediction of subsequent survival?. daikikumakura.github.io. https://daikikumakura.github.io/writing/tumor-dynamics-survival.html