Do two immune-biology scores improve response prediction across urothelial cancer cohorts?
Fixed Teff and stromal features evaluated across public urothelial cancer cohorts, with discrimination, calibration, missingness and transport limits.
Key findings
- Adding fixed T-effector and stromal RNA scores to a minimal clinical model raised cross-validated response AUC from 0.509 to 0.645 in the development cohort (298 patients, 68 responders).
- In the external-source cohort (72 patients, 11 responders), the fixed model reached AUC 0.554 (95% interval 0.367–0.725) and probability calibration was poor.
- The two scores support a biological hypothesis worth further study, not a clinically useful biomarker, an individual response probability or a prediction of who benefits from checkpoint inhibition.
On this page
- The question and its intended use
- Start with the patient and source audit
- Fix a minimal model before examining external performance
- Results: relative improvement is not adequate absolute performance
- Calibration and population shift
- What this analysis supports—and what it does not
- Reproduce and review
A small immune-feature model improved discrimination relative to a weak clinical comparator, but it did not become a reliable response predictor in the external-source cohort. Its external AUC was 0.554 (95% interval 0.367–0.725), and calibration was poor. The useful result is a boundary on the hypothesis: two interpretable RNA scores can carry information in development, while transport of their probability predictions remains unresolved.
日本語要約: 個人別の公開RNA・臨床データから、ECOGと性別のモデルにTeff・間質の2指標を加えた。開発データの交差検証では識別性能が改善したが、外部データではAUC 0.554、応答11例に留まり、確率予測の校正も不十分だった。相対的な改善だけで実用性や治療効果予測を主張しない。
The question and its intended use
Does adding a T-effector score and a stromal score to minimal clinical information improve prediction of reported CR/PR in a second checkpoint-inhibitor-treated urothelial cancer cohort? This is a research exercise for deciding which biomarker hypotheses merit further work. It does not support treatment selection, an individual response estimate, causal treatment benefit, or a dose decision.
The distinction between association and treatment-effect prediction is central. Both sources contain treated patients. There is no randomized untreated or alternative-treatment comparator here. A feature associated with outcome could reflect general prognosis, treatment sensitivity, selection into an RNA-assayed subset, or several mechanisms together.
Mariathasan et al. (2018) connected T-cell effector biology and stromal TGFβ signaling with outcomes under atezolizumab, including an immune-excluded context. Bulk stromal expression alone does not measure spatial T-cell exclusion. Rose et al. (2021) reported a separate real-world urothelial cancer series. These are established published biological hypotheses and cohorts: the present work is a transparent reassessment, not a new discovery or prospective validation.
Start with the patient and source audit
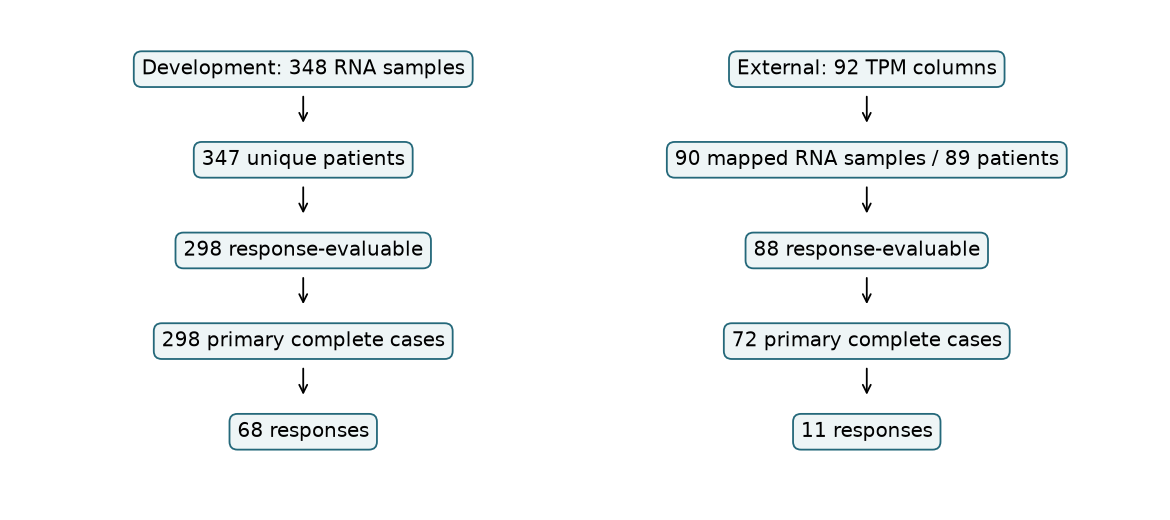
The development bundle contains 348 RNA samples, representing 347 anonymized patients. One patient has two samples with consistent response and clinical labels; their TPM values were averaged. There are 298 response-evaluable patients, including 68 CR/PR responses. Unknown or NE response was excluded, rather than assigned nonresponse.
For GSE176307, the published clinical series has 103 patients. The current processed matrix has 92 RNA columns. The sample key maps 90 columns to GEO samples and 89 unique patients; the two unmapped columns were excluded. One patient has two RNA measurements, averaged after confirming matching clinical fields. There are 88 response-evaluable RNA patients, but only 72 with the primary clinical predictors observed. This external analysis therefore includes 11 responses, not all patients in the reported series.
The original development distribution server did not respond during acquisition. I used a pinned mirror of IMvigor210CoreBiologies, retaining the source URL, commit and SHA-256 of every downloaded file. Original bundle authors are Dorothee Nickles and Richard Bourgon. The mirror's license document states Creative Commons Attribution 3.0 Unported; the original manuscript also describes the processed bundle as freely available under a Creative Commons license. The mirror was not byte-verified against the unavailable publisher server. A checksum establishes which artifact was analyzed; it does not establish original-source authenticity.
GEO processed data were obtained directly from the NCBI FTP distribution. Availability is not a universal license for redistributing all underlying participant records. The companion release supplies acquisition instructions and aggregate results; it excludes patient-level clinical and RNA matrices. Source permissions and attribution must be reviewed before reuse in another context.
The two studies provide different source cohorts, but their anonymized identifiers cannot prove that no patient appears in both. Individual biopsy timing is not adequately encoded in the joined metadata. Aggregate pretreatment descriptions should not be substituted for patient-level verification. OS and PFS fields exist, but a common endpoint, time-unit and censoring dictionary was not established in this audit; they were not analyzed. TMB was also withheld because targeted panels and measurement comparability were not harmonized.
Fix a minimal model before examining external performance
The analysis plan was written after reviewing data availability and response counts, before fitting or assessing external performance. This is not blinded or prospectively registered validation. RNA annotation availability in the external source was used to define the common gene universe; the evaluation is therefore not an untouched end-to-end validation of gene preprocessing.
The clinical model uses ECOG ≥1 and male sex. The augmented model adds two continuous scores. Neither was chosen by external response association, and no threshold was optimized:
- Teff8: CD8A, GZMA, GZMB, IFNG, CXCL9, CXCL10, PRF1, TBX21.
- Stroma19: ACTA2, ACTG2, ADAM12, ADAM19, CNN1, COL4A1, CTGF, CTPS1, FAM101B, FSTL3, HSPB1, IGFBP3, PXDC1, SEMA7A, SH3PXD2A, TAGLN, TGFBI, TNS1, TPM1.
The second list is the distributed bundle's gene19 signature. It is a stromal/fibroblast-related feature, not a direct assay of TGFβ activity or physical exclusion, and not an exact reconstruction of the published PanF-TBRS scoring algorithm.
Development counts were divided by annotated gene length and converted to TPM. TPM values sharing a gene symbol were summed. External processed TPM was used as distributed. Each signature score is the mean of its genes' within-sample percentile ranks among 24,296 common gene symbols; ties receive average ranks. All 27 signature genes are present. This common-rank approach reduces dependence on absolute abundance scale without eliminating sequencing, annotation, composition or specimen differences.
The fitted probability is

Estimation minimizes summed logistic negative log likelihood plus half the sum of squared non-intercept coefficients. The intercept is unpenalized, the ridge penalty is fixed at 1, and there is no hyperparameter search. This stabilizes a deliberately small model; it does not make its coefficients unbiased causal effects.
Internal evaluation uses five patient-level stratified folds repeated ten times. Feature scaling and coefficient estimation occur within each training fold. Each patient's ten held-out probabilities are averaged. The resulting metrics describe aggregated repeated-CV predictions. Final coefficients and scales are then fitted on development only and saved in a frozen model artifact before external scoring. Its hash is checked unchanged after evaluation. No validation-cohort centering, coefficient update, gene selection or cutoff optimization is applied.
Results: relative improvement is not adequate absolute performance
| cohort | model | metric | value | lower | upper | n | events |
|---|---|---|---|---|---|---|---|
| Repeated CV | Clinical | AUC | 0.509 | 0.423 | 0.588 | 298 | 68 |
| Repeated CV | Clinical | Brier | 0.173 | 0.147 | 0.199 | 298 | 68 |
| Repeated CV | Clinical | Log loss | 0.530 | 0.468 | 0.591 | 298 | 68 |
| Repeated CV | Clinical + immune | AUC | 0.645 | 0.567 | 0.720 | 298 | 68 |
| Repeated CV | Clinical + immune | Brier | 0.167 | 0.142 | 0.193 | 298 | 68 |
| Repeated CV | Clinical + immune | Log loss | 0.512 | 0.451 | 0.575 | 298 | 68 |
| External | Clinical | AUC | 0.437 | 0.284 | 0.582 | 72 | 11 |
| External | Clinical | Brier | 0.142 | 0.092 | 0.198 | 72 | 11 |
| External | Clinical | Log loss | 0.461 | 0.341 | 0.594 | 72 | 11 |
| External | Clinical + immune | AUC | 0.554 | 0.367 | 0.725 | 72 | 11 |
| External | Clinical + immune | Brier | 0.135 | 0.079 | 0.200 | 72 | 11 |
| External | Clinical + immune | Log loss | 0.445 | 0.289 | 0.624 | 72 | 11 |
Intervals are percentile intervals from 2,000 patient resamples. External intervals condition on the fitted development models and do not include development-model estimation uncertainty. Internal intervals condition on the averaged out-of-fold predictions and do not refit the CV procedure; they should not be treated as comprehensive uncertainty for model development.
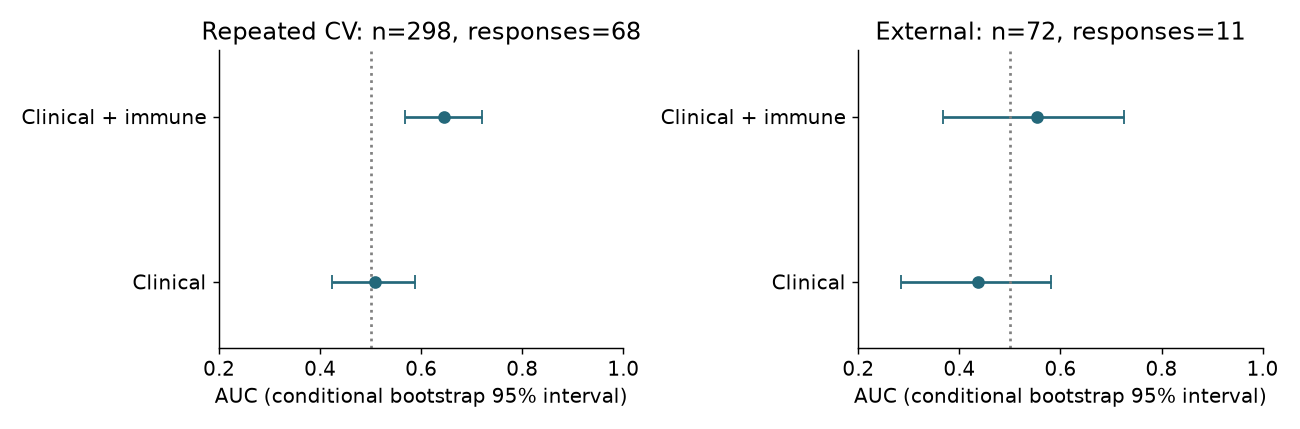
The clinical comparator has little useful discrimination in this dataset. Adding immune features improves repeated-CV AUC from 0.509 to 0.645. Externally, the apparent increase from 0.437 to 0.554 is real as a paired numerical contrast, but the augmented model's absolute AUC interval includes 0.5. Beating a weak comparator does not establish useful prediction.
| cohort | metric | delta | lower | upper | valid_bootstraps |
|---|---|---|---|---|---|
| Repeated CV | AUC | 0.136 | 0.071 | 0.204 | 2000 |
| Repeated CV | Brier | -0.006 | -0.015 | 0.003 | 2000 |
| Repeated CV | Log loss | -0.018 | -0.041 | 0.005 | 2000 |
| External | AUC | 0.117 | 0.019 | 0.224 | 2000 |
| External | Brier | -0.007 | -0.019 | 0.005 | 2000 |
| External | Log loss | -0.016 | -0.064 | 0.037 | 2000 |
Positive AUC differences favor the immune model; negative Brier and log-loss differences favor it. Although the conditional paired AUC interval excludes zero externally, both probability-score improvement intervals include zero. With only 11 external responses, these results do not establish robust added predictive value.
For scale, predicting the observed response fraction for everyone gives an in-sample constant-probability Brier score of approximately 0.176 in development and 0.129 externally. The external constant uses external outcomes, so it is an explanatory benchmark, not a deployable validation competitor. The augmented model's external Brier score is 0.135.
Calibration and population shift
| model | offset_intercept | joint_intercept | slope |
|---|---|---|---|
| Clinical | -0.338 | -2.967 | -0.852 |
| Clinical + immune | 0.172 | -1.226 | 0.242 |
The offset intercept fixes the slope at one and describes calibration-in-the-large. The joint intercept and slope are separate diagnostic fits to external outcomes; they are not used to update the frozen predictions. The augmented model's joint calibration slope is only 0.242. Its offset intercept is near zero, but agreement in average risk does not mean that individual probability contrasts are well calibrated. These diagnostic estimates have substantial uncertainty with 11 responses; no precise calibration claim is justified.
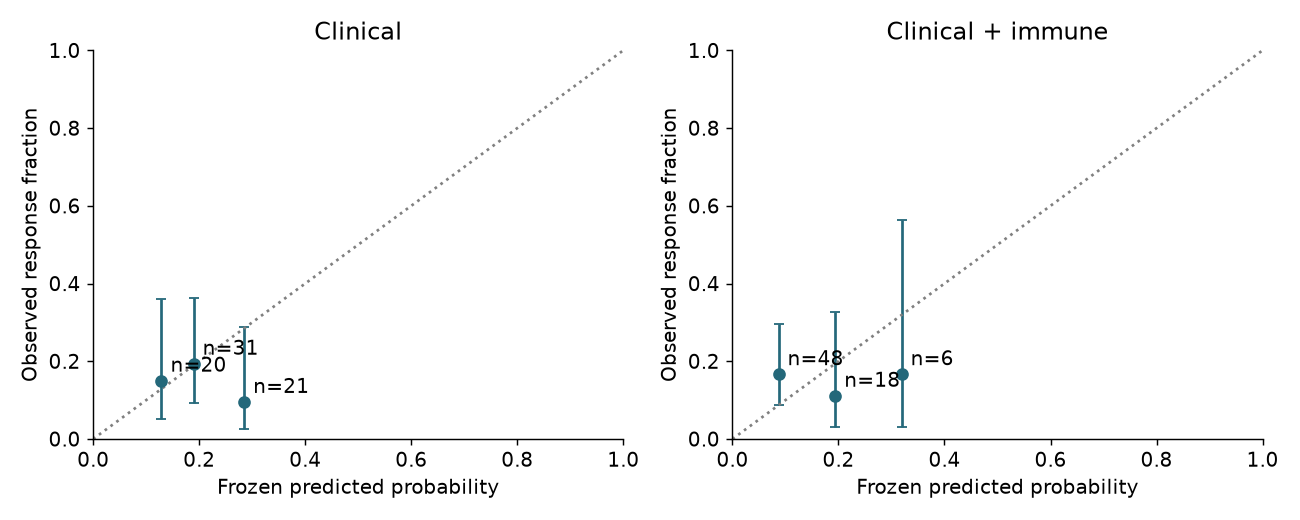
Bins use frozen development-prediction tertile boundaries. Points show external observed response fractions, with Wilson 95% intervals and denominators. They are descriptive and should not be used to choose a clinical cutoff.
| cohort | n | responders | response_fraction | ecog_ge1_fraction | male_fraction | Teff_mean | Stroma_mean |
|---|---|---|---|---|---|---|---|
| Development | 298 | 68 | 0.228 | 0.594 | 0.782 | 0.605 | 0.805 |
| External | 72 | 11 | 0.153 | 0.708 | 0.597 | 0.467 | 0.807 |
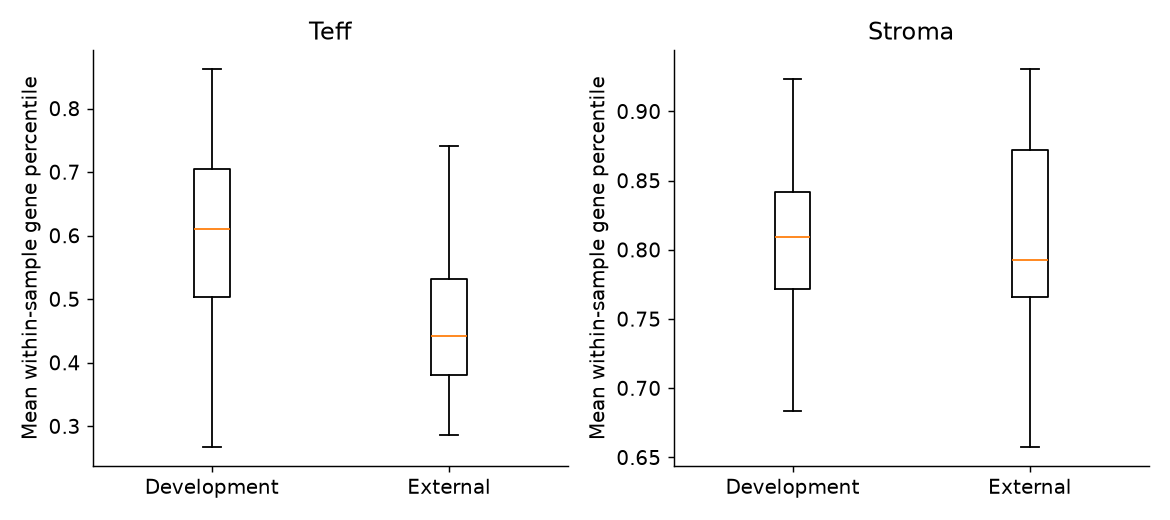
The Teff mean falls from 0.605 to 0.467 despite within-sample ranking. The external response fraction is lower, ECOG distribution and sex mix differ, and the real-world source includes several PD-1/PD-L1 agents rather than a single atezolizumab setting. The data cannot separate biological composition changes from assay or selection effects. Seventeen of the 89 external RNA patients lack ECOG; complete-case selection loses 16 response-evaluable patients and could bias performance. This is an unresolved transport problem, not a reason to recenter the external cohort until it looks like development.
A prespecified liver-adjusted sensitivity was fitted on 271 development complete cases and applied unchanged to the 72 external cases. External AUC was 0.581, Brier 0.133 and log loss 0.435. This is descriptive, does not establish reliable calibration, and cannot be ranked as the preferred model using external performance. Development liver disease category and external cumulative liver-metastasis flags are not perfectly matched measurements.
What this analysis supports—and what it does not
The two immune features carry development-cohort response information beyond this minimal clinical comparator. Their fixed external predictions retain a small relative discrimination advantage, but remain weak in absolute terms, and probability-score gains are uncertain. Calibration, sample selection, assay transfer and patient-level provenance limit the interpretation.
A useful next study would prospectively define the specimen timing, response ascertainment and clinical dictionary; harmonize assay processing; verify distinct participants; and collect enough events to evaluate calibration and clinical utility. If the goal is treatment-benefit prediction, a suitable comparative design is needed. Adding more genes or recalibrating on these 11 responses would answer a different question and would require a new validation dataset.
This work can prioritize a biological hypothesis. It cannot establish a clinically useful biomarker, an individual's response probability, or who benefits from checkpoint inhibition.
Reproduce and review
The companion includes the fixed plan, source hashes, gene universe, extraction and analysis scripts, aggregate result tables, four analytical figures and a model equation, fitted coefficients, integrity checks and an executed review notebook. Patient-level observations are downloaded separately and are not bundled. See README for versions, the extraction caveat and ordered commands. Full analysis is reproducible from pinned inputs; the notebook verifies the resulting artifacts and displays the results.
Download the companion: code, aggregate results and executed notebook
Cite this article
Kumakura, D. (2026). Do two immune-biology scores improve response prediction across urothelial cancer cohorts?. daikikumakura.github.io. https://daikikumakura.github.io/writing/immune-outcome-validation.html