Can increasing TCE concentration compensate for impaired T-cell function?
Reanalysis of human TYRP1 TCE assay means distinguishes low response ceilings from unstable high-concentration extrapolation.
On this page
A weak response to a T-cell engager (TCE) can reflect a higher concentration requirement, a lower response ceiling, or both. I digitized a published human T-cell assay to examine this distinction with concentration–response curves.
At the highest observed concentration, baseline-subtracted signals from chronically stimulated T cells were approximately 30% and 55% of the matched effector-cell signals. These are ratios of luminescence signals, not percentages of cells killed. When the highest concentration was withheld, the lower concentrations did not reliably identify the effector-cell ceiling.
The measured endpoint is luminescence
The source study generated acutely stimulated effector cells (Teff) and chronically stimulated cells (Tex) from human CD8-positive T cells expressing a MART-1-specific T-cell receptor (TCR). The same CHOK1SV-TYRP1 target cells (expressing tyrosinase-related protein 1) and the T cell bispecific antibody (TCB) huTyrp1-TCB were used to measure cytolytic activity at 48 hours. The original Figure 6b reports relative luminescence units per second (RLU/s) for two healthy donors. Each symbol represents the mean of technical duplicates; these duplicates are not additional biological donors (1).
The question is whether an EC50 shift alone describes the Teff–Tex difference, or whether a response-ceiling difference is also needed. The context of use is interpretation and concentration selection within this assay. It does not determine patient dose escalation or treatment holidays.
Only the filled MART-1 Teff and Tex symbols were read: five positive concentrations per state and donor, or 20 means in total. Untransduced Teff and control-TCB curves were not pooled with them. The zero-concentration symbol for each curve supplied its baseline. Concentrations were also read from the logarithmic axis and are approximate readings, not the original preparation records.
Concentration response and response ceilings
Baseline-subtracted luminescence was represented by
\[ Y_s(c)=E_s\frac{c^{h_s}}{EC_{50,s}^{h_s}+c^{h_s}}. \]
Here \(c\) is TCB concentration, \(s\) denotes Teff or Tex, and \(E_s\) is the incremental luminescence ceiling. \(EC_{50,s}\) is the concentration giving half of that curve's own ceiling (half-maximal effective concentration), not the concentration that kills an absolute 50% of target cells.
The descriptive full-data comparison fitted three models: a common ceiling and Hill coefficient with state-specific EC50s; state-specific ceilings while retaining a common Hill coefficient; and state-specific ceilings and Hill coefficients. The first two differ only in the ceiling constraint, avoiding attribution of a Hill-slope change to a ceiling difference. Without independent culture values or their covariance, I used equal-weight least squares on the plotted means. Comparing residual errors between models with different numbers of parameters is not a significance test or proof of a mechanism.
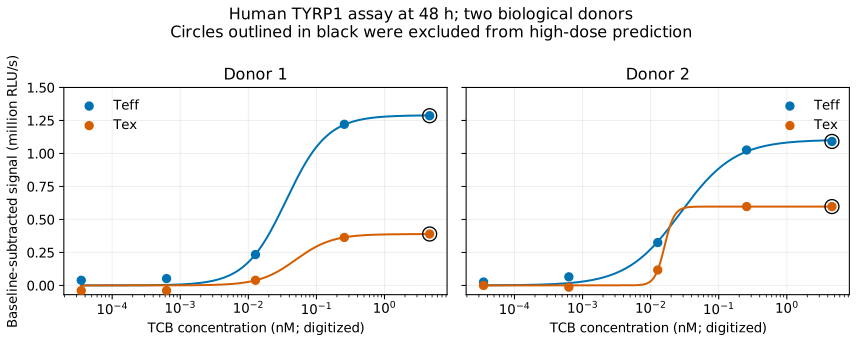
Figure 1. Observed concentration responses and full-data descriptive fits for two donors. The highest-concentration symbols outlined in black were separately withheld for prediction. Solid lines in Figure 1 are full-data descriptive fits, not curves fitted without those symbols.
Table 1. Within-donor observed ratios and model errors.
| Donor | Observed high-concentration Tex/Teff ratio | Fitted ceiling ratio | Common ceiling and Hill RMSE | Separate ceilings with common Hill RMSE | Separate ceilings and Hill RMSE |
|---|---|---|---|---|---|
| 1 | 0.303 | 0.302 | 0.113 | 0.026 | 0.026 |
| 2 | 0.548 | 0.541 | 0.115 | 0.023 | 0.018 |
Root mean squared error (RMSE) is in million RLU/s. Results are in outputs/tables/ceiling-comparison.csv. Fitted ceiling ratios and solid curves use separate ceilings and Hill coefficients. Allowing separate ceilings also reduced error when the Hill coefficient remained common. The observed high-concentration ratio requires no extrapolation of a fitted ceiling. Signals are compared within donor; RLU values are not pooled across donors as if they shared an identical biological scale.
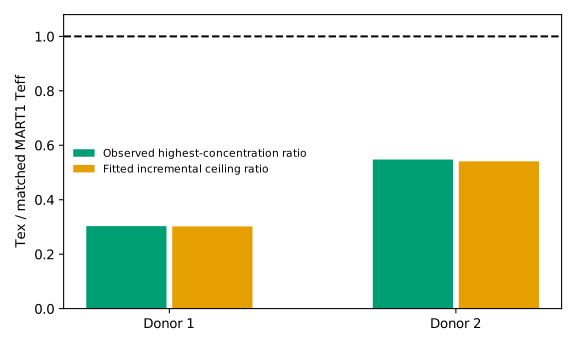
Figure 2. Within-donor Tex/Teff ratios for baseline-subtracted signals at the highest observed concentration and ceilings estimated by the full-data Hill model. Neither is a ratio of cell-killing percentages.
Withholding the highest concentration exposes instability
For each curve, the four lower positive concentrations were used to predict the remaining highest concentration. This is retrospective concentration extrapolation from a public figure, not validation in a new donor.
Table 2. Predictions excluding the highest concentration.
| Donor | State | Observed highest-concentration signal | Prediction from lower concentrations |
|---|---|---|---|
| 1 | Teff | 1.286 | 3.282 |
| 1 | Tex | 0.390 | 0.364 |
| 2 | Teff | 1.091 | 1.720 |
| 2 | Tex | 0.597 | 0.597 |
Units are million RLU/s; see outputs/tables/heldout-prediction.csv. The Teff predictions overshot. Observing the rising portion of a curve does not necessarily identify its eventual plateau. A good full-data fit conceals this problem.
In 2,000 reading scenarios that independently shifted each highest-concentration symbol by ±2 vertical pixels, the Tex/Teff ratio ranged from 0.278 to 0.329 for donor 1 and from 0.513 to 0.585 for donor 2. These are reading-sensitivity ranges, not confidence intervals for a donor population. They do not include horizontal-axis calibration errors or original experimental variability (outputs/tables/reading-sensitivity.csv).
A 48-hour ceiling is not an intrinsic T-cell constant
In the original Figure 6c–g, Tex also showed lower Granzyme B induction and secretion of cytokines and cytotoxicity-associated proteins. Supplementary Figure S5 reports persistently lower TCR/CD3 surface expression after chronic stimulation and subsequent rest. These observations are consistent with the luminescence difference; the present curves do not partition that difference between CD3 availability and downstream function (1).
The Hill ceiling summarizes a 48-hour culture endpoint with matched initial cell counts. It does not separately estimate survival, proliferation during culture and per-cell activity, and is not a permanent intrinsic killing capacity. Increasing concentration also differs from changing measurement time or cell state.
Subtracting the same zero-concentration reading from all points introduces a shared baseline-reading error. The ±2-pixel scenarios vary only the highest-concentration symbols, not baseline or shared axis errors. Narrow ratio ranges therefore do not establish high precision of the entire ceiling estimate.
A difference not readily summarized by potency alone
The lower Tex than Teff signal at the upper observed concentrations, and the large error reduction when ceilings are state specific, indicate a difference that is difficult to summarize as a rightward shift alone. The close agreement between the observed highest-concentration ratio and the full-data fitted ceiling ratio is expected because the fit includes that highest-concentration point; it is not independent confirmation. A finite concentration range does not establish the true infinite-concentration maximum. Behavior outside that range remains unmeasured.
This distinction matters when asking whether more drug restores a response. In these two donors, increasing concentration through the observed maximum did not bring Tex to the matched Teff luminescence signal. That does not establish that patient dose escalation is ineffective, and T-cell functional recovery was not measured here. The supported conclusion is narrower: summarizing a weak concentration response by EC50 alone can omit a response difference at the upper end of the measured concentration range.
Data and code availability
Code, reading coordinates, and result tables. Run analysis/download_sources.py, analysis/run.py, and python -m unittest discover -s tests in that order. The full source image is not redistributed; its public URL and SHA-256 are recorded. This is a reanalysis of aggregate assay means, not individual-level modeling or population pharmacokinetic analysis.
References
- Hutter-Karakoc I, Varypataki EM, Neelakandhan A, Lang S, Kramar V, Varol A, et al. Chronic antigen stimulation in melanoma induces T cell exhaustion and limits efficacy of T cell bispecific therapies. Oncoimmunology. 2025;14(1):2526444. doi:10.1080/2162402X.2025.2526444.