Can antigen-positive fractions predict residual antigen-negative cells after a TCE?
Testing a one-parameter model on held-out HER2-positive mixture fractions and separated tumoroids reveals limits of a fraction-only explanation.
On this page
- Question and intended use
- Counting positive and negative cells separately
- Below control does not mean below the initial count
- Predicting excluded mixture fractions with one coefficient
- Digitization uncertainty does not explain all discrepancies
- Separating clusters changes negative-cell abundance
- Model discrepancies and the original mechanistic experiments
- Fractions alone cannot separate arrangement and growth
- Data and code availability
- References
When a T-cell engager (TCE) attacks antigen-positive cancer cells, nearby antigen-negative cells may also decline. Such bystander effects change the simple expectation that cells lacking the target will escape. But can the initial positive fraction predict how many negative cells remain?
I digitized public experiments mixing HER2-positive and negative cells and used a one-parameter model to predict mixture conditions excluded from fitting. Error was smaller than for a no-indirect-effect reference, but predictions missed the 20% and 50% positive conditions. A separate experiment changing distances between clusters also showed markedly different residual abundance. Drawing a curve through positive fractions does not establish prediction under different spatial arrangements.
Question and intended use
The question is whether the initial antigen-positive fraction predicts the abundance of antigen-negative cells after five days. The endpoint model compares positive fractions and spatial arrangements in mixed cultures.
The outcome is cell abundance under fixed antibody concentrations and culture conditions. It does not determine clinical doses, treatment intervals or patient eligibility. Mixing HER2-knockout cells does not support translating the results to HER2-low tumors or DLL3-targeting TCEs.
Counting positive and negative cells separately
Liao and colleagues produced three-dimensional tumoroids from BT474 cells and HER2-negative cells with ERBB2 knocked out. Distinct labels allowed day-0 and day-5 counts for each population. Resting T cells and a CD3×HER2 bispecific antibody were added while mixture fractions and cluster arrangements were varied (1).
Mixtures contained nominal positive fractions of 20%, 50% and 80%, alongside positive-only and negative-only conditions. Antibody concentration was 1 µg/mL, with 50,000 T cells added to approximately 5,000 initial tumor cells (1).
Table 1. Source panels and units of replication.
| Source | Digitized quantity | Independent experiments and cultures |
|---|---|---|
| Original Figure 2D | Day 5/day 0 abundance with T cells and antibody | 3 independent experiments; 2 cultures per condition |
| Supplementary Figure 3C | Corresponding abundance ratio with T cells only | 3 independent experiments; 1 culture per condition |
| Original Figure 3D | Corresponding ratio for separated positive and negative clusters | 4 independent experiments with antibody and 3 with T cells only; 1 culture each |
Individual measurements were not recovered in tabular form. I read mean bar heights from the public figures. Although the original figures show means ± standard error of the mean (SEM), the reconstructed inputs are 24 bar means, not 24 donors or independent individual records. Two technical cultures are not counted as two independent experiments.
Counts derive from analysis of labeled z-stack images. The original processing includes removal of small image objects. Fluorescence-derived counts are not exact counts of all potentially unobserved cells or direct numbers of deaths (1). A positive-only population contains no negative cells, so its negative-cell fold change is undefined rather than imputed as zero.
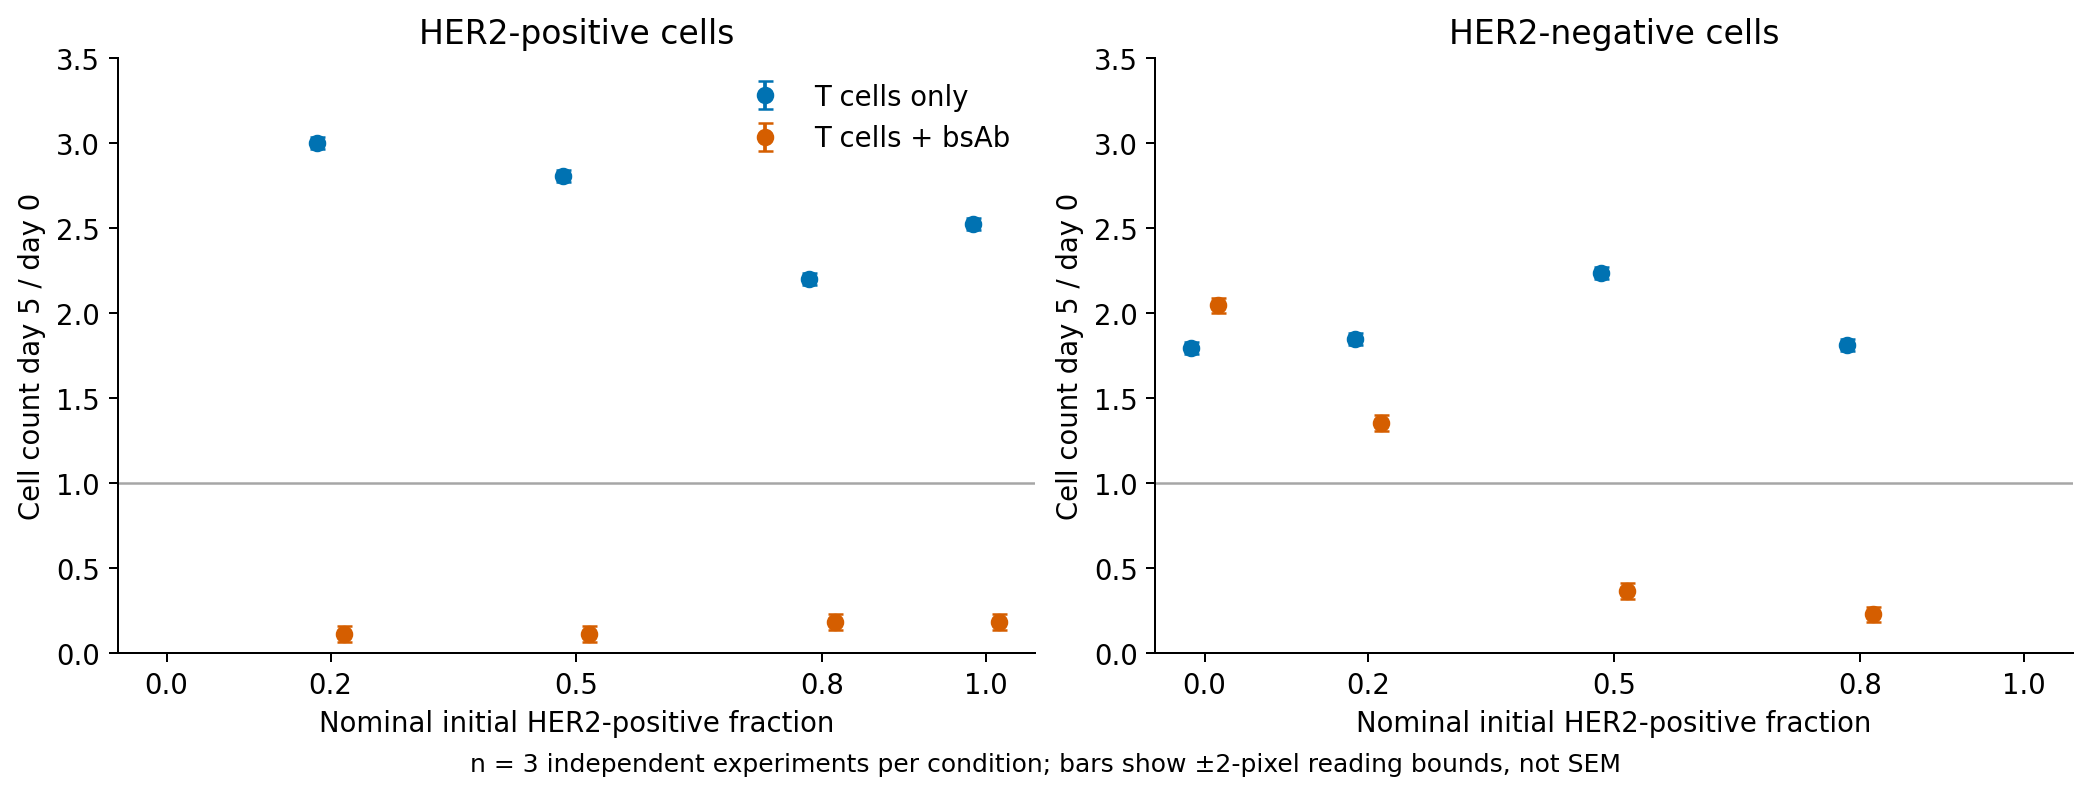
Figure 1. Replotted published means. The horizontal line denotes equal day-5 and day-0 abundance. Vertical ranges represent ±2 source-image pixels, not the original SEM. Treatments are offset horizontally. Adapted from Liao et al., Figure 2D and Supplementary Figure 3C (1).
Below control does not mean below the initial count
Let \(f\) denote the positive fraction and \(N_-\) the negative-cell count. First define the within-condition fold change:
\[ F_-(f)=\frac{N_-(5\ \mathrm{day};f)}{N_-(0;f)} \]
A value \(F_-<1\) means fewer negative cells than initially. T-cell-only cultures also grow during five days, so the treatment-to-control ratio is a separate quantity:
\[ R_-(f)=\frac{F_-^{\mathrm{T+bsAb}}(f)}{F_-^{\mathrm{T\ only}}(f)} \]
The denominator is the matching mixture mean from Supplementary Figure 3C. Experiment-level pairing and covariance across panels were not recovered. This is a ratio of two means, not an average of culture-level ratios. Biological confidence intervals and significance tests were not reconstructed.
Table 2. Negative-cell fold changes and treatment-to-control ratios.
| Initial positive fraction | \(F_-\), T cells + antibody | \(F_-\), T cells only | Control ratio \(R_-\) |
|---|---|---|---|
| 20% | Approximately 1.36 | Approximately 1.85 | Approximately 0.73 |
| 50% | Approximately 0.37 | Approximately 2.24 | Approximately 0.16 |
| 80% | Approximately 0.23 | Approximately 1.81 | Approximately 0.13 |
At 20%, negative cells are less abundant than in control but increase to approximately 1.36 times their initial count. Reduced expansion and depletion from the initial population differ. A control ratio of 0.73 is not a 27% death rate.
At 50% and 80%, negative cells fall below their initial abundance. Endpoint counts nevertheless cannot separately estimate growth inhibition and death rates. The original study includes imaging and cytokine-blockade experiments, whereas the outcome estimated here is abundance after five days (1).
Predicting excluded mixture fractions with one coefficient
A reference without indirect effects on negative cells leaves the same relative abundance as T-cell-only control:
\[ \widehat R_-^{\mathrm{base}}(f)=1 \]
An alternative empirical model allows the control ratio to fall with positive fraction:
\[ \widehat R_-(f)=\exp(-\beta f),\qquad \beta\geq0 \]
The dimensionless coefficient \(\beta\) describes the day-5 endpoint. It is not a death rate, cytokine action constant or drug-concentration coefficient. Larger values represent a steeper decline of the control ratio with positive fraction in this experiment.
The main fit minimizes squared errors on the original ratio scale. All three mixture conditions give \(\beta\approx2.56\). Fitting those same points is not a prediction check, so I exclude one condition, fit the other two and predict the excluded fraction. This is retrospective analysis after viewing all three public conditions, not a blinded evaluation of a model form chosen in advance. Log-scale fitting, which can emphasize small ratios, is a sensitivity analysis.
Table 3. Predictions for excluded mixture conditions.
| Excluded positive fraction | Digitized control ratio | Original-scale prediction | Log-scale prediction |
|---|---|---|---|
| 20% | Approximately 0.73 | Approximately 0.52 | Approximately 0.56 |
| 50% | Approximately 0.16 | Approximately 0.35 | Approximately 0.28 |
| 80% | Approximately 0.13 | Approximately 0.13 | Approximately 0.07 |
The root mean squared error (RMSE) across the three excluded-condition predictions is approximately 0.16 for the original-scale model versus 0.71 for the no-indirect-effect reference. Improvement over that coarse reference does not remove underprediction of negative-cell abundance at 20% or overprediction at 50%. Agreement at 80% alone does not establish adequate prediction.
Log-scale fitting gives RMSE approximately 0.12 and changes predictions. This is not evidence of superiority: with so few conditions, it shows that the result depends on the fitting criterion. The main analysis was not switched to log-scale fitting after observing the comparison.
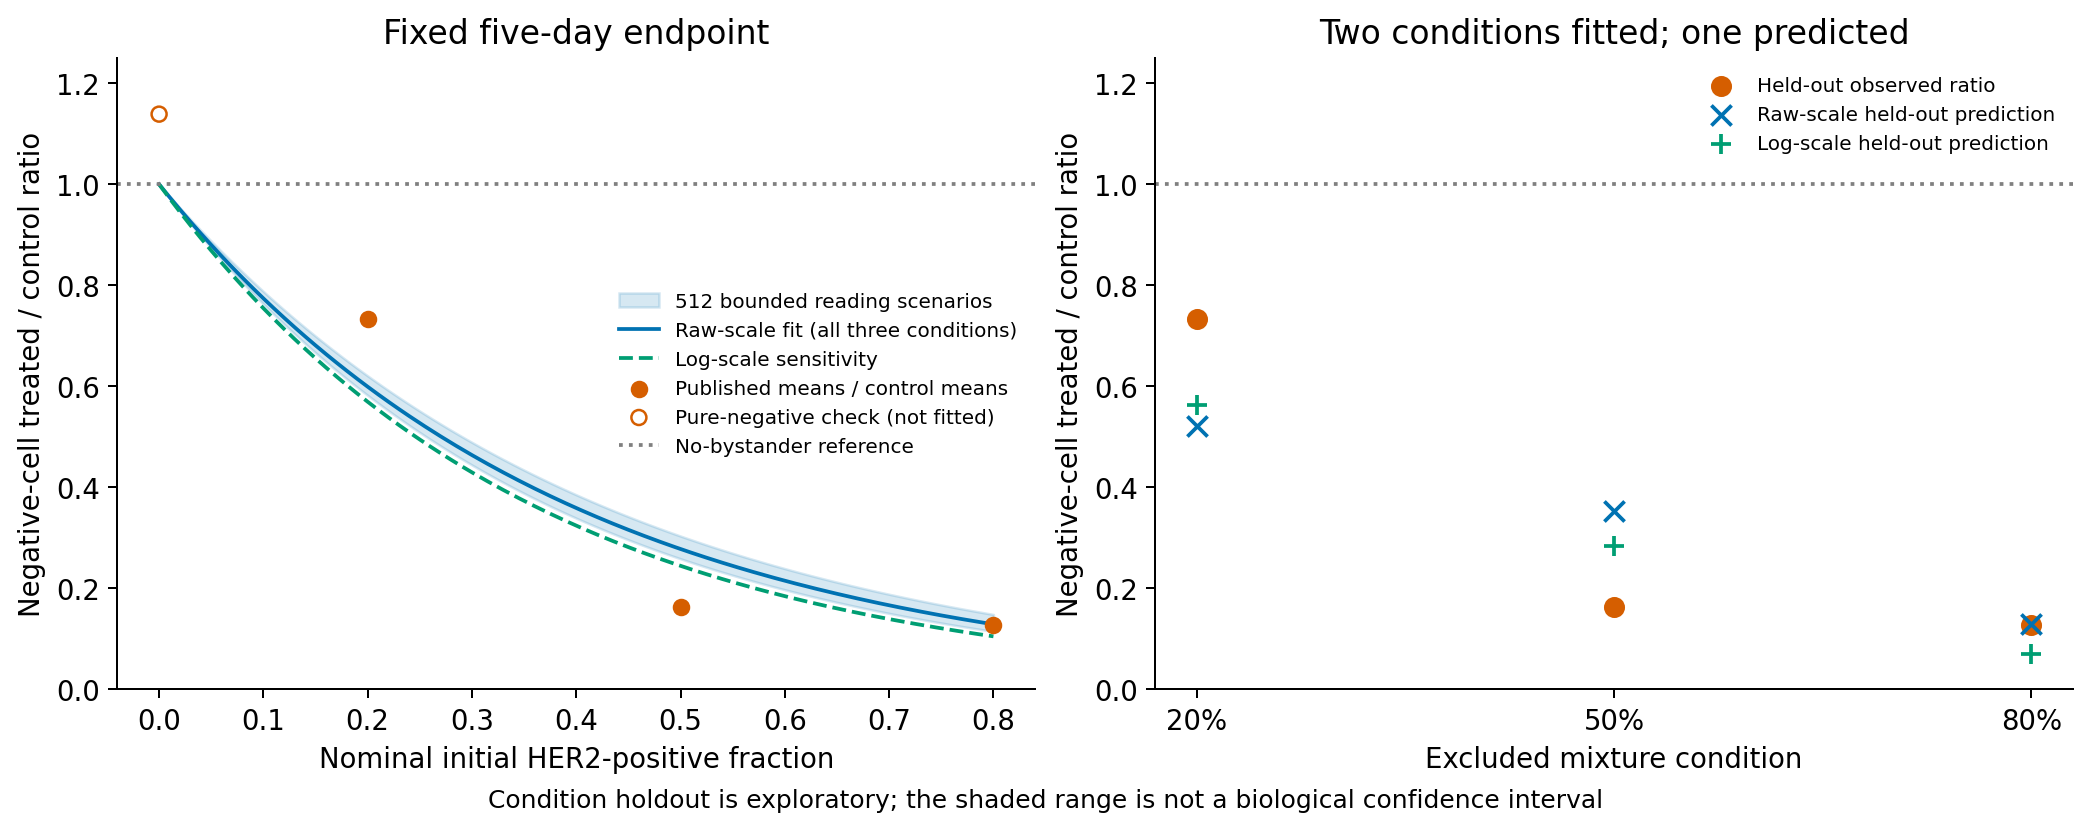
Figure 2. Left: fit using all three mixtures. Right: predictions excluding each condition. The open point at left is the negative-only control ratio and is excluded from fitting. The blue band spans 512 digitization scenarios, not a biological confidence interval. Source data: reference (1); model, calculations and figure are from this analysis.
Even the negative-only antibody/T-cell-only ratio is approximately 1.14 rather than exactly 1. The ratio of 1 at \(f=0\) is therefore not confirmed by these aggregate values.
The held-out unit is a mixture fraction. Two aggregate conditions from the same study predict a third; this is not validation in independent donors or another study. Holding out 50% interpolates between 20% and 80%, whereas holding out either extreme extrapolates beyond the two training fractions. These are different prediction tasks.
Digitization uncertainty does not explain all discrepancies
I varied mean bar positions within ±2 source-image pixels and recalculated 512 scenarios with a fixed seed (2026102608). No bootstrap invented unrecovered biological replicates. Independently varying numerator and denominator readings is a practical sensitivity analysis, not a guaranteed envelope for systematic calibration errors.
Across these scenarios, \(\beta\) is approximately 2.38–2.70. The 50% condition in Figure 2 remains apart from the curve band. A few pixels of reading error do not eliminate the discrepancy.
The horizontal axis is the nominal mixing fraction, not a precise measured fraction in every culture. Original Figure 1C measures initial fractions but cannot supply matched values for the cultures in Figure 2. Shifting nominal fractions uniformly by ±0.05 gives coefficients approximately 2.24–3.01 and condition-holdout RMSE approximately 0.13–0.19. These are assumption-based ranges, not measurement-derived confidence intervals.
An additional calculation divides by negative-only abundance within the original Figure 2, rather than using the supplementary controls. That different endpoint cannot adjust mixture-specific growth differences. Its RMSE is not directly ranked against the main endpoint. Results remain in the distributed CSV files.
Separating clusters changes negative-cell abundance
The original study also places positive and negative clusters at center-to-center distances of 200, 250 and 300 µm. Although positive clusters are present throughout, negative-cell abundance changes with distance (1).
Digitized negative-cell day-5/day-0 ratios are approximately 0.04, 0.42 and 1.25 at those respective distances. The 200 µm value is a coarse reading near the axis floor, not exactly zero.
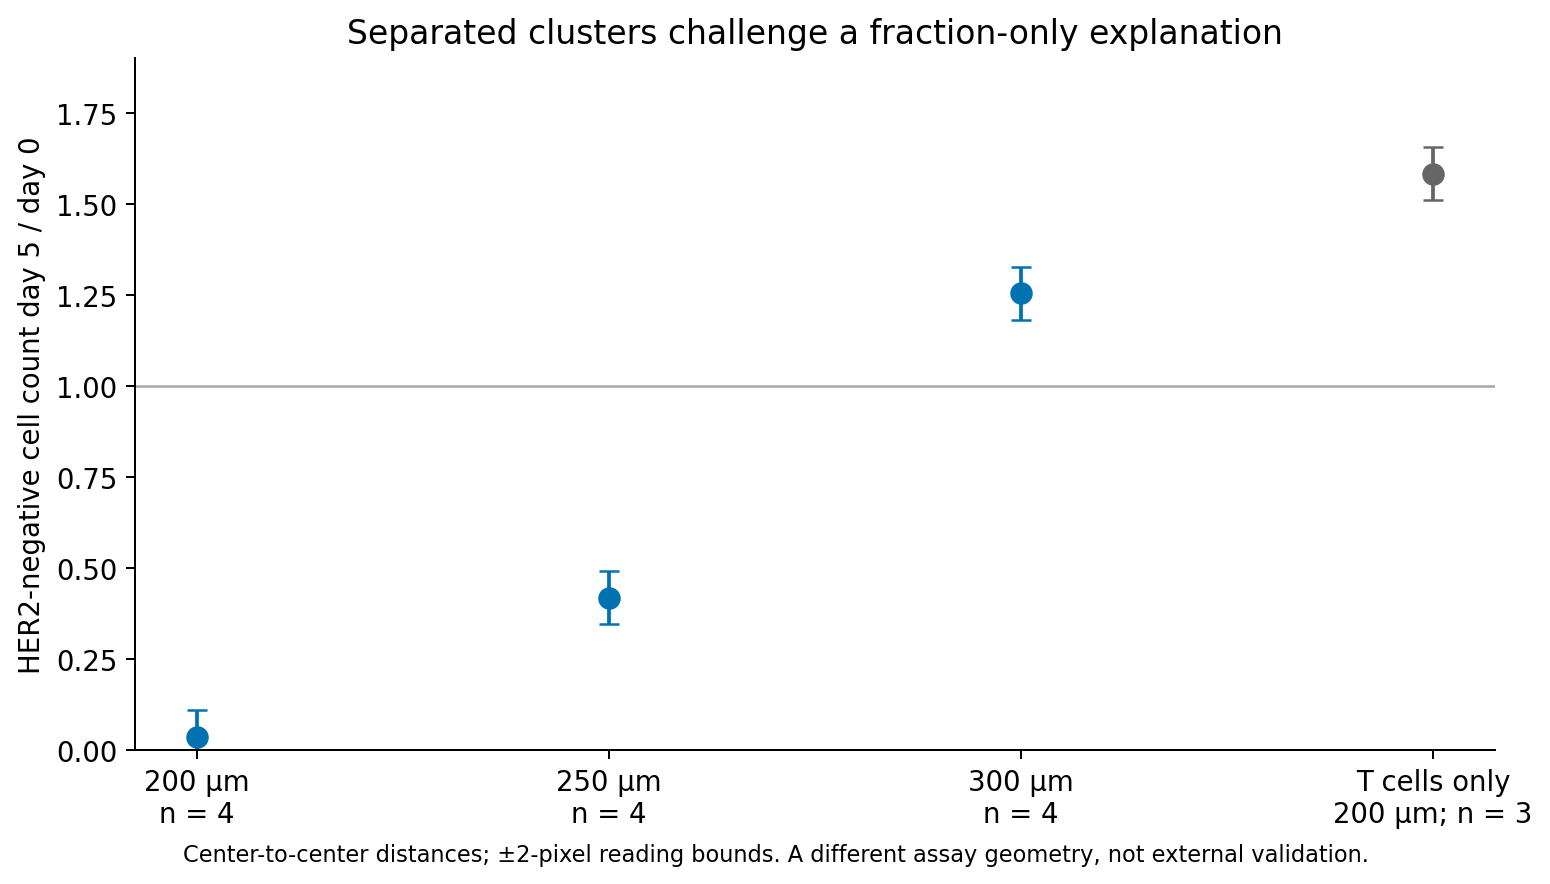
Figure 3. Negative-cell abundance under different spatial arrangements. Vertical ranges show ±2-pixel reading uncertainty. The rightmost control is T cells only at 200 µm; matched controls are not available at every distance. Adapted from Liao et al., Figure 3D (1).
This is not scored as external prediction error for the mixed-culture model. Arrangement and local conditions differ, and exact initial fractions for each culture are unavailable. It nevertheless does not support treating fraction alone as sufficient to predict the same response regardless of arrangement.
Distances are measured between cluster centers, not diffusion paths from cell surfaces. A distance of 250 µm is not a universal action radius in patient tumors.
Model discrepancies and the original mechanistic experiments
The exponential equation assumes the same multiplicative change in the negative-cell control ratio for each equal increase in positive fraction. One coefficient struggles with these aggregates, which decline markedly from 20% to 50% and then change less through 80%. This does not show that every positive-fraction model must fail. A threshold or residual-floor curve might describe the data better, but increasing flexibility with only three conditions leaves even less opportunity to establish prediction. The residuals do not identify a biological threshold.
The source's mechanistic evidence comes from separate experiments. In Figure 6, conditioned medium from positive-cell/T-cell/antibody co-cultures affects negative cells without T cells in that medium. In Figures 7 and 8, IFNγ neutralization partly attenuates bystander injury; TNFα neutralization alone does not clearly do so, whereas combined neutralization strongly suppresses it. In the 3D system, positive-cell killing persists while negative-cell effects diminish (1). These interventions test soluble-factor contributions, not whether the fitted β is a cytokine rate constant.
The initial positive fraction describes the share of tumor cells that carry the antigen needed for T-cell engagement. Negative-cell abundance five days later combines activation timing, arrangement, soluble-factor sensitivity and intervening growth. Reducing these to one fraction threshold loses distinctions. The original observation that cytokine blockade can alter indirect antitumor activity also shows why low cytokines alone do not imply a better treatment outcome. It does not predict efficacy or safety when cytokine inhibitors are used in patients.
Fractions alone cannot separate arrangement and growth
Negative-cell endpoint abundance involves spatial relationships and growth as well as initial mixture fractions. The model misses excluded fractions, and abundance changes in separate spatial experiments. The tested one-coefficient mapping did not adequately predict excluded-condition abundance. This does not disprove all alternative functions of positive fraction, but does not support treating fraction alone as sufficient regardless of spatial arrangement.
Cytokine neutralization and time-course observations in the original study investigate the bystander mechanism (1). This endpoint model does not replace that mechanism. Five-day counts do not distinguish growth suppression from death; adding coefficients to fit endpoints cannot recover that missing information.
Data and code availability
The analysis archive contains digitized means, image coordinates, models, sensitivities, tables and execution scripts, along with official open-access source locations and SHA-256 hashes. Execution instructions are in the included README.
Main results correspond to outputs/tables/mixture-endpoints.csv, model-comparison.csv and spatial-challenge.csv, generated by analysis/run.py. These are analyses of reconstructed figure-level aggregates, not redistributed individual measurements.
References
- Liao CY, Engelberts P, van Dijk M, Timmermans A, Martens JWM, Neubert E, et al. CD3xHER2 bsAb-Mediated Activation of Resting T-cells at HER2 Positive Tumor Clusters Is Sufficient to Trigger Bystander Eradication of Distant HER2 Negative Clusters Through IFNγ and TNFα. Eur J Immunol. 2025;55(4):e202451589. doi:10.1002/eji.202451589. Full text: PMC11967296. CC BY 4.0. Published means in Figures 1–3 were digitized and replotted; Figure 2 also includes estimates and predictions from the present analysis.