How many CTCs are needed to classify DLL3 positivity?
Public tarlatamab CTC data distinguish normalized counts from unknown denominators and quantify conditional precision around a 25% positivity threshold.
On this page
- Question and intended use
- Available and unavailable information
- Calculations without known raw denominators
- High percentages with few cells
- Classification with a fixed cell count
- Nonindependent cells
- Clinical-benefit aggregates answer another question
- Errors that more cells cannot remove
- Implications for reading the source study and designing validation
- Conclusion
- Data and code availability
- References
DLL3 positivity among circulating tumor cells (CTCs) was 75%. Does that mean three of four cells, or 300 of 400? The percentage is identical, but precision relative to a 25% decision boundary differs.
Mishra and colleagues reported an association between clinical benefit and a 25% DLL3-positive CTC cutoff before tarlatamab treatment (1). I reaggregated the public supplementary table for 20 patients to examine how well that boundary can be classified when few cells are measured.
The scope of what I checked is as follows. I read the full text of Mishra et al. (PMC version) and Supplementary Table S3 (2). For the September 2026 preprint discussed below I read only the abstract, not its methods or figures. The binomial intervals and the beta-binomial sensitivity analysis are calculations in this article, not findings of the source paper.
The published CTC counts are normalized to 20 mL and need not equal actual counted cells. Rather than impose a unique raw denominator, I calculate ranges consistent with public information and explicit assumptions. Separate measurement-design calculations do not represent repeated blood draws in these patients.
Question and intended use
The question is how uncertainty around a 25% DLL3-positive CTC boundary changes with counted cell number. Intended use is evaluating fixed measurement counts and indeterminate classifications in biomarker-validation research, not selecting patient treatment or dose.
Positivity refers to cells identified as CTCs by this assay. In the paper, 10–20 mL of whole blood was depleted of leukocytes with the CTC-iChip (3), and CTCs were defined as cells negative for hematopoietic markers (CD45, CD66b, CD16) and positive for an epithelial marker (EpCAM, pan-CK, CK19) or DLL3 (1). Tumor cells with neither detectable marker can be absent from the denominator. The paper reports that most DLL3-positive CTCs lack epithelial markers (58% DLL3 only, 31% epithelial only, 11% both). DLL3 positivity is therefore itself one of the routes into the denominator. The fraction does not directly measure DLL3 positivity throughout the tumor, and the denominator definition can bias it upward.
Per-cell DLL3 positivity is described as a fluorescence intensity above a threshold of 20 (8-bit images, 0–255) with a plausible cytoplasmic distribution, adjudicated by three analysts (1). The paper states that DLL3 on individual CTCs is either strongly positive or negative with few intermediate levels. That is compatible with treating each cell as a binary call, but the boundary between the two calls still depends on an intensity threshold.
Available and unavailable information
Blood was collected from 32 patients, of whom 20 meeting specified conditions entered response evaluation. The 12 excluded patients comprised inadequate follow-up imaging (2), inadequate baseline specimen or CTC assessment (3), active brain metastases (2), extrapulmonary neuroendocrine carcinoma (2), and transformed SCLC (3) (1). The 25% threshold was applied with reference to a previously annotated value rather than optimized anew in these 20 patients (1).
Using a previously reported value does not independently validate this assay's threshold. Low values span 0–20% and positive values 33–100%, leaving no observations immediately around 25%. From the S3 displayed values, any threshold above 20% and below 33% would classify these 20 patients identically. Separation in these patients therefore does not establish that 25% is optimal or that precision near the boundary is high. The 25% here is a previously annotated value, not one chosen on these 20 patients, but dichotomizing a continuous predictor has general costs, namely information loss and overstated effects when the cutpoint is selected from the data (4, 5). The paper itself lists optimizing the cutoff and multi-institutional validation as limitations (1).
I transcribed the 20 rows of Supplementary Table S3 (2) into CSV and rechecked them against the PDF image. Results below are generated by analysis/run.py.
Table 1. Patients and information available in the supplementary table.
| Item | Result or availability |
|---|---|
| Patients | 20 |
| Sum of CTC counts normalized to 20 mL | 2,987 |
| Median CTC count normalized to 20 mL | 40 |
| CTC count normalized to 20 mL below 10 | 5 patients |
| Displayed positivity at least 25% | 11 patients |
| Actual positive and total cell counts per patient | Not reported |
| Processed blood volume per patient | Not reported; Methods specifies 10–20 mL per collection |
In all 20 rows the per-mL column of S3 equals the 20 mL value divided by 20. That the counts are normalized to a 20 mL reference volume rather than raw tallies is also stated in the paper's Methods (1).
The sum 2,987 is not treated as a sum of independent raw counts. Patient fractions are not pooled using cell-count weights. However, the paper's text itself describes 2,987 as the total number of CTCs scored at baseline and pools it by response (PR, 7 patients: 1,868 of 2,103 positive; SD, 6 patients: 182 of 285; PD, 7 patients: 52 of 599). Multiplying each S3 normalized count by its displayed fraction and summing gives 2,102.19, matching the paper's response-group positive total of 2,102. The paper's pooled figures are therefore consistent with being built from normalized counts and displayed fractions; this agreement does not settle what the raw denominators are. By contrast, the DLL3-positive total implied by the paper's marker classes (1,727 DLL3 only plus 328 both) is 2,055, which differs by 47 cells (1.6% of 2,987) from the response-group total. I could not identify the source of that difference from public information. The response-group percentages (89%, 64%, 9%) are cell-weighted pools dominated by a few high-count patients; they do not describe the distribution of patient-level fractions.
S3 gives positivity as integer percentages. Among the 11 positive patients, the median displayed integer percentage is 80%, differing from the main text's 76%. Total normalized count, median count, and positive/low group sizes agree. I retain S3's values for the measurement analysis without guessing the cause or correcting the published median. Clinical-benefit aggregates are separately taken from the main text.
One further correspondence between the main text and S3 could not be confirmed. The text states that patients 1 and 8 had large numbers of CTCs at baseline, 100% and 75% DLL3-positive respectively (1). In S3 the only row at 75% is 008 (4 cells per 20 mL); the rows at 100% are 001 (1,416) and 040 (87). If patient 8 is S3 row 008, a count of 4 does not read as "large". Public information does not settle whether the main-text patient numbers and S3 IDs coincide. Below, patients are named by S3 ID, and the correspondence to main-text patient numbers is used only where it does not contradict the paper's low-fraction or high-fraction description (patients 1, 17 and 18).
Calculations without known raw denominators
For a known total count \(n\) and positive count \(k\), independent cells give
\[ k\sim\operatorname{Binomial}(n,p) \]
Here \(p\) is positivity under the same collection, identification and classification process. Individual 95% intervals for known \((k,n)\) use Clopper–Pearson (6). That method is built to have coverage at least at the nominal level and is conservative (wide) for many \((k,n)\); a narrower interval method would change how the results below read (7). Since raw counts are unavailable, I enumerate integer pairs compatible with normalized count \(c\) and displayed percentage \(r\):
\[ \mathcal S_i=\left\{(k,n):\exists v\in[10,20],\quad \left|\frac{20n}{v}-c_i\right|\le0.5,\quad \left|100\frac{k}{n}-r_i\right|\le0.5\right\}. \]
The 10–20 mL range follows Methods. Tolerances of ±0.5 normalized count and ±0.5 percentage points are assumptions because rounding rules are unpublished. Counts and percentages are also assumed to describe the same measured-cell set. For intervals \([L(k,n),U(k,n)]\), the envelope is
\[ \left[\min_{(k,n)\in\mathcal S_i}L(k,n),\quad \max_{(k,n)\in\mathcal S_i}U(k,n)\right] \]
This is a conditional interval envelope, not a recovered denominator or a patient-specific interval validated for the assay. It applies only under the stated assumptions and does not provide simultaneous 95% coverage across patients.
High percentages with few cells
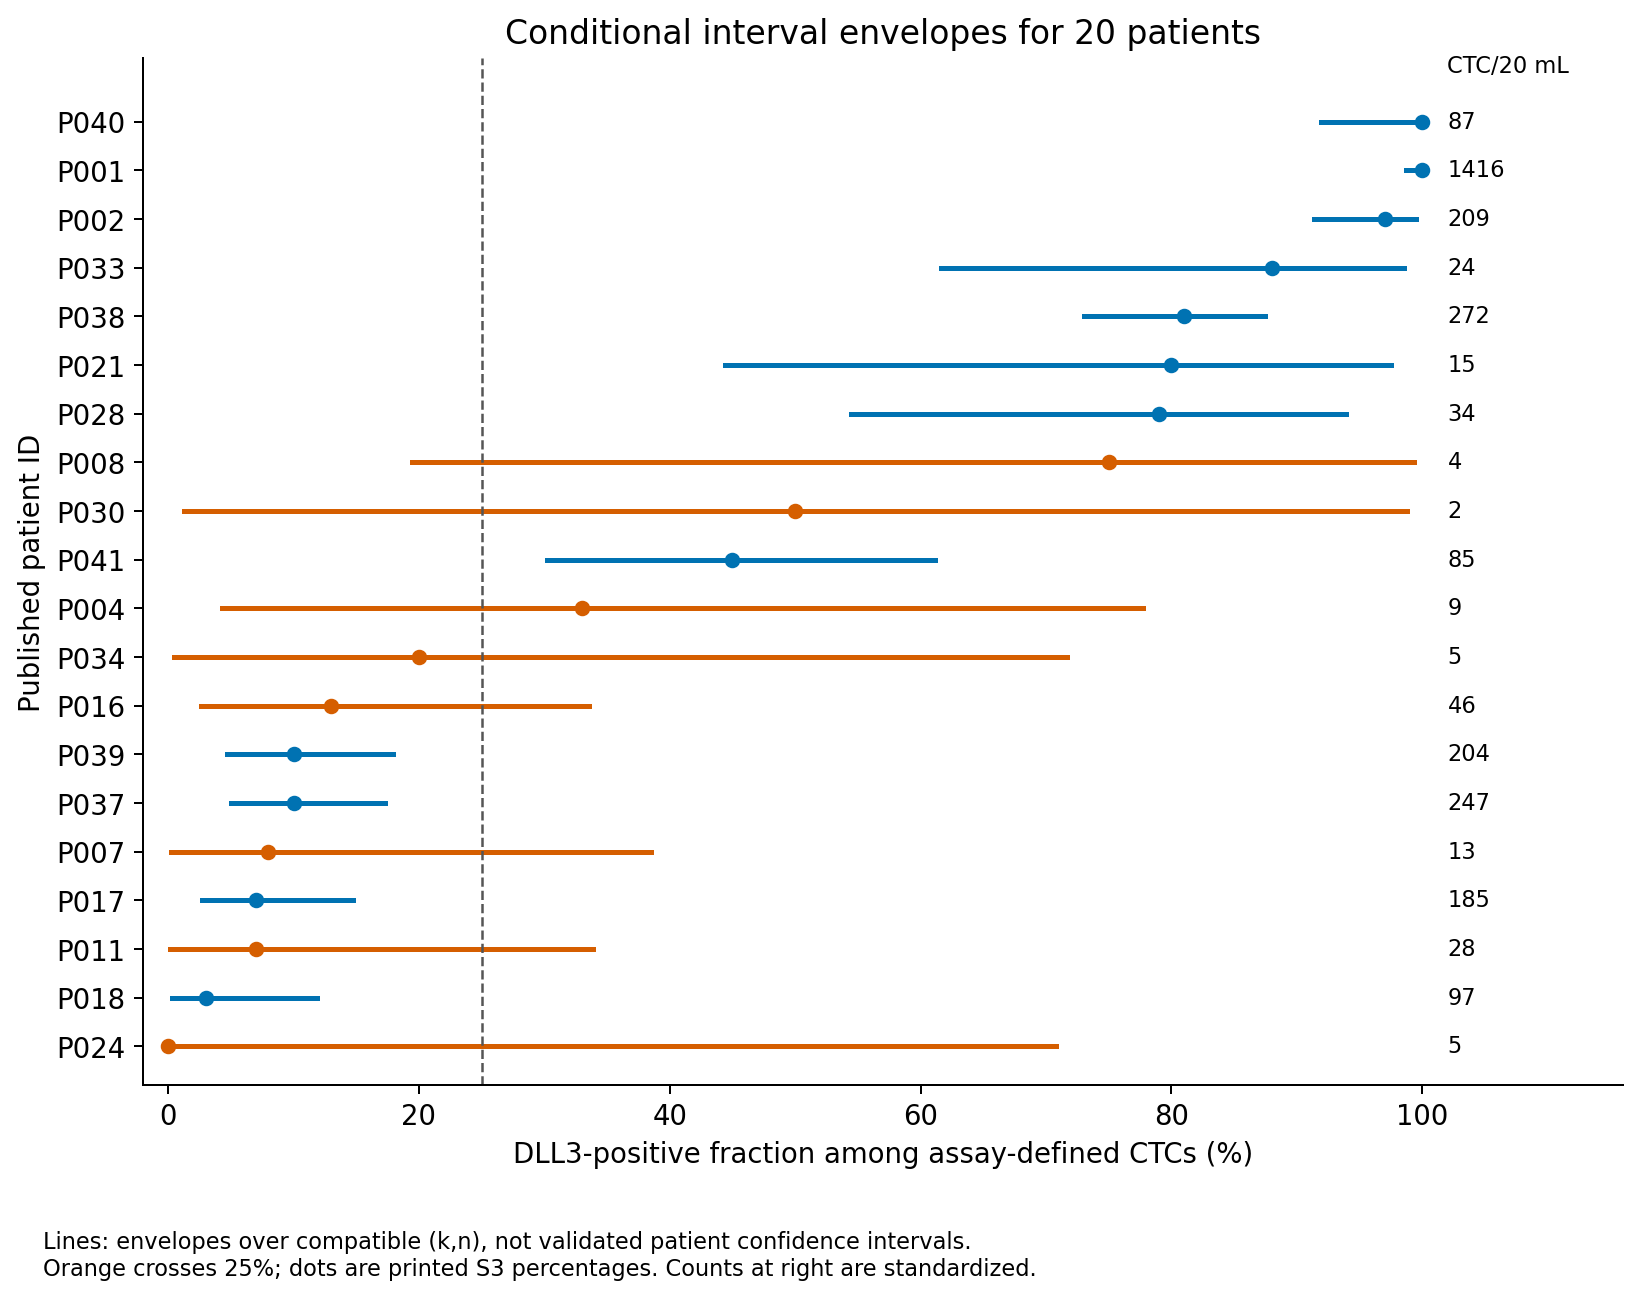
Figure 1. Points are displayed positivity, lines the envelopes across compatible integer counts, and the right-hand labels normalized counts. Orange indicates crossing 25%.
Eight of 20 envelopes cross 25%. This is neither a count of misclassified patients nor a probability that their classifications are wrong.
Of the eight crossing patients (P004, P007, P008, P011, P016, P024, P030, P034), three have displayed positivity of at least 25% (P004, P008, P030) and five are below 25%. Two of the three patients with displayed positivity of 33–50% in S3 (P004, P030, P041) are among them. These three can be read as the paper's three intermediate-fraction patients (all with stable disease), but that correspondence is inferred from how the paper treats 75%. By contrast, the S3 rows P017 (185 cells) and P018 (97 cells), which would correspond to the low-fraction patients 17 and 18 that the paper describes as showing tumor shrinkage, have envelopes of 2.7–14.7% and 0.3–11.9% and do not cross 25%. These envelopes do not support relabeling the low-fraction cases with tumor shrinkage as having latent assay-specific positivity above 25%. Exclusion from an interval does not make a value impossible or rule out all count error; for patient 17 the paper attributes the finding to a DLL3 splicing abnormality close to the diagnostic antibody's recognition site that appeared to preclude scoring in the assay (1).
Table 2. Selected patient-level normalized counts and conditional envelopes.
| Original patient ID | Count normalized to 20 mL | Displayed positivity | Compatible raw total range | Interval envelope |
|---|---|---|---|---|
| P004 | 9 | 33% | 6–9 | 4.3–77.7% |
| P008 | 4 | 75% | 4–4 | 19.4–99.4% |
| P024 | 5 | 0% | 3–5 | 0.0–70.8% |
| P030 | 2 | 50% | 2–2 | 1.3–98.7% |
| P034 | 5 | 20% | 5–5 | 0.5–71.6% |
| P041 | 85 | 45% | 44–85 | 30.2–61.2% |
Only \((k,n)=(1,2)\) fits P030 under these assumptions; that does not mean the paper published a raw count of 1/2. P008's displayed 75% also has an envelope crossing 25%. A large percentage does not establish precision relative to the boundary.
Widening rounding tolerance to ±1 percentage point still gives eight crossing envelopes. Assuming all specimens used 20 mL gives seven. Results therefore depend on how unknown denominators are constrained; see outputs/tables/rounding_volume_sensitivity.csv. The count also depends on the interval type: applying Wilson or Jeffreys intervals to the same candidate integer pairs gives seven crossing patients (P008 drops out). The separate supplementary script linked below reproduces this additional calculation. The number eight is the value obtained with the conservative Clopper–Pearson interval and the union over candidate denominators.
Separately from the denominator problem, cell identification itself can matter in low-count patients. The paper reports that five healthy control donors had marker-positive cells at a median of 0.2 per mL, a mean of 0.18 per mL and a range of 0–3 per 10 mL (1). On a 20 mL basis that is a median of 4, a mean of 3.6 and a maximum of 6, the same order as the normalized counts of P008 (4), P024 (5), P030 (2) and P034 (5). From what I could check, it is unclear whether background marker-positive cells in controls were counted under the same CTC definition or what fraction expressed DLL3. Background cells entering the denominator or numerator of low-count patients is therefore not covered by the binomial intervals.
Classification with a fixed cell count
This separate design calculation specifies true assay-specific fraction \(p\) and fixed count \(n\), then calculates exactly the binomial probability that the observed fraction falls on the opposite side of 25%. No random simulation is required. Positivity is defined by \(k/n\ge0.25\). Although no displayed patient value equals 25%, the boundary rule matters for small integer counts:
\[ P_{\mathrm{mismatch}}(n,p)= \begin{cases} P(K\ge\lceil0.25n\rceil),&p<0.25,\\ P(K<\lceil0.25n\rceil),&p>0.25. \end{cases} \]
No correct side or misclassification probability is assigned at \(p=0.25\).
Table 3. Classification mismatch under fixed counts and specified fractions.
| Actual cells counted | p=20% | p=30% | p=24% | p=26% |
|---|---|---|---|---|
| 20 | 37.0% | 23.8% | 54.4% | 37.5% |
| 100 | 13.1% | 11.4% | 44.5% | 37.2% |
| 200 | 4.9% | 5.1% | 39.7% | 34.8% |
| 500 | 0.4% | 0.6% | 31.6% | 28.9% |
These are mismatches against the side containing the specified true fraction, not treatment-response prediction errors. At 20% and 30%, the probabilities fall below 1% with 500 cells; substantial uncertainty remains at 24% and 26%. Required counts depend on distance from the boundary.
The same calculation gives an approximate range of true fractions for which mismatch is at most 5% (a grid search in 0.05-percentage-point steps; because of the sawtooth pattern the values near the boundary are not exact). With 20 cells counted, the range is about 10% or lower and about 40% or higher; with 50 cells, about 16% or lower and about 36% or higher; with 100 cells, about 18% or lower and about 32% or higher; with 500 cells, about 22% or lower and about 28% or higher. Even with independent cells, specimens near 25% do not reach 5% mismatch after hundreds of cells. The separate supplementary script also reproduces this calculation.
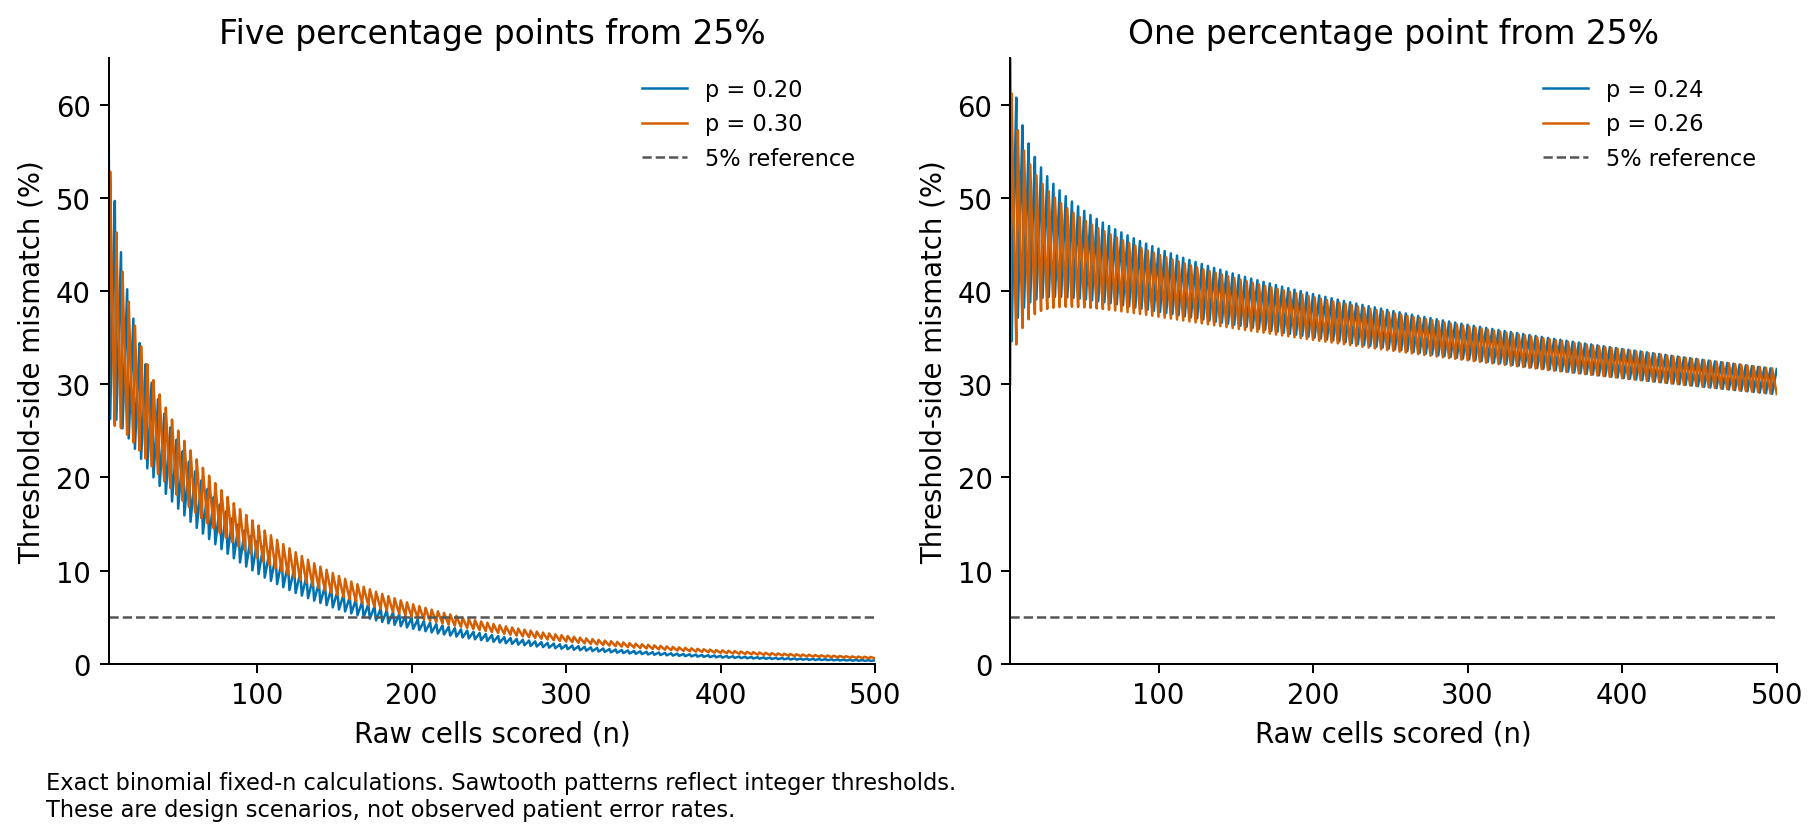
Figure 2. The sawtooth pattern follows the changing minimum positive count \(\lceil0.25n\rceil\), not numerical error. A value below 5% at one count does not imply values below 5% at every larger count.
Irregular oscillation of the same discrete origin is known for the coverage probability of binomial intervals (7).
Nonindependent cells
Common processing or cell clusters can make positivity judgments dependent. A beta-binomial sensitivity analysis (8) fixes mean fraction \(p\) and varies correlation \(\rho\):
\[ K\sim\operatorname{BetaBinomial}(n,a,b),\quad a=p(\rho^{-1}-1),\quad b=(1-p)(\rho^{-1}-1). \]
\[ \operatorname{Var}(K/n)=\frac{p(1-p)}{n}\{1+(n-1)\rho\}. \]
This convenient overdispersion model assumes exchangeable correlation across all cells. Correlation is specified, not estimated from the patient table. The fraction is the mean of repeated measurement processes; mismatch is evaluated against that mean's side, not a known individual patient's truth. The model neither estimates cluster sizes nor corrects systematic classification bias.
Table 4. Effect of assumed cell correlation.
| Assumed correlation ρ | Mismatch at p=30% with 500 cells |
|---|---|
| 0.00 | 0.6% |
| 0.01 | 15.5% |
| 0.05 | 33.7% |
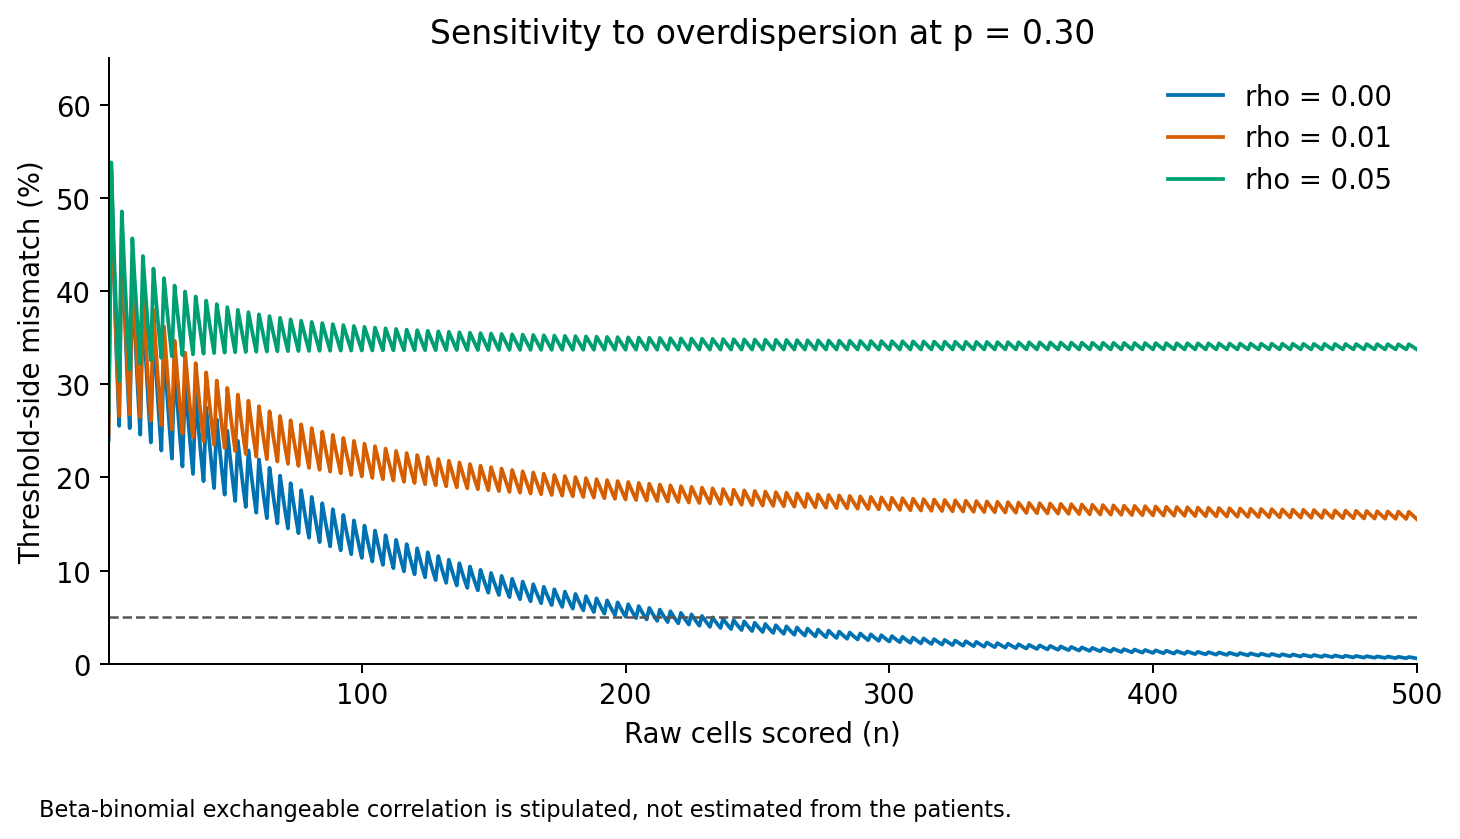
Figure 3. Increasing counts under correlation does not reproduce the independent-binomial improvement. These correlations are scenarios, not measured patient values. Adopting binomial counts without establishing independence can overstate precision.
In Table 4, a correlation as small as \(\rho=0.01\) moves mismatch from 0.6% to 15.5% because the variance is multiplied by \(1+(n-1)\rho\). Looking at variance alone, the effective sample size \(n/\{1+(n-1)\rho\}\) with 500 cells is only about 84 at \(\rho=0.01\) and about 19 at \(\rho=0.05\) (also auxiliary calculations). Effective sample size matches the variance of a proportion, not the entire distribution or probability near a classification boundary. Table 3's values at 100 and 20 cells are not direct calculations at 84 and 19. Table 4 was calculated from the beta-binomial itself rather than converted from effective sample size.
Under correlation, adding cells alone does not give the improvement of the independent calculation. Figure 3 does not claim that the real correlation has these values. The public 20-patient table has no repeated measurements of the same patient, so these data cannot tell whether \(\rho\) is near 0, 0.01 or 0.05. The figure shows that adopting the independent-binomial counts without checking independence invites overconfidence.
Clinical-benefit aggregates answer another question
Clinical benefit is partial response (PR) plus stable disease (SD). The paper reports benefit in all 11 positive patients and two of nine low patients (1). Recalculation gives:
Table 5. Metrics from the reported clinical-benefit aggregate.
| Metric | Numerator/denominator | Estimate | Individual 95% binomial interval |
|---|---|---|---|
| Sensitivity | 11/13 | 84.6% | 54.6–98.1% |
| Specificity | 7/7 | 100.0% | 59.0–100.0% |
| Positive predictive value | 11/11 | 100.0% | 71.5–100.0% |
| Negative predictive value | 7/9 | 77.8% | 40.0–97.2% |
Sensitivity and specificity agree with the paper's reported values within rounding (sensitivity 85%, 95% CI 55–98%; specificity 100%, one-sided 97.5% CI 59–100%) (1). These describe the original 20 patients, not independent validation. The intervals summarize clinical association when patients are classified using the recorded assay result. That estimand does not require a measurement to equal the latent true fraction exactly. Repeatability after another blood draw or cell classification, and performance of classification by a latent true fraction, are different questions; adding cell-level intervals alone does not evaluate them. Three of the 11 positive patients (P004, P008, P030) have envelopes that, under the stated assumptions, cannot exclude a true fraction below 25% (Table 2, Figure 1). Modeling error relative to latent fractions would require at least raw positive/total counts and information about measurement repeatability, unavailable from this table alone. Cell-level intervals would not validate clinical sensitivity or specificity either. A single treated cohort also cannot establish a biomarker predicting greater benefit relative to another treatment; the paper likewise lists testing against alternative regimens as outstanding (1).
A September 2026 preprint relates tissue IHC to tarlatamab outcomes (9). According to its abstract, in 54 patients the percentage of IHC-positive cells above versus at or below 75% was associated with time on treatment (10.1 versus 2.9 months, p = 0.036), and median IHC percentages were 80% in patients with PR and 40% in patients with PD. Its measurement target and threshold differ, so it does not externally validate the 25% CTC rule. On the other hand, Mishra et al. report that archival tissue IHC from 18 patients in their cohort was poorly predictive of benefit (1), so the two reports disagree on how well tissue IHC predicts outcome. Differences in populations and measurement conditions mean this analysis cannot resolve the disagreement.
Errors that more cells cannot remove
The public table does not determine one required count for every specimen. Unknown raw denominators constrain envelope interpretation, while clusters, preprocessing, CTC identification and antibody-classification errors are absent from independent binomial calculations. More cells do not remove bias caused by antibody-epitope differences. In the paper's splicing example, an abnormality in the cytoplasmic region next to the diagnostic antibody's recognition site appeared to preclude scoring in the assay regardless of the extracellular domain that the therapeutic antibody targets; the paper suggests pairing diagnostic and therapeutic antibodies (1). That interpretation rests on one patient.
Fixed-count intervals also do not evaluate sequentially adding cells until significance. The precision calculated here is conditional on the assay and denominator assumptions.
Implications for reading the source study and designing validation
Three points follow for the 20 classified patients. First, the S3 displayed values alone leave the classification unchanged for any threshold strictly between 20% and 33%, so the threshold position itself is neither supported nor refuted by these data. Second, for 12 of 20 patients the envelope does not cross 25% under the assumptions, placing opposite-side latent fractions outside the interval. Third, eight envelopes span both sides, including three patients contributing to the positive predictive value of 11/11. This concerns uncertainty about latent fractions; classification by the displayed S3 result has not changed. The paper's high sensitivity and specificity are compatible with the uncertain classification of few-cell patients near the boundary. The latter does not negate the former, and the paper's intervals do not include it.
Conditional on matching main-text patients 17 and 18 to S3 P017 and P018, their envelopes remain below 25%. Patient 18, however, had PD because of new lesions despite target-lesion shrinkage, and is not an example of clinical benefit defined as PR plus SD (1). These two cases cannot establish that count error does not affect group separation overall. Antibody recognition, denominator definition and background-cell biases also remain outside the binomial intervals.
For the design of a validation study, the relevant quantity is the number of cells identified as CTCs and scored, not the blood volume. The median normalized count in S3 is 40, and only 5 of 20 patients have at least 200 cells per 20 mL. With independent cells, 200 counts give 4.9% mismatch at p=20% and 5.1% at p=30%, near but not uniformly below 5% (Table 3). At 50 counts, fractions meeting the 5% criterion are also asymmetric around the boundary. At the median of 2 cells/mL, 200 cells correspond arithmetically to 100 mL. This assumes constant concentration and recovery; it does not establish feasible processing of that volume or validate the expected yield. Correlation between cells, meanwhile, does not disappear with more counted cells, and its size cannot be identified without independent repeated measurements from the same patient, which the public table cannot provide.
For reading other reports, a claim that compares a fraction with a threshold needs the counted cells (\(k\) and \(n\)) as well as the fraction. A table that shows only normalized values and fractions, like S3, does not allow an interval against the threshold to be built.
Conclusion
The answer to the opening question is that a high positive percentage does not guarantee precision relative to a 25% boundary. In the 20-patient public table of Mishra et al., enumerating integer pairs under unknown raw denominators gave eight patients whose intervals cross 25%, and seven under another interval method. Under independent cells, specimens about 5 percentage points from 25% need about 200 cells for 5% mismatch, while specimens 1 percentage point from the boundary still show about 30% mismatch with 500 cells. A correlation of only 0.01 reduces the effect of 500 cells to an effective sample of about 84. The paper's high sensitivity and specificity are results at a different level from the classification uncertainty of few-cell patients, and the denominators and repeatability information needed to evaluate error relative to latent true fractions are not public. This conclusion rests on conditional binomial calculations and a sensitivity analysis with specified correlation.
Data and code availability
The analysis archive includes input CSV, analysis and test code, and results. Original PDFs are not redistributed; acquisition locations and SHA-256 are recorded. Distribution functions evaluate binomial and beta-binomial probabilities without random seeds.
python -m pip install -r requirements.txt
python analysis/run.py
python -m unittest discover -s tests -v
Figure 1 and patient values trace to patient_interval_envelopes.csv, Figures 2–3 to fixed_n_design.csv, and clinical aggregates to published_aggregate_metrics.csv. Numerical tables are in outputs/tables/; environment and principal summaries are in outputs/results.json.
The numbers described as auxiliary calculations in the text (seven crossing patients with Wilson and Jeffreys intervals, the reconciliation with 2,102.19, the ranges of true fractions with at most 5% mismatch, effective sample sizes, and the 20 mL conversion of the control-donor background) were computed with a supplementary script reading the archive's input CSV and functions. The original ZIP is unchanged; place the script alongside it and follow the additional calculation instructions.
References
- Mishra A, Meador CB, Kikkeri K, Cunneely Q, Lin M, Carmona-LaSalle TJ, et al. Circulating Tumor Cells Predict Response to the DLL3-Targeting Bispecific Antibody Tarlatamab. Cancer Discov. 2026;16(5):911–930. doi:10.1158/2159-8290.CD-25-1483. Open full text.
- Mishra A, Meador CB, Kikkeri K, Cunneely Q, Lin M, Carmona-LaSalle TJ, et al. Supplementary Table S3 from Circulating Tumor Cells Predict Response to the DLL3-Targeting Bispecific Antibody Tarlatamab [dataset]. AACR Figshare. 2026. CC BY. doi:10.1158/2159-8290.32728723. Accessed 2026 Oct 25.
- Karabacak NM, Spuhler PS, Fachin F, Lim EJ, Pai V, Ozkumur E, et al. Microfluidic, marker-free isolation of circulating tumor cells from blood samples. Nat Protoc. 2014;9(3):694–710. doi:10.1038/nprot.2014.044.
- Altman DG, Lausen B, Sauerbrei W, Schumacher M. Dangers of using "optimal" cutpoints in the evaluation of prognostic factors. J Natl Cancer Inst. 1994;86(11):829–835. doi:10.1093/jnci/86.11.829.
- Royston P, Altman DG, Sauerbrei W. Dichotomizing continuous predictors in multiple regression: a bad idea. Stat Med. 2006;25(1):127–141. doi:10.1002/sim.2331.
- Clopper CJ, Pearson ES. The use of confidence or fiducial limits illustrated in the case of the binomial. Biometrika. 1934;26(4):404–413. doi:10.1093/biomet/26.4.404.
- Brown LD, Cai TT, DasGupta A. Interval estimation for a binomial proportion. Stat Sci. 2001;16(2):101–133. doi:10.1214/ss/1009213286.
- Williams DA. The analysis of binary responses from toxicological experiments involving reproduction and teratogenicity. Biometrics. 1975;31(4):949–952. doi:10.2307/2529820.
- Zhang B, Hong L, Wang K, Stewart CA, Shah K, Wang WL, et al. DLL3 expression predicts response and long-term outcome in small cell lung cancer patients treated with tarlatamab. bioRxiv [preprint]. 2026 Sep 7. doi:10.64898/2026.09.03.749238.