Can blood proteins read immune aging? From cell states to proxy measurements
Cell recovery and protein-proxy errors answer different questions. Two numerical examples examine an immune-aging study without claiming clinical validation.
On this page
- Introduction
- Predicting age and predicting health trajectories are different questions
- The large outcome analysis did not directly measure the cells
- A ratio fluctuates when its denominator is sparse
- Equal correlations do not justify an unchanged threshold
- Discussion
- Data and code availability
- References
Introduction
People of the same age do not necessarily have the same immune state. Could a blood test measure that difference and tell us something about their future health?
The study by Terekhova and colleagues, published in Immunity on October 9, 2026, integrated peripheral blood mononuclear cell (PBMC) data from 2,609 people. It examined the ratio of two CD8-positive effector-memory T-cell populations and connected a plasma-protein proxy for that state to health outcomes. Eric Topol also discussed the study (1). Here I examine what can be established from the public abstract (2).
Beyond the size of the cell atlas, the interesting step is the attempt to make a state discovered in that atlas readable through another measurement. Measuring the cell state, estimating it from proteins, and linking the estimate to future disease each require separate validation.
I trace those connections and construct two independent numerical examples. A cell ratio can fluctuate with the number of recovered cells even when the underlying biological state is unchanged. A protein proxy can retain the same correlation with the cell state while a measurement shift changes classifications at a fixed threshold.
Predicting age and predicting health trajectories are different questions
The study combined seven existing single-cell datasets and a new cohort, identifying 59 immune-cell populations. Among CD8-positive T cells, the ratio of GZMK-expressing to GZMB-expressing effector-memory populations reportedly distinguished healthy and disease-associated trajectories. Chronic viral exposures, including CMV, also contributed to this ratio, with the principal determinants differing between populations (2).
A marker that closely tracks chronological age serves a different purpose from a marker that distinguishes the future health of people of the same age. Age-prediction error alone does not establish disease-risk discrimination. Conversely, an association between a cell state and disease does not establish that intervening on those cells will improve health.
Calling GZMK cells universally “good” and GZMB cells universally “bad” would also go too far. The results concern particular circulating cell populations and health outcomes. One protein name cannot determine the value of every immune response in every tissue.
The large outcome analysis did not directly measure the cells
According to the institutional announcement, the relevant T-cell counts were unavailable in UK Biobank. The researchers therefore developed a prediction model using other data containing both cell information and plasma proteins, applied it to baseline protein measurements from approximately 50,000 participants, and examined associations of the inferred marker with subsequent disease and mortality (3).
The public abstract reports a “Tem GZMB+ plasma signature” derived from proteomic analyses in four cohorts. The cell ratio and the protein signature should not be treated as the same measurement (2).
This is not a study that directly counted the relevant T cells in approximately 50,000 people and followed their ratios. The roughly 500,000 participants in UK Biobank overall are also distinct from the subset with protein measurements used here.
The analysis has three stages.
Table 1. Separate validation questions in the measurement-to-outcome chain.
| Stage | Relationship examined | Required checks |
|---|---|---|
| Measure the cell state | Estimate population fractions and ratios from recovered cells | Population definitions, cell recovery, zero counts, measurement reproducibility |
| Replace cells with proteins | Infer a cell-state marker from plasma proteins | Agreement with direct measurement, systematic bias, transportability between cohorts |
| Connect the marker to health outcomes | Relate the inferred marker to subsequent disease and mortality | Confounding, absolute-risk calibration, incremental value beyond existing information, usefulness in its intended setting |
More cells may improve precision at the first stage. That alone does not make a protein proxy mean the same thing in another population. An outcome association also leaves separate questions about accurate individual risk estimation and the benefit of using the marker to guide an intervention.
The calculations below do not claim to identify failures in this particular study. They isolate properties that matter when one measurement replaces another.
A ratio fluctuates when its denominator is sparse
Suppose population K constitutes 2% and population B constitutes 1% of recoverable cells. The populations do not overlap; all remaining cells belong to other groups. The population K/B ratio is 2. These are illustrative fractions, not estimates from the paper, and this is not a reconstruction of its ratio-calculation procedure.
Assume independent recovery with the same probability for each cell and perfect classification. I drew 100,000 multinomial samples per condition, recovering 200, 1,000, or 5,000 cells per sample.
Table 2. Sampling variation under fixed population fractions.
| Recovered cells | Expected K/B counts | Probability of zero B cells, exact | Central 95% range of observed ratios conditional on at least one cell in each population |
|---|---|---|---|
| 200 | 4/2 | 13.40% | 0.33–7.00 |
| 1,000 | 20/10 | 0.0043% | 0.94–5.00 |
| 5,000 | 100/50 | Approximately zero | 1.44–2.86 |
The last column describes the simulated distribution of observed ratios, not a confidence interval for the population ratio. It conditions on nonzero K and B counts. Exclusion counts are retained in the output tables. With 200 cells, a log ratio could not be calculated in 15,036 of the 100,000 samples because at least one population had zero recovered cells.
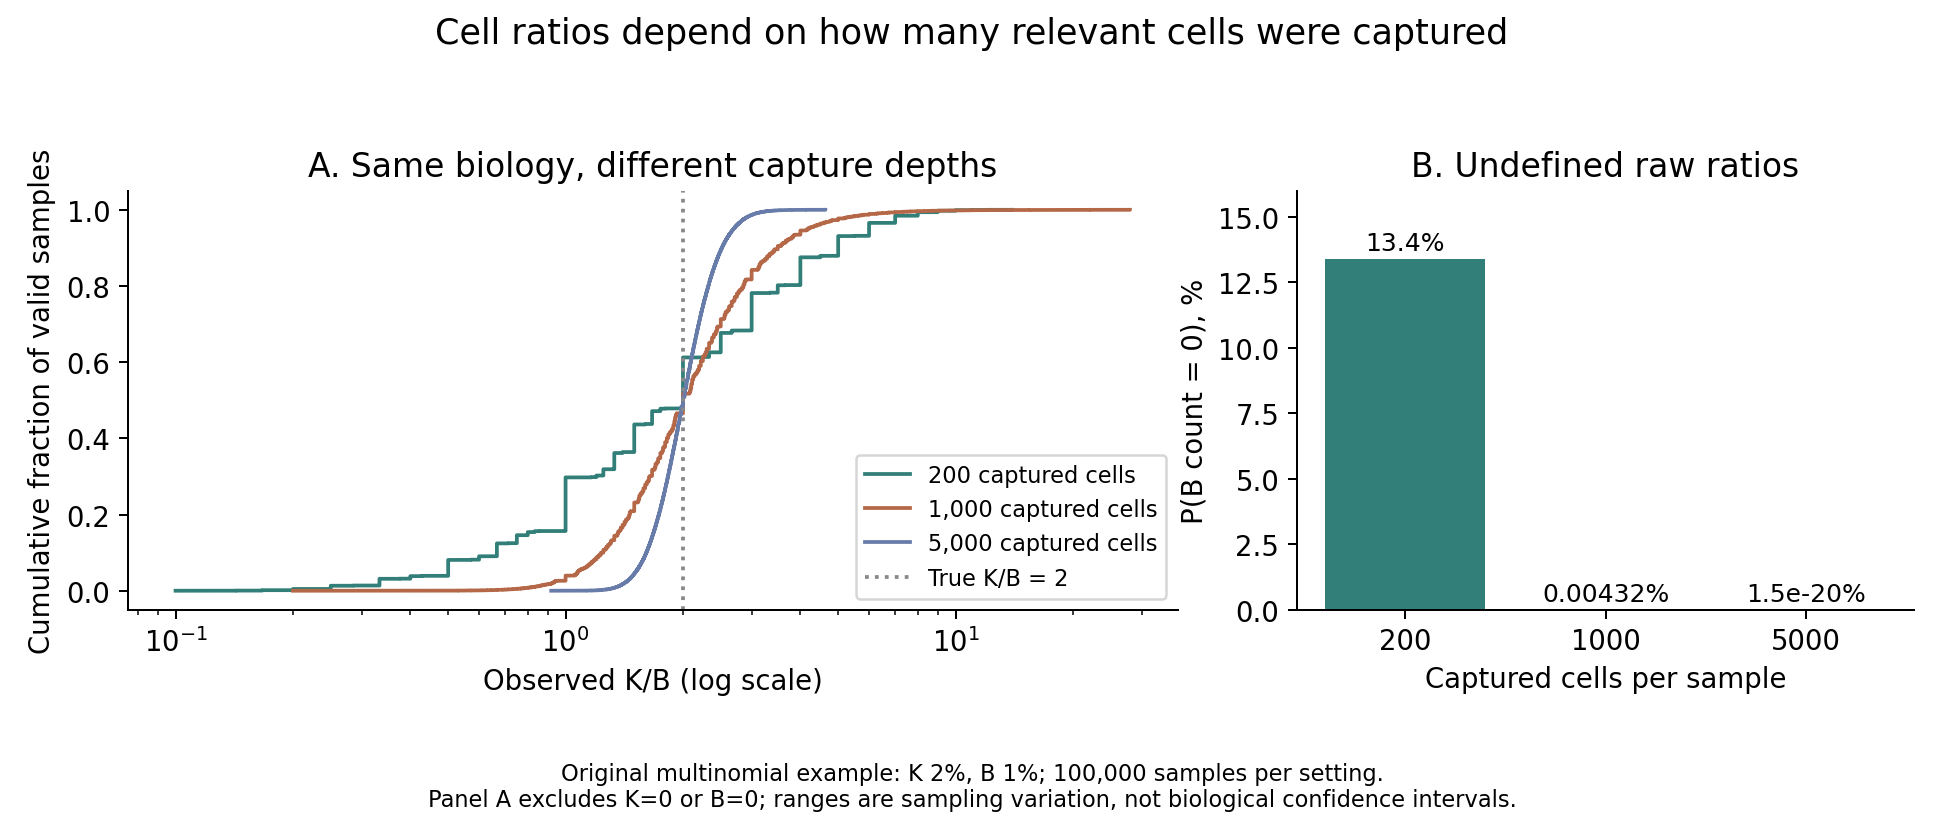
Figure 1. Observed ratios and denominator-zero probabilities at different recovery counts under identical population fractions.
The spread of observations changes with cell recovery even when the population ratio stays fixed. Recovering no B cells does not establish that population B is absent.
In this setting, the probability of a zero denominator is
\[ P(N_B=0)=(1-p_B)^N \]
Measurement variability depends on both the total cell count and the expected denominator count, \(Np_B\).
When both counts are sufficiently large, the delta method approximates the variability of the log ratio:
\[ \operatorname{SD}\left[\log(N_K/N_B)\right] \approx\sqrt{\frac{1}{Np_K}+\frac{1}{Np_B}} \]
This continuous approximation is insufficient when zero counts are frequent, as in the 200-cell condition. Adding a pseudocount also changes low-count ratios according to the chosen value. Zero-count handling should therefore be reported alongside the original counts.
The example omits variation between donors, selective recovery, and classification error. It does not show that increasing cell counts alone resolves every measurement problem.
Equal correlations do not justify an unchanged threshold
Let \(Z\) denote a hypothetical standardized cell-state score and \(W\) a protein-derived proxy. Assume that \(Z\) and noise \(\varepsilon\) are independent standard normal variables, with
\[ W=Z+0.5\varepsilon \]
This is neither an actual cell fraction nor the paper's prediction equation. No disease events are simulated.
I then create a uniform upward shift of 0.75 and a rescaling by 1.5. The same hypothetical individuals retain the same \(Z\) and noise values; only the measurement scale changes.
Table 3. Agreement and threshold exceedance under changes in measurement scale.
| Proxy score | Population correlation | Mean error relative to the cell-state score | RMSE | Proportion exceeding a fixed score of 1 |
|---|---|---|---|---|
| \(W\) | 0.894 | 0 | 0.500 | 18.6% |
| \(W+0.75\) | 0.894 | 0.75 | 0.901 | 41.2% |
| \(1.5W\) | 0.894 | 0 | 0.901 | 27.5% |
These are exact values under the assumed distributions. A separate sample of 20,000 hypothetical individuals confirmed the same pattern. The threshold of 1 is arbitrary and illustrative, not a clinical cutoff.
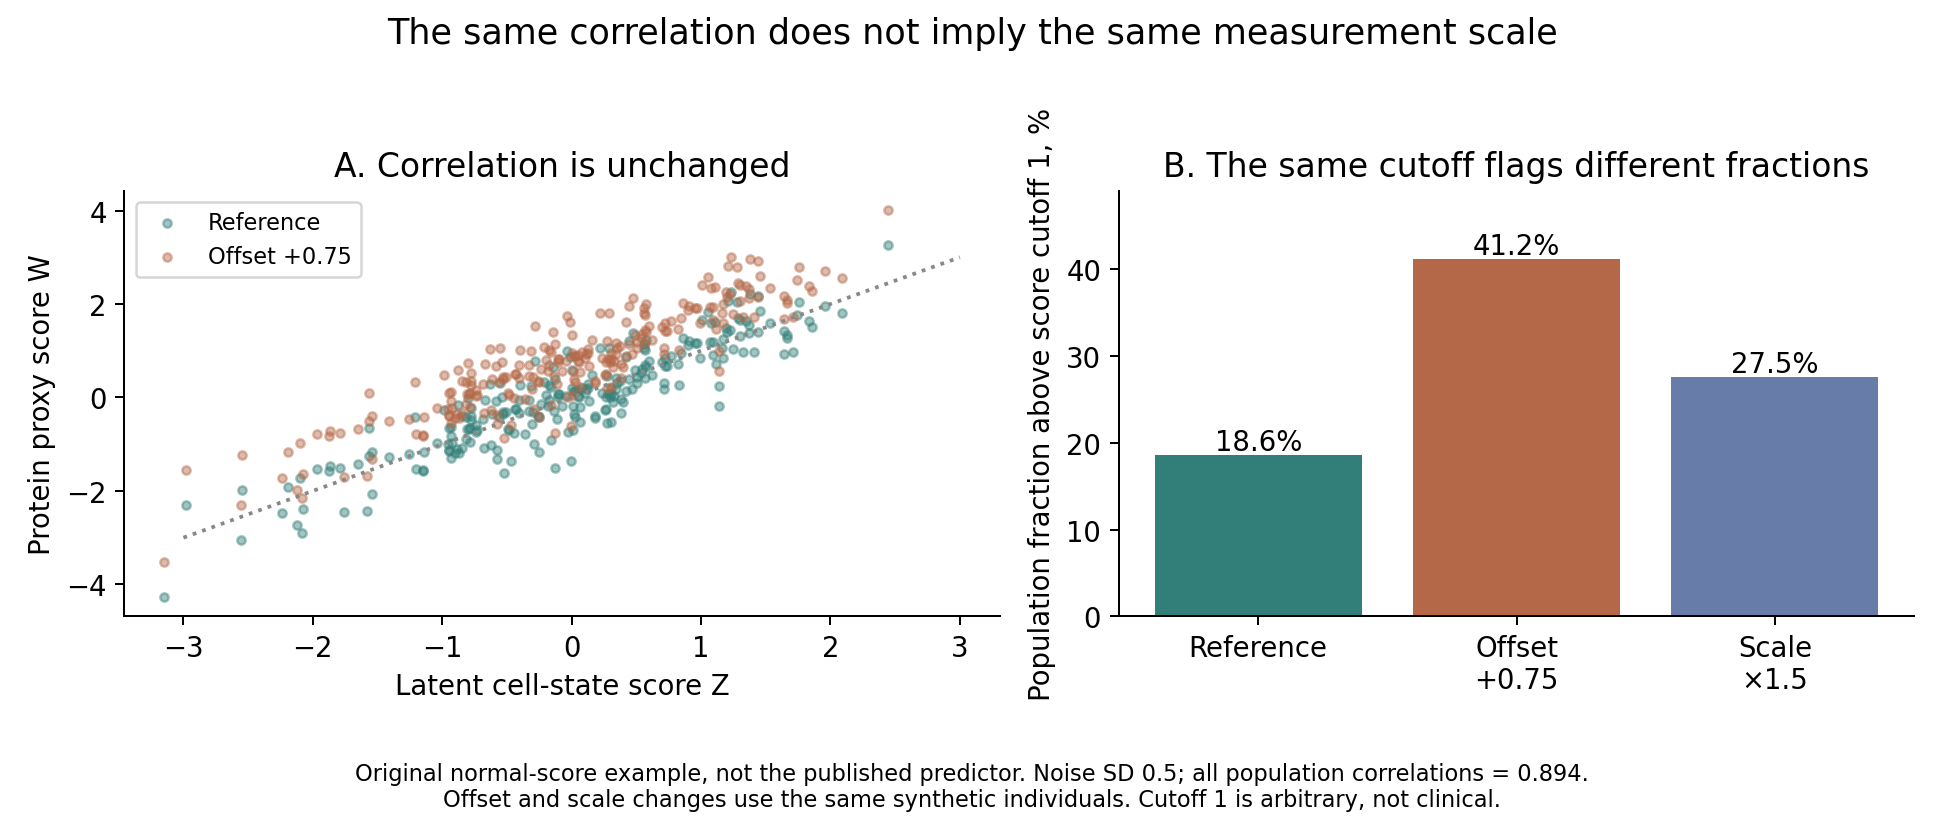
Figure 2. Adding a constant or multiplying by a positive constant preserves correlation but changes the proportion exceeding a fixed threshold.
Correlation is unchanged by an additive constant or a positive multiplier. Agreement with the original cell-state scale and the proportion exceeding a fixed threshold nevertheless change. High correlation alone does not establish that the proxy can replace direct measurement while retaining the same numerical decision rule.
Here the shift and scale can be reversed if they are known. Real measurements require paired observations to estimate them. If the cell state itself has changed in a new population, simply aligning the mean protein score cannot isolate measurement bias. It may remove real biological differences as well.
This example examines agreement between a proxy score and the cell-state scale. It does not validate disease-probability calibration or mortality-prediction accuracy.
Discussion
A protein signature's association with future outcomes differs from accurate surrogate measurement of a cell state. Risk prediction beyond age and existing clinical information, agreement with direct measurements, and interpretation of changes after treatment require separate evidence.
A change in the protein score could reflect cell composition, secretion per cell, or contributions from other tissues. A baseline association cannot distinguish these sources.
The associations described in the public abstract do not show that intervening on the GZMK/GZMB ratio improves health. The numerical examples here likewise distinguish cell-recovery variation from proxy-estimation error; they do not validate the marker as a surrogate endpoint for clinical benefit.
Data and code availability
Sources were checked on October 14, 2026. I consulted the public abstract and the institution's primary announcement. The publisher's full text and supplementary materials were unavailable for this examination. I have not independently verified the original model coefficients, detailed validation splits, measurement errors, or exact clinical effect sizes. This article is neither a reanalysis of the paper nor an evaluation of a diagnostic test's clinical performance.
Both figures and numerical examples are my own. No actual participant records or individual-level UK Biobank data were used. The code, settings, output tables, and original figures include rerun instructions. The cell-recovery and protein-proxy examples are separate models, not a single reconstruction of the paper's measurement system.
References
- Topol E. Post discussing immune aging and T-cell states. X; 2026. Post.
- Terekhova M, Kleverov M, Francis T, Usoltsev D, Bohacova P, Arthur L, et al. Single-cell analyses of global cohorts outline determinants of immune aging and link the ratio of GZMK+ to GZMB+ Tem cells to health trajectories. Immunity. 2026. doi:10.1016/j.immuni.2026.09.012. Published online 2026 Oct 9. Public abstract used.
- Washington University School of Medicine. Immune cell map uncovers how individual aging trajectories diverge. 2026. Institutional announcement.