Comparing B7-H3 and SEZ6 as additional targets alongside DLL3
Reanalysis of public SCLC coexpression tables compares additional RNA coverage from B7-H3 and SEZ6 across samples and cohorts, with bootstrap uncertainty and no protein or efficacy inference.
On this page
- Question and intended use
- Public table and analysis population
- Calculating additional coverage
- Additional-target rankings vary by sample
- Three targets do not cover every cell
- Sensitivity to excluded rows and sample composition
- RNA coverage is not surface-antigen coverage
- Data and code availability
- References
Which target covers more DLL3-undetected cells, B7-H3 or SEZ6? I compared sample-specific additional coverage using a public single-cell coexpression table for small cell lung cancer (SCLC).
SEZ6 had the larger cohort mean in both cohorts. However, bootstrap intervals for the difference crossed zero, and nearly half the samples favored B7-H3. Cohort-average rankings did not adequately describe what remained in each sample.
Coverage here is the fraction of malignant cells with detectable RNA for at least one target. It does not measure cell-surface protein, drug binding or killing.
Question and intended use
The question is which of B7-H3 and SEZ6 adds more coverage to DLL3 in each sample. The intended use is descriptive: choosing targets for subsequent protein measurements or efficacy experiments, not treatment choice, sequencing or dose selection.
Mishra and colleagues already showed incomplete cellular overlap among DLL3, SEZ6 and B7-H3 (1). This article does not claim target discovery. It calculates additional coverage, sample-specific ranking changes and residual non-detection under a common denominator.
Public table and analysis population
The input is original Supplementary Data S2 (2). Data 2A/2B contain sample-level target fractions, copositivity within DLL3-positive cells, and positivity for any of the three targets. Original malignant-cell annotations and RNA-detection rules are retained; raw expression matrices were not reprocessed.
Table 1. Cohort composition and treatment of exclusions.
| Population | Main-analysis units | Composition and handling |
|---|---|---|
| Cohort B | 10 samples | From 10 patients; all SCLC-A; 6 untreated and 4 previously treated |
| Cohort C | 18 donor-label rows | From Chan et al. (3); SCLC-A 12, SCLC-N 5, SCLC-P 1; 7 untreated and 11 previously treated |
| C pleural-effusion row | 1 row excluded | Public code states uncertain correspondence to existing patients; inclusion is a sensitivity analysis |
S2 contains 29 rows, of which 28 enter the main analysis. The remaining 18 C rows have distinct RU donor labels. PleuralEffusion is excluded to avoid treating a possibly repeated patient as independent. The original 19 C rows differ from the 18-row main analysis.
C derives from the independently collected Chan SCLC atlas (3), but the fractions used here are already processed by Mishra and colleagues. This is neither independent reproduction of raw-data processing nor external validation of treatment response.
The released code calls DLL3, SEZ6 and CD276 (B7-H3) positive when the normalized RNA-assay value exceeds zero (4). That is not a therapeutic protein threshold. Detection sensitivity was not recalibrated across samples, so differing measurement depth can affect non-detection even under the same calling rule.
Calculating additional coverage
Let \(D,S,B\) denote detectable DLL3, SEZ6 and B7-H3 RNA. Adding B7-H3 newly covers cells without detected DLL3 but with detected B7-H3:
\[ \Delta_B=P(D^-\cap B^+)=P(B^+)-P(D^+)P(B^+\mid D^+). \]
\[ \Delta_S=P(D^-\cap S^+)=P(S^+)-P(D^+)P(S^+\mid D^+). \]
In S2, Pbind means \(P(B^+\mid D^+)\) and Psind means \(P(S^+\mid D^+)\). Their denominator is DLL3-positive cells, not all malignant cells. Subtracting them directly as whole-population copositivity would be incorrect. I checked definitions against table footnotes and released code (4). Adding \(\Delta_B\) to DLL3 coverage gives the DLL3/B7-H3 union; adding all B7-H3 positivity would double-count overlaps.
The main comparison is paired \(\Delta_B-\Delta_S\): positive favors B7-H3 and negative SEZ6. Samples receive equal weights; high-cell-count samples do not dominate. This estimates mean RNA coverage for an equally weighted draw from the sampled specimens, not for a random tumor cell across a patient population or a tumor-burden-weighted population. Cohorts are not pooled.
Uncertainty uses 10,000 bootstrap resamples of sample/donor rows rather than treating cells as independent patients. Intervals are exploratory 95% percentile intervals for individual comparisons, without multiplicity correction or calibration as clinical selection rules. They hold annotations, RNA detection and within-sample measurement error fixed and describe variation between rows.
Additional-target rankings vary by sample
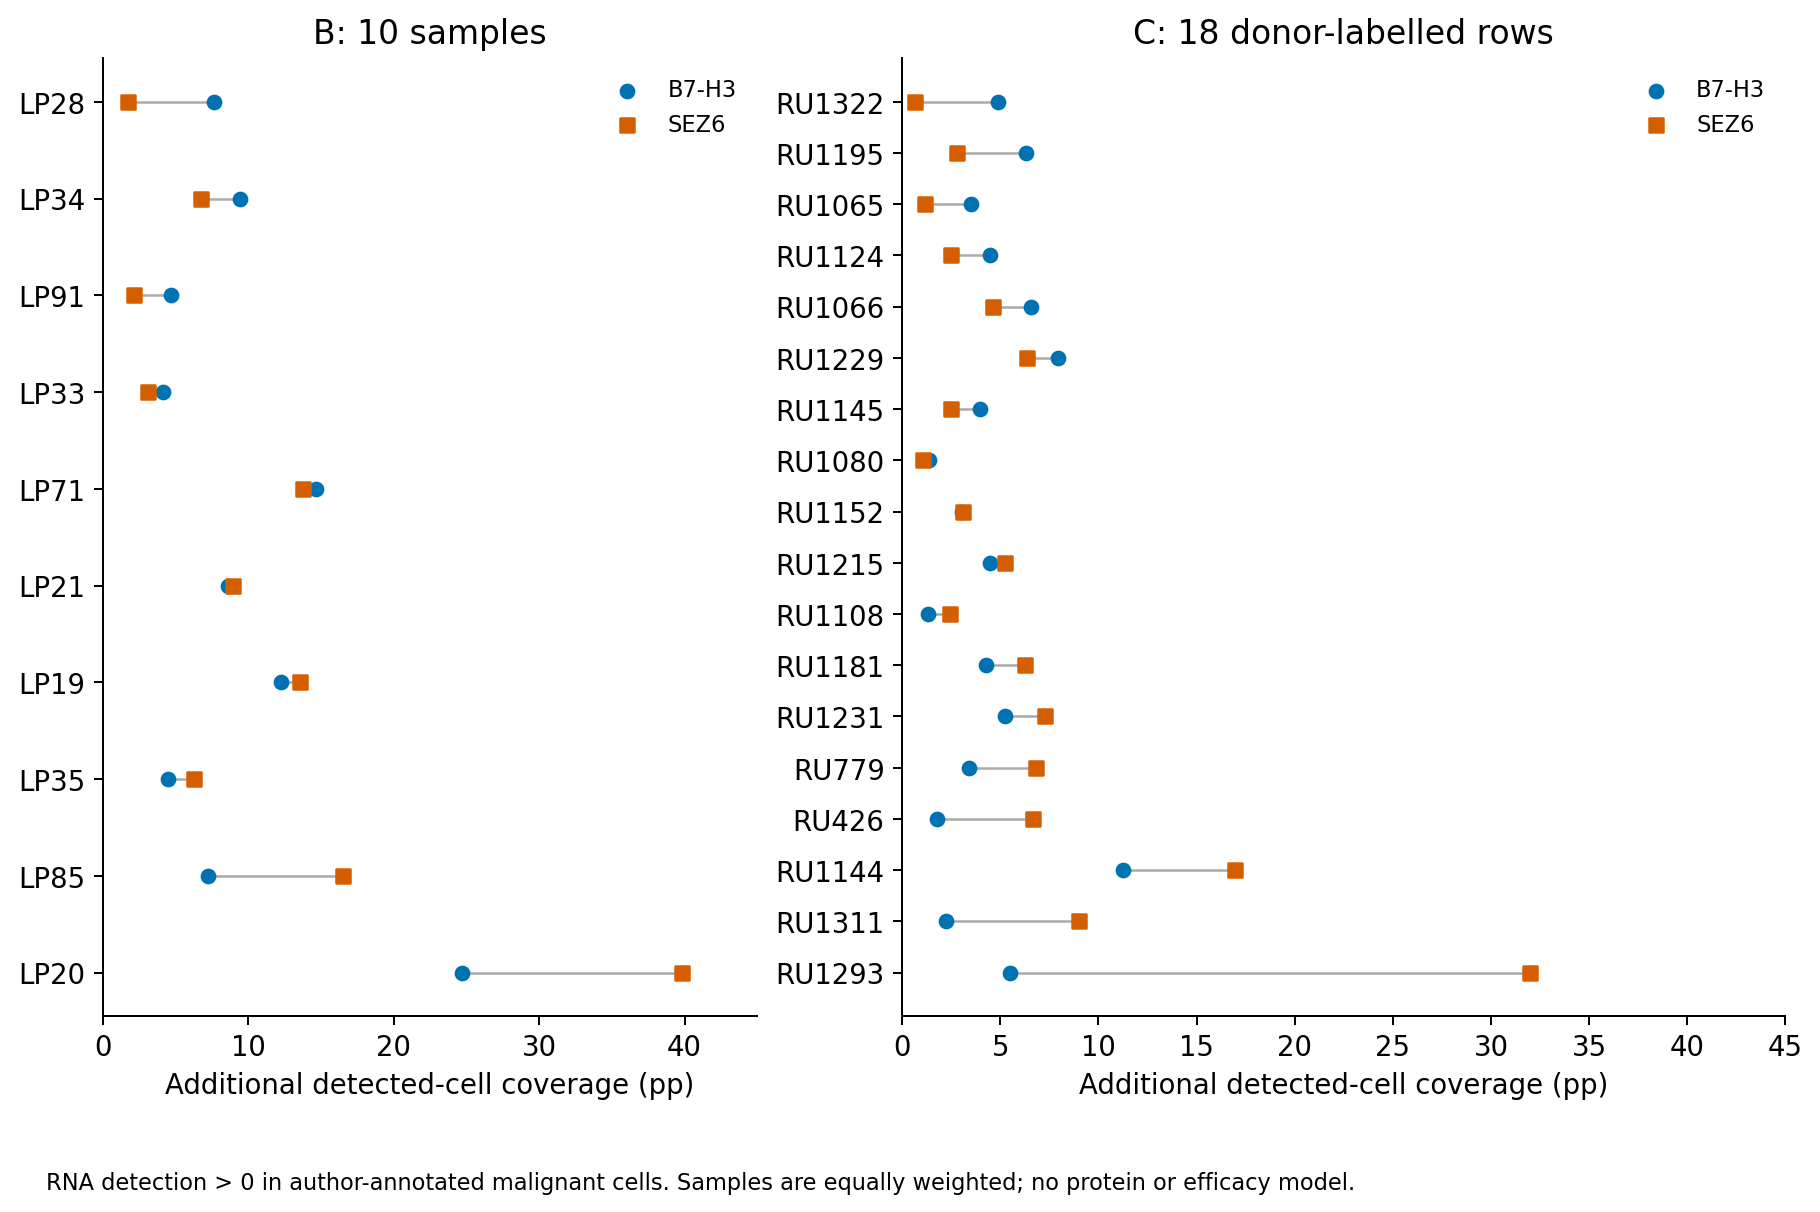
Figure 1. Each point is an increment in the fraction of malignant cells within the same sample. The pleural-effusion row is excluded.
Outputs come from analysis/run.py and outputs/tables/group_summaries.csv. Here pp means percentage points: 10 pp adds ten points relative to all malignant cells.
Table 2. Cohort-average RNA coverage and additional coverage.
| Cohort | n | DLL3 | Additional B7-H3 | Additional SEZ6 | All three undetected |
|---|---|---|---|---|---|
| B | 10 | 37.60% | 9.78 pp | 11.26 pp | 44.45% |
| C | 18 | 65.13% | 4.53 pp | 6.53 pp | 24.96% |
SEZ6 has the larger mean in each cohort, but paired-difference intervals cross zero.
Table 3. Mean within-sample additional-coverage difference.
| Cohort | Mean difference B7-H3−SEZ6 | Row-bootstrap 95% interval |
|---|---|---|
| B | -1.48 pp | -5.51 to 1.78 pp |
| C | -1.99 pp | -5.54 to 0.53 pp |
Evidence for a universally superior additional target is weak. B7-H3 adds more in 5/10 B samples and 8/18 C samples; SEZ6 adds more in the remainder. Figure 1 reveals differences hidden by small mean differences. However, unquantified within-sample RNA detection error means observed sample rankings need not be stable biological differences.
As a descriptive comparison, I choose SEZ6 uniformly because it has the larger B mean and apply the same rule to C. The table was already known, so this is not prospective validation on unseen data.
Table 4. Uniform SEZ6 versus sample-specific selection after observing the same table.
| Cohort | Uniform SEZ6 | Larger target per sample | Difference |
|---|---|---|---|
| B | 11.26 pp | 12.56 pp | 1.31 pp |
| C | 6.53 pp | 7.48 pp | 0.96 pp |
Choosing the larger observed value is a retrospective descriptive upper bound with these two additional targets and this RNA table fixed, not selection performance in new patients. It is not a maximum achievable biological effect or coverage including other targets. It illustrates coverage missed by a uniform target choice. Protein–efficacy validation would be needed for therapeutic use. Even this retrospective choice adds only 1.31 pp in B and 0.96 pp in C. Ranking-change frequency and average benefit from individualized selection are different quantities.
Three targets do not cover every cell
Inclusion–exclusion reconstructs eight mutually exclusive detection states. The SEZ6/B7-H3 intersection follows from the known union and copositivities:
\[ \begin{aligned} P(S^+\cap B^+) &= P(D^+)+P(S^+)+P(B^+)\\ &\quad-P(D^+\cap S^+)-P(D^+\cap B^+)\\ &\quad+P(D^+\cap S^+\cap B^+)\\ &\quad-P(D^+\cup S^+\cup B^+). \end{aligned} \]
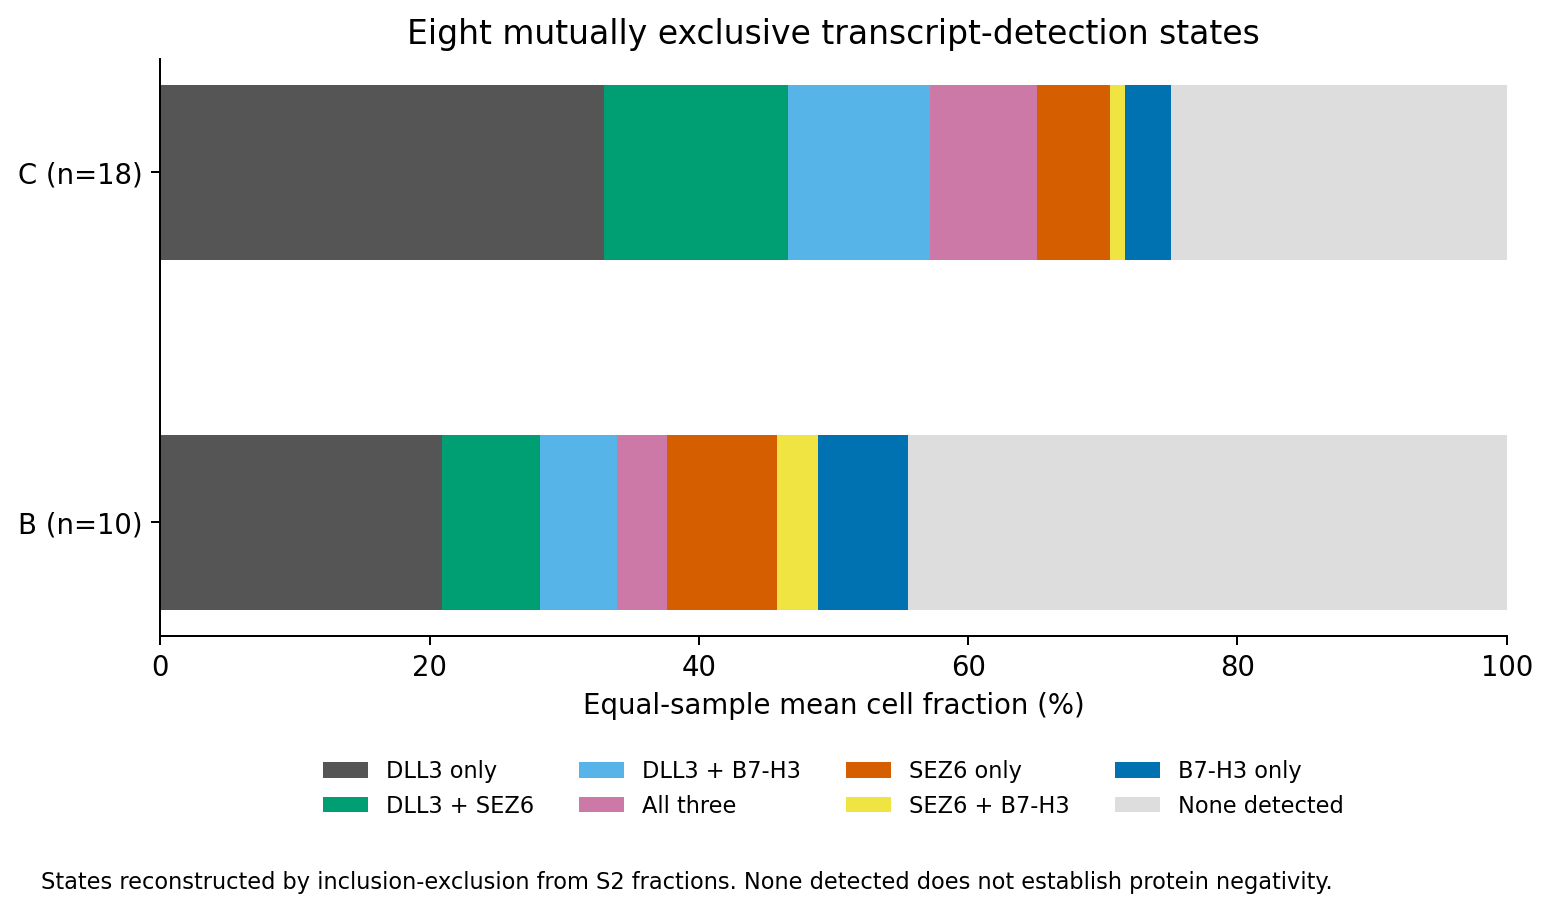
Figure 2. Equal-weight sample averages within cohorts, not pooled-cell fractions. Gray indicates no detected RNA for any of the three targets. It does not identify absence of target protein or treatment-resistant cells. Detection dropout, abundance and cell state cannot be separated with this table.
Table 5. Additional coverage from a third target.
| Cohort | Add B7-H3 to DLL3+SEZ6 | Add SEZ6 to DLL3+B7-H3 | Mean three-target coverage |
|---|---|---|---|
| B | 6.69 pp | 8.17 pp | 55.55% |
| C | 3.38 pp | 5.37 pp | 75.04% |
The fact that adding a target cannot reduce the RNA union follows from set definitions. The empirical questions are increment size and between-sample variation. An increment alone establishes neither drug benefit nor its balance against toxicity. The union also uses an OR rule: detection of either target qualifies a cell. A hypothetical design requiring both tumor antigens would instead concern their intersection. A drug described as dual-targeting cannot therefore be assigned this coverage without specifying its recognition rule.
Sensitivity to excluded rows and sample composition
Cohorts differ in subtype and treatment history. For C, I include the effusion row or restrict to SCLC-A, matching B's subtype.
Table 6. Effusion and subtype sensitivity in C.
| C population | Rows | Mean difference B7-H3−SEZ6 |
|---|---|---|
| Exclude effusion | 18 | -1.99 pp |
| Include effusion | 19 | -1.77 pp |
| SCLC-A only, exclude effusion | 12 | -0.45 pp |
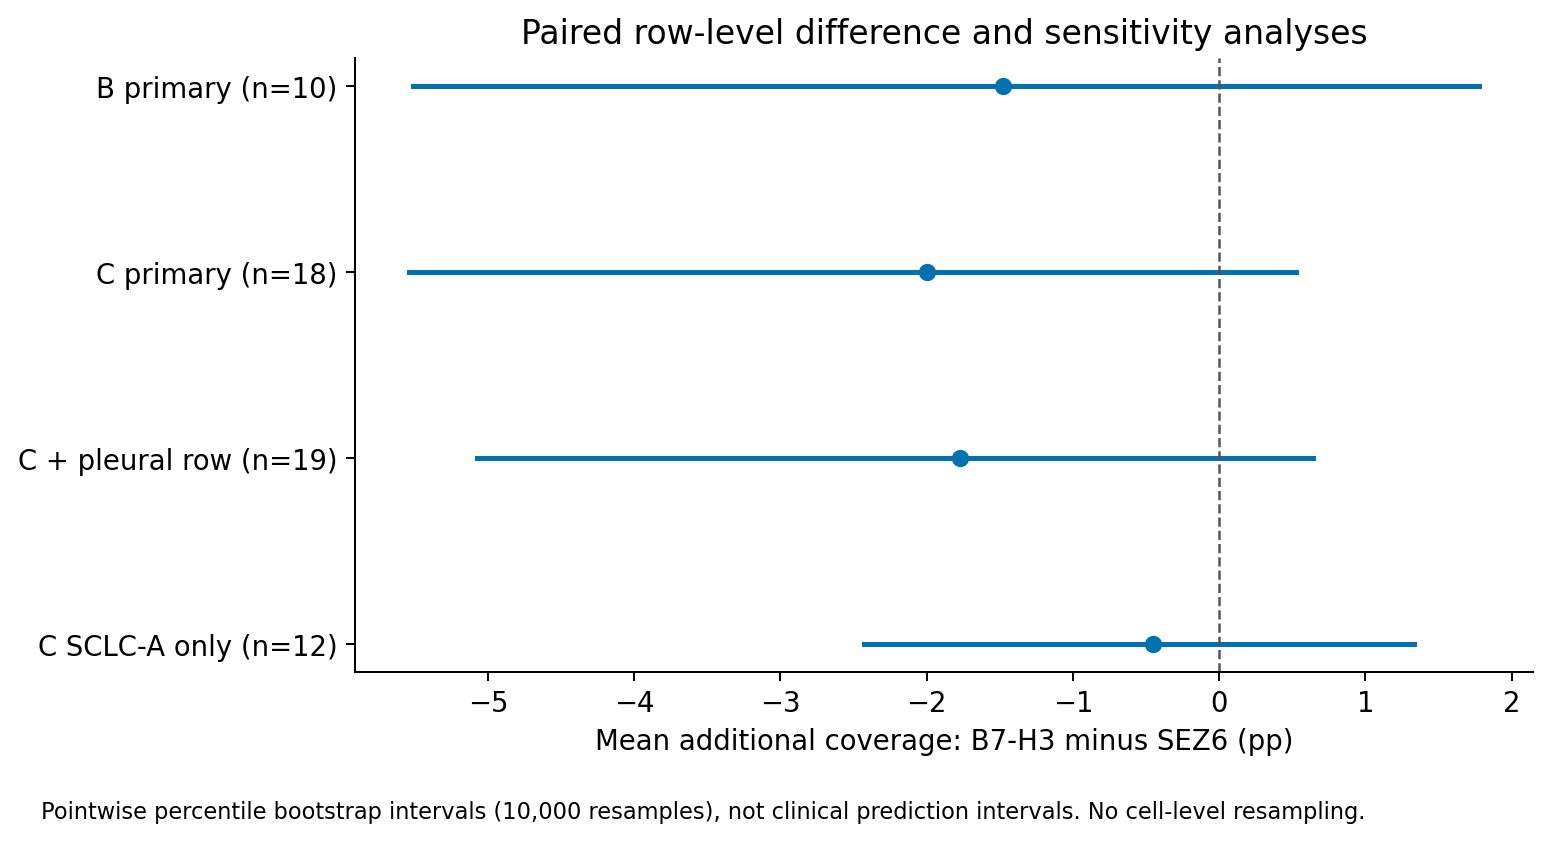
Figure 3. Main and alternative populations with row-bootstrap intervals. Restriction to SCLC-A reduces the mean difference. This does not identify subtype as the cause, but cautions against interpreting cohort means as a universal disease property.
Table 7. Mean differences after leaving out one sample at a time.
| Cohort | Minimum–maximum leave-one-sample-out mean difference |
|---|---|
| B | -2.30 to 0.04 pp |
| C | -2.36 to -0.55 pp |
In B, omitting one sample can reverse the mean ranking. Sample composition therefore matters alongside the ranking itself.
RNA coverage is not surface-antigen coverage
These fractions count cells meeting RNA detection rules. They do not estimate surface density, antibody-accessible targets or killing by T-cell engagers (TCEs) or antibody–drug conjugates (ADCs). These data cannot determine whether cells with undetected RNA lack surface antigen; adding cells does not bridge that measurement difference.
The original study (1) examined response to tarlatamab using circulating tumor cells (CTCs). Its treatment-response population and the tissue single-cell populations analyzed here are not matched patients. Applying the original response rates to RNA coverage would not create an individual response model. Complementary RNA detection does not demonstrate combination efficacy or suppression of antigen escape.
Although SEZ6 had higher mean additional coverage, retrospective sample-specific choice added only about one percentage point on average. Ranking changes alone therefore do not support a complex individualized selection strategy. They must be read together with the small RNA-coverage increment available under this comparison. Cohort differences also remain inseparable from sampling and detection conditions as well as subtype and treatment history.
Data and code availability
The analysis archive contains the CC BY input table, provenance and hashes, extracted CSVs, analysis code, results and tests.
python -m pip install -r requirements.txt
python analysis/import_s2.py
python analysis/run.py
python -m unittest discover -s tests -v
Definitions in the original coexpression Methods and Figure 7 and public code were rechecked on October 29, 2026. Original worksheet row numbers are retained. sample_coverage.csv holds all 29 rows and exclusion flags, group_summaries.csv main and sensitivity results, and frozen_rule_comparison.csv uniform versus retrospective choices. The fixed seed is 2026102502 with 10,000 resamples. Tiny negative reconstructed-state values of absolute magnitude below \(10^{-7}\), caused by source rounding, are clipped only for plots; original values remain in outputs.
References
- Mishra A, Meador CB, Kikkeri K, Cunneely Q, Lin M, Carmona-LaSalle TJ, et al. Circulating Tumor Cells Predict Response to the DLL3-Targeting Bispecific Antibody Tarlatamab. Cancer Discov. 2026;16(5):911–930. doi:10.1158/2159-8290.CD-25-1483.
- Mishra A, Meador CB, Kikkeri K, Cunneely Q, Lin M, Carmona-LaSalle TJ, et al. Supplementary Data S2 from Circulating Tumor Cells Predict Response to the DLL3-Targeting Bispecific Antibody Tarlatamab [dataset]. AACR Figshare. 2026. CC BY 4.0. doi:10.1158/2159-8290.32728810. Accessed 2026 Oct 25.
- Chan JM, Quintanal-Villalonga Á, Gao VR, Xie Y, Allaj V, Chaudhary O, et al. Signatures of plasticity, metastasis, and immunosuppression in an atlas of human small cell lung cancer. Cancer Cell. 2021;39(11):1479–1496.e18. doi:10.1016/j.ccell.2021.09.008.
- Lin M and contributors. SCLC_response_to_Tarlatamab [source code]. Commit c14f343adda1e5c35fc56e8e2b3d9ed2a82e9894. MIT License. Repository. Accessed 2026 Oct 25.