siRNA selection: target knockdown and transcriptional changes
Approximate poster coordinates illustrate siRNA candidate tradeoffs, reading uncertainty and why changed-gene counts do not directly measure off-target effects.
On this page
One siRNA suppresses its target by approximately 80% while changing roughly a dozen genes in a figure. Another suppresses slightly more strongly but changes more than twenty. Which candidate should remain?
The Ginkgo Datapoints 2026 OTS poster compares differentially expressed gene counts on the horizontal axis with mean target knockdown on the vertical axis. Candidates against the same target do not cluster at one point. Target expression alone misses these differences (public poster) (1). Yet differential-expression counts cannot simply be called off-target counts: downstream consequences of intended suppression may be included.
I digitized ten approximate points and assessed two-objective selection. Allowing wider reading ranges reduced the number of dominated points from six to five and then four. The interpretation depends on what should be minimized and which differences the figure resolves. Sources were checked on October 19, 2026. This is a decision example from approximate coordinates, not expression-count reanalysis.
Eighty siRNAs at six concentrations
The study transfects HepG2 cells with 80 siRNAs against four targets and measures transcription using DRUG-seq. Concentrations are 0.1, 0.316, 1, 3.16, 10 and 31.6 nM. The design table lists six replicates for library conditions and untreated, transfection-reagent, nontargeting-siRNA and PPIB positive controls across fourteen 384-well plates (poster section 2).
Target effects are DESeq2 log2 fold changes relative to transfection-reagent controls on the same plate. DRUG-seq simultaneously measures many genes, allowing candidates with similar target suppression to be compared by broader responses. Section 5 illustrates Gene B candidates E0052, E0058 and E0061: similar target effects accompany different concentration responses in other genes.
Targets are anonymized as Gene A–D. I found no linked sequences, expression counts or analysis code in the inspected page and poster. Treatment duration and replicate independence are not adequately traceable. The landing-page abstract mentions CRISPR-KO comparison, but the poster's design and figures do not show a corresponding experiment; I exclude that claim as evidence here.
Not every changed transcript is undesirable
siRNAs can suppress unintended transcripts through partial complementarity to guide-strand seed sequences, as Jackson et al. demonstrated (2). Multiple siRNAs against one target help distinguish common target effects from sequence-dependent responses. Candidate-specific changes nevertheless need not all be direct off-target effects.
Table 1. Possible origins of transcriptional changes and corresponding comparisons.
| Origin | Relevant comparison |
|---|---|
| Downstream effects of target suppression | Reproduction across distinct seeds at comparable suppression |
| Unintended sequence-dependent action | Seed complementarity and changes with sequence or chemistry |
| Transfection or oligonucleotide response | Untreated, reagent and nontargeting controls |
| Cell state or measurement conditions | Matched viability, proliferation, cell count, timing and plate |
Shared changes do not prove target origin: common transfection procedures or sequence properties can also produce them. Different changes can reflect target-suppression kinetics or persistence. Matching mRNA at one time does not match protein effects or exposure history. The poster's mitochondrial-RNA observation for E0061 is not a standalone viability or safety assessment; those endpoints require distinct measurements.
What can ten points eliminate?
I read Gene A scatterplot section 4B, rounding gene counts to integers and mean knockdown to one decimal place. These are approximate readings rather than known raw-data precision. Aggregation and differential-expression thresholds cannot be reconstructed from the public legend.
The hypothetical preference is higher target knockdown and fewer changed genes. Another candidate dominates a point if it is at least as good on both axes and strictly better on at least one. Pareto dominance avoids combining axes with arbitrary weights. Treating fewer changed genes as preferable is a selection assumption, not evidence that therapeutic downstream responses should be minimized.
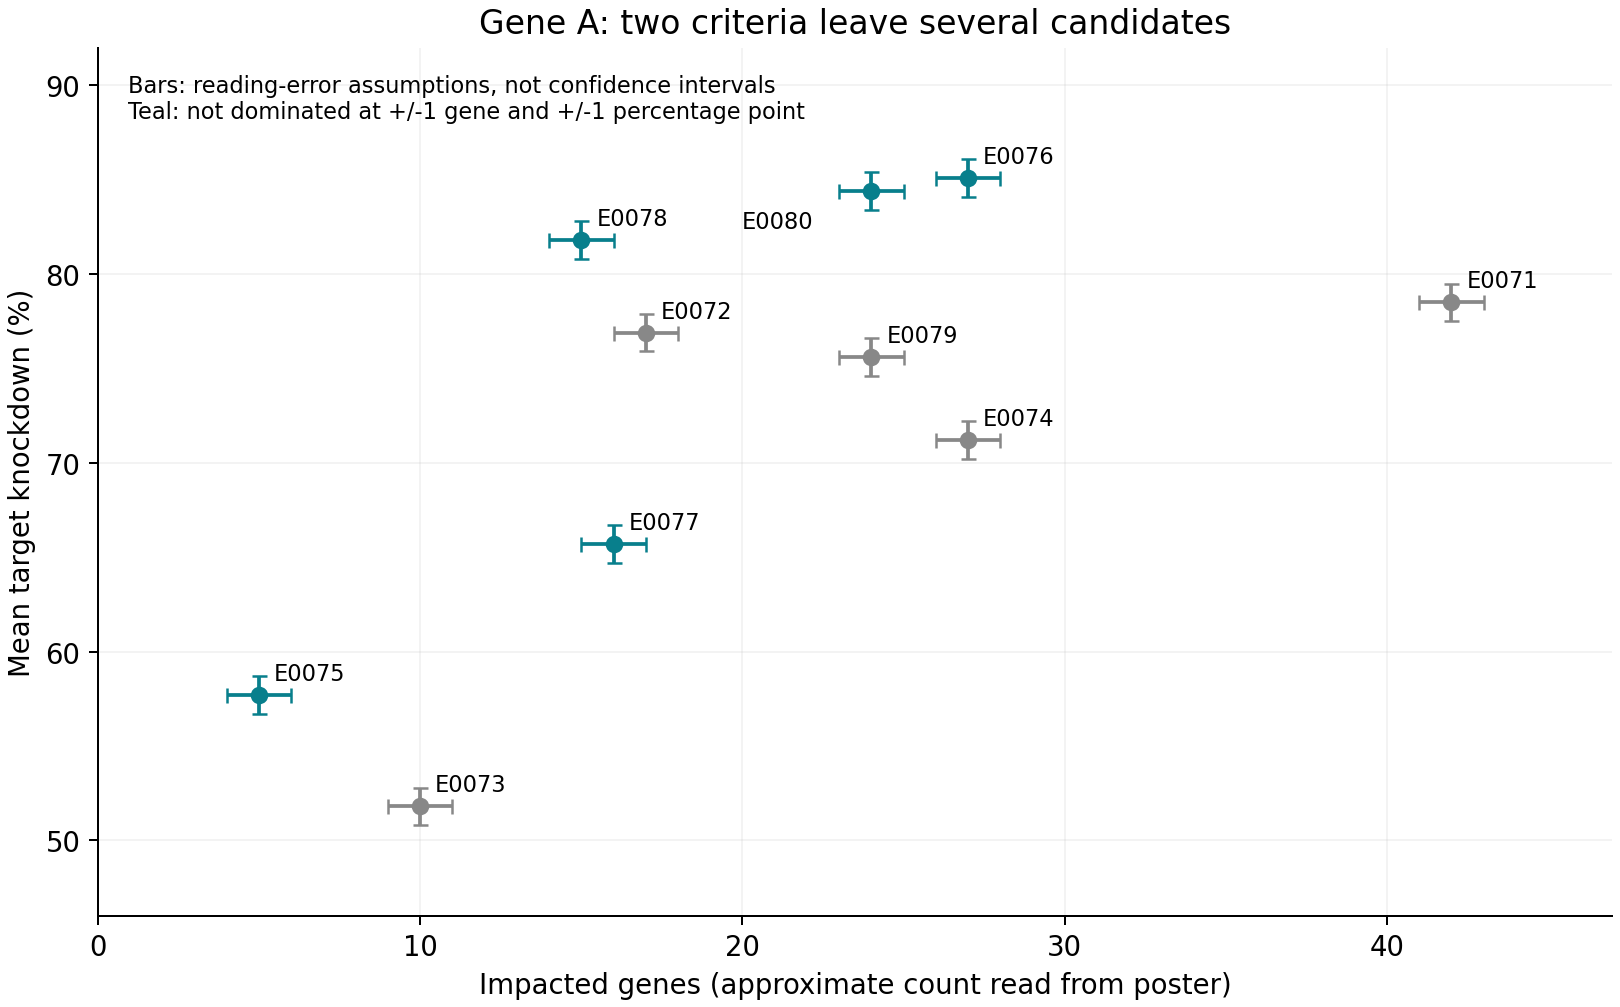
Figure 1. Independent plot from approximate section-4B coordinates. Bars represent assumed reading ranges, not standard errors or confidence intervals; teal points remain nondominated with the reading ranges.
Table 2. Pareto judgments under alternative reading ranges.
| Coordinate treatment | Dominated points | Points not established as dominated |
|---|---|---|
| Approximate readings without ranges | 6 | 4 |
| Each point ±1 gene and ±1 percentage point | 5 | 5 |
| Each point ±2 genes and ±2 percentage points | 4 | 6 |
Robust dominance requires even the favorable candidate's worst values to match or exceed its comparator's best values. This is digitization sensitivity, not experimental statistical uncertainty. Neither range comes from a measured error distribution.
For example, E0078 is approximately 15 genes and 81.8% knockdown, versus E0077 at 16 genes and 65.7%. Knockdown differs considerably, but gene counts differ by approximately one. With ±1-gene ranges, their ordering on that axis is unresolved and strict two-axis dominance fails.
E0078 versus E0071 is approximately 15 versus 42 genes and 81.8 versus 78.5%. Dominance persists under ±1 ranges but disappears for this pair with ±2-percentage-point vertical ranges. E0071 remains dominated by another candidate. Pairwise comparisons and a candidate's overall status differ.
Without reading ranges, E0075, E0078, E0080 and E0076 remain. E0075 changes fewer genes but suppresses less strongly. An illustrative ≥80% mean-suppression gate leaves E0078, E0080 and E0076, three candidates. The threshold has no functional or target-protein justification here and does not identify a development winner.
Compare extra changes at matched target action
An unspecified mean knockdown cannot be relabeled as a fixed-concentration or matched-target-effect comparison. Knowing each candidate's concentration required for a functionally justified suppression level would enable comparison nearby. Those levels and concentrations remain unidentified in this material. Extrapolating beyond the measured range or matching mRNA alone would not establish matched protein action or function.
Shared responses across sequences and residual candidate-specific changes can inform interpretation. Rescue and other intervention types can add evidence, but complete knockout and partial suppression are different conditions. More comparators do not automatically identify mechanism.
Expression and calling thresholds also matter. Poster Gene C has DepMap expression 0.1 TPM and illustrates difficult suppression detection. Low-expression nondetection establishes neither weak efficacy nor absence of other changes.
The unit behind the qPCR cost comparison
Section 7 estimates approximately US$40,000 for RT-qPCR, US$50,000 for DRUG-seq and US$360,000 for bulk RNA-seq at the same screening scale. Timelines are three, three and seven weeks, including treatment, preparation, measurement and analysis (section 7).
Here DRUG-seq costs approximately US$10,000 or 25% more than qPCR, even if cost per measured gene is lower. It is approximately 14% of the all-condition bulk-RNA-seq estimate. These totals do not compare against a staged strategy of qPCR screening followed by RNA-seq for a few candidates. Small follow-up costs cannot necessarily be inferred by dividing full-screen cost by sample count. The value of additional response information depends on how it changes selection and repeat experiments. These are presenter-specific estimates, not general market prices.
Target suppression alone does not rank the candidates
The poster describes the data as a machine-learning foundation but does not validate predictions for unseen siRNA sequences. Predicting another concentration for an existing sequence differs from extrapolation to new sequences, chemistry or cell backgrounds.
Among these ten points, target suppression alone loses candidate differences. Adding response counts does not establish whether those changes are beneficial or undesirable. The figure cannot determine one superior candidate. Transfected HepG2 responses also exclude delivery, systemic PK, duration and other-tissue effects relevant to drug performance.
Data and code availability
The coordinates, code and instructions produce dominance relations, reading-range sensitivity and cost ratios with analysis.py; plot.py redraws Figure 1. Original poster, raw expression and sequences are not bundled. The additional chemical-modification paper by Jackson et al. (3) was consulted at abstract level, as was the seed-complementarity paper.
References
- Cox K, Rudibaugh T, Vigneau S, Riccardi A, Dedic C, Roach K, et al. Smarter siRNA Candidate Selection Through Scalable DRUG-seq Profiling. Oligonucleotide Therapeutics Society meeting poster. 2026. Poster; official publications listing.
- Jackson AL, Burchard J, Schelter J, Chau BN, Cleary M, Lim L, et al. Widespread siRNA “off-target” transcript silencing mediated by seed region sequence complementarity. RNA. 2006;12(7):1179-1187. doi:10.1261/rna.25706.
- Jackson AL, Burchard J, Leake D, Reynolds A, Schelter J, Guo J, et al. Position-specific chemical modification of siRNAs reduces “off-target” transcript silencing. RNA. 2006;12(7):1197-1205. doi:10.1261/rna.30706.