Can a public PRISM EC50 choose the next experimental concentration?
On this page
Abstract
Selected PRISM 19Q4 data for three drugs and six lung-derived cell lines were reanalyzed using constrained Hill curves, conditional residual profiles and technical-redo comparisons. Of 30 planned drug–cell–screen curves, one was entirely missing; 12 of the remaining 29 had EC50 profiles open at the search boundary. Optimization convergence did not establish identification. Some transitions persisted across technical redo, but conditional precision was not evidence of independent biological reproducibility. The selected sample does not estimate reliability across PRISM as a whole.
Introduction
A public screening EC50 can help identify compounds and cell lines for follow-up. A number in a table, however, does not itself justify concentrating measurements near that number. Whether the response midpoint is covered, which replicates remain and whether a curve persists across screens all matter.
Official PRISM 19Q4 data were reanalyzed for three prespecified drugs and six lung-derived cell lines. Of 30 planned curves, one was entirely missing. Twelve of 29 evaluable EC50 profiles remained open at search boundaries. Those point estimates cannot support precise sensitivity rankings or selection of additional concentrations. Other transitions, including erlotinib–HCC827, persisted across technical redo. This examines curve-specific support for follow-up, rather than judging PRISM overall.
Methods
Question and context of use
The quantity of interest is whether public EC50 values can support follow-up concentrations and repeat experiments, and which information changes that assessment. The context is nonclinical follow-up design. This neither estimates patient PK nor derives clinical doses or treatment choices from cell lines. Adopting an unsupported EC50 can concentrate measurements at inappropriate concentrations.
Data and preprocessing
PRISM pools cell lines and uses barcodes to measure relative viability after drug treatment (1). Official 19Q4 version 4 was used under its stated CC BY 4.0 license (2).
Before loading response values, six lung-derived, STR-confirmed lines were selected in ascending DepMap-ID order, and erlotinib, palbociclib and doxorubicin were fixed. Selection did not use responses or mutations. This small convenience sample does not represent all PRISM data.
Table 1. Selected data and observed measurements
| Item | Data used |
|---|---|
| Cell lines | HCC827, NCIH1581, NCIH1693, PC14, NCIH1650, RERFLCMS |
| Concentrations | Approximately 0.00061–10 µM; eight concentrations with approximately fourfold dilution |
| Potential measurements | 720 |
| Finite observations | 528; 192 missing |
| Evaluable curves | 29 of 30 planned combinations |
| Same-drug, same-line screen comparisons | 11 pairs |
Inputs are replicate-uncollapsed log2 fold changes, already subjected to QC, control normalization and ComBat adjustment (2, 3). They are not raw fluorescence. Retained measurements differ between detection plates; a curve with up to three plates and one with only one plate do not have equivalent independent replication.
Erlotinib and palbociclib occur in both HTS002 and MTS010. The README describes MTS010 as a technical redo and recommends preferring it when available (2). Their comparison is neither independent biological replication nor external validation.
Curve estimation and conditional profiling
Relative viability was calculated as \(v=2^{\mathrm{log2FC}}\) and fitted without clipping:
\[ v(c)=L+\frac{U-L}{1+(c/EC_{50})^h}+b_{plate} \]
\(L,U\) are high- and low-concentration asymptotes and \(h\) the Hill slope. Plate offsets \(b_{plate}\) average to zero within a screen; this is not a mixed-effects estimate of population variance from a few plates. Bounds were \(0\le L\le U\le2.5\), \(L\le1.5\) and \(0.1\le h\le5\). EC50 search extended three orders of magnitude beyond both ends of the measured range. Residual sums of squares were minimized from multiple starts.
EC50 is the midpoint between asymptotes, rather than the IC50 where viability equals 0.5. If \(L>0.5\), the model has no absolute 50% inhibition concentration even with finite EC50.
EC50 was then fixed while other parameters were reoptimized. Eighty-one local points were added to 101 points spanning the full search range, with four optimization starts at each. Residual increases were compared with an F-based 95%-equivalent criterion. That reference assumes independent, constant-variance approximately normal residuals and is approximate for this constrained nonlinear fit. It is a conditional admissible range, not a 95% confidence interval for independent experiments. Boundary constraints and correlations after correction preclude a coverage guarantee.
Results
Observed transitions versus numerical estimates alone
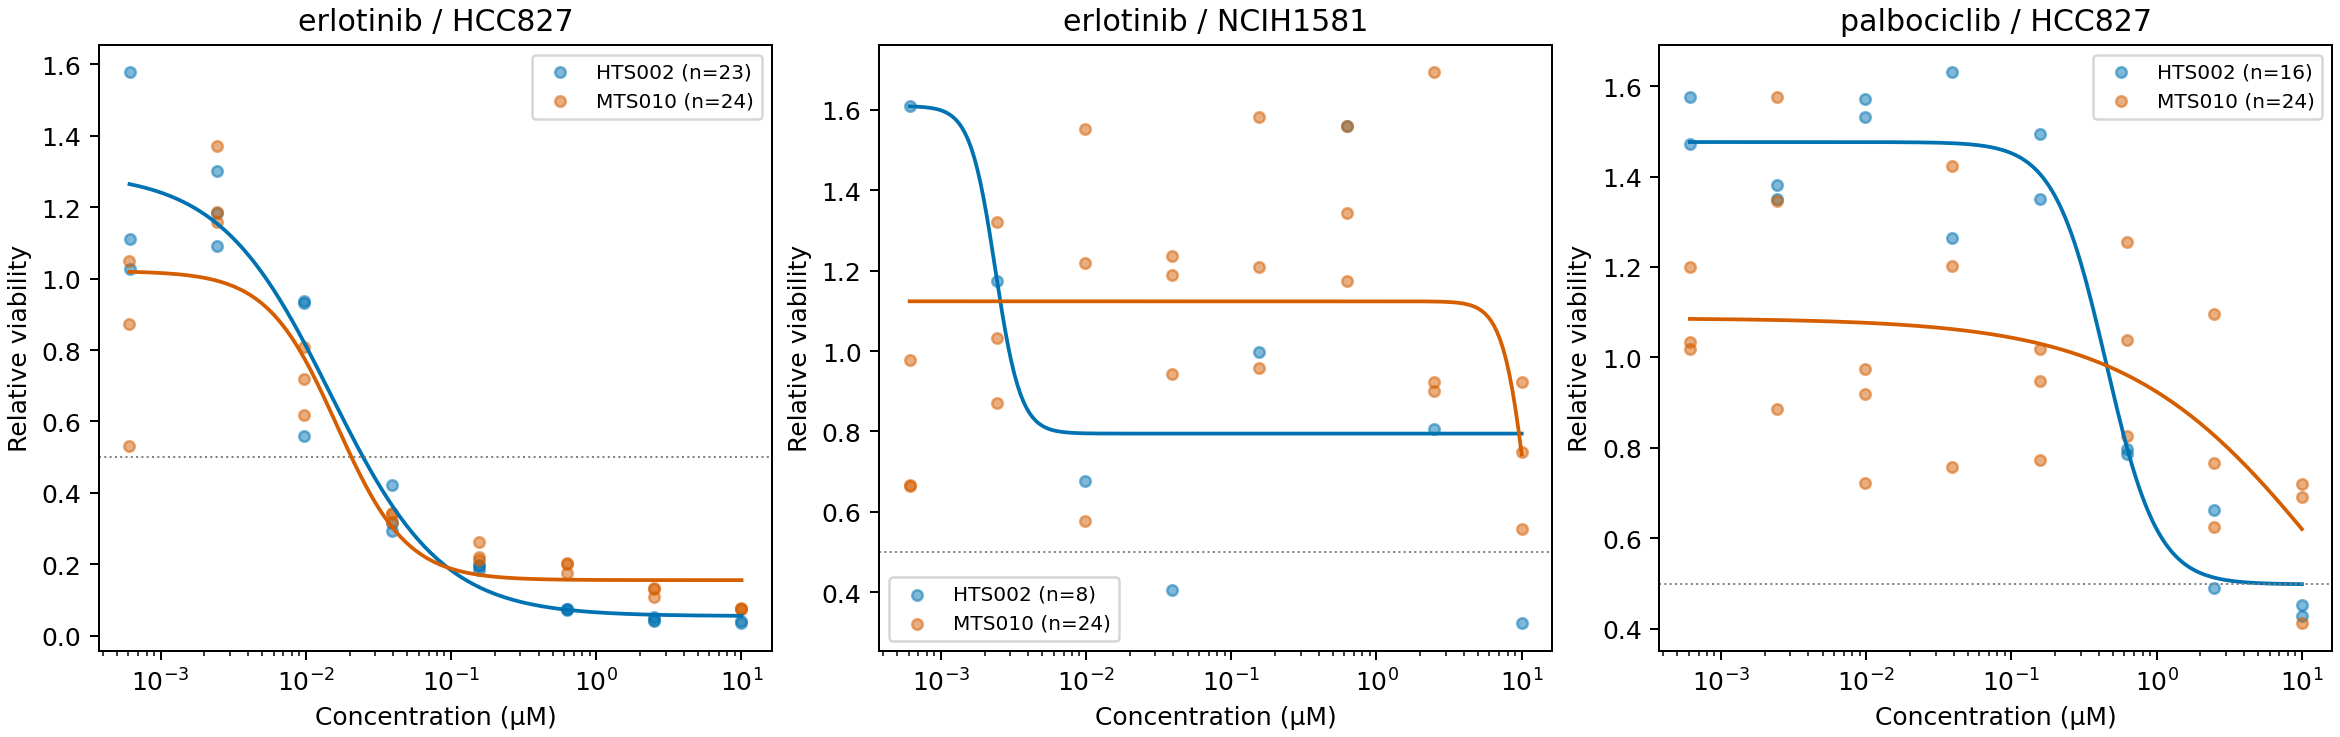
Figure 1. Technical measurements and fitted response curves. Erlotinib–HCC827 shows concentration-dependent decline in both screens. The central NCIH1581 example is variable, making its transition difficult to locate. For palbociclib–HCC827, MTS010 is scattered compared with the HTS002 transition. Legend n counts finite technical measurements, not independent experiments.
Table 2. Selected EC50 estimates and conditional profile ranges
| Curve | EC50 estimate (µM) | Conditional profile range (µM) | Interpretation |
|---|---|---|---|
| Erlotinib–HCC827, HTS002 | 0.0148 | 0.00768–0.0241 | Supports follow-up near the observed transition |
| Erlotinib–HCC827, MTS010 | 0.0164 | 0.00879–0.0362 | Similar transition in technical redo |
| Erlotinib–NCIH1581, HTS002 | 0.00237 | Open at search boundary | Do not choose concentrations from this point estimate |
| Erlotinib–NCIH1581, MTS010 | 11.4 | Open at search boundary | Does not identify a definite out-of-range EC50 |
| Palbociclib–HCC827, HTS002 | 0.449 | 0.297–0.656 | Estimate conditional on this screen |
| Palbociclib–HCC827, MTS010 | 15.8 | Open at search boundary | Does not transfer the original-screen value as precise |
Optimization converged for all 29 curves, but 12 profiles remained open at search boundaries and seven point estimates fell outside the measured range. Seventeen curves reached an asymptote or slope constraint, and seven retained only one plate. Convergence alone does not establish that EC50 is identified by observations. Some closed profiles also came from one plate; narrow conditional ranges do not establish independent reproducibility.
Changed point estimates and unidentified quantities
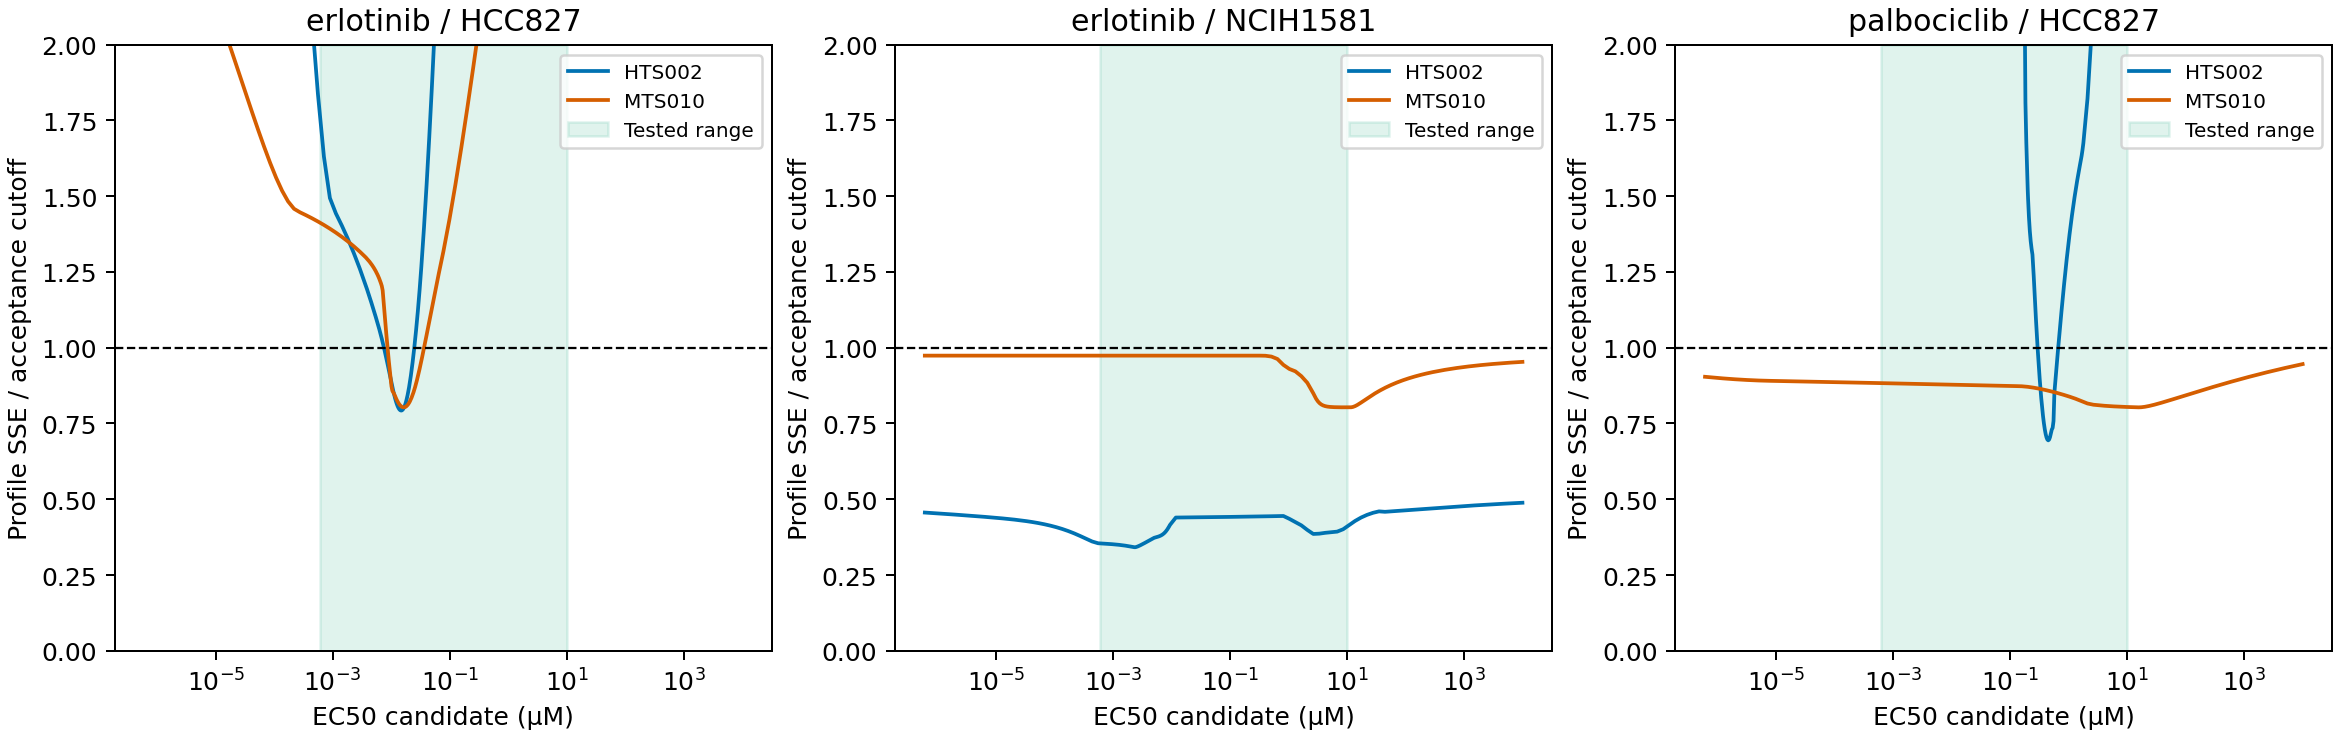
Figure 2. Conditional EC50 profiles. Erlotinib–HCC827 permits a restricted range. In the central flat profile, widely different EC50 values explain observations similarly. The plotted vertical range is restricted to 0–2; classification uses all saved profile values.
Ten of 11 same-drug, same-line pairs had EC50 point estimates differing more than fourfold across screens. Some values are unidentified, so this does not demonstrate a fourfold sensitivity change. Only three pairs have closed profiles in both screens, and conditional-estimation differences and technical reproducibility remain concerns even there.
Twenty-seven curves were also matched to official processed parameters. Constraints, plate offsets and optimization differ, so this does not reproduce official EC50 estimates exactly. It compares processing of the same observation source, not independent validation. Estimates, profiles and replicate structure are retained together for inspection.
Discussion
Local sensitivity does not optimize concentrations
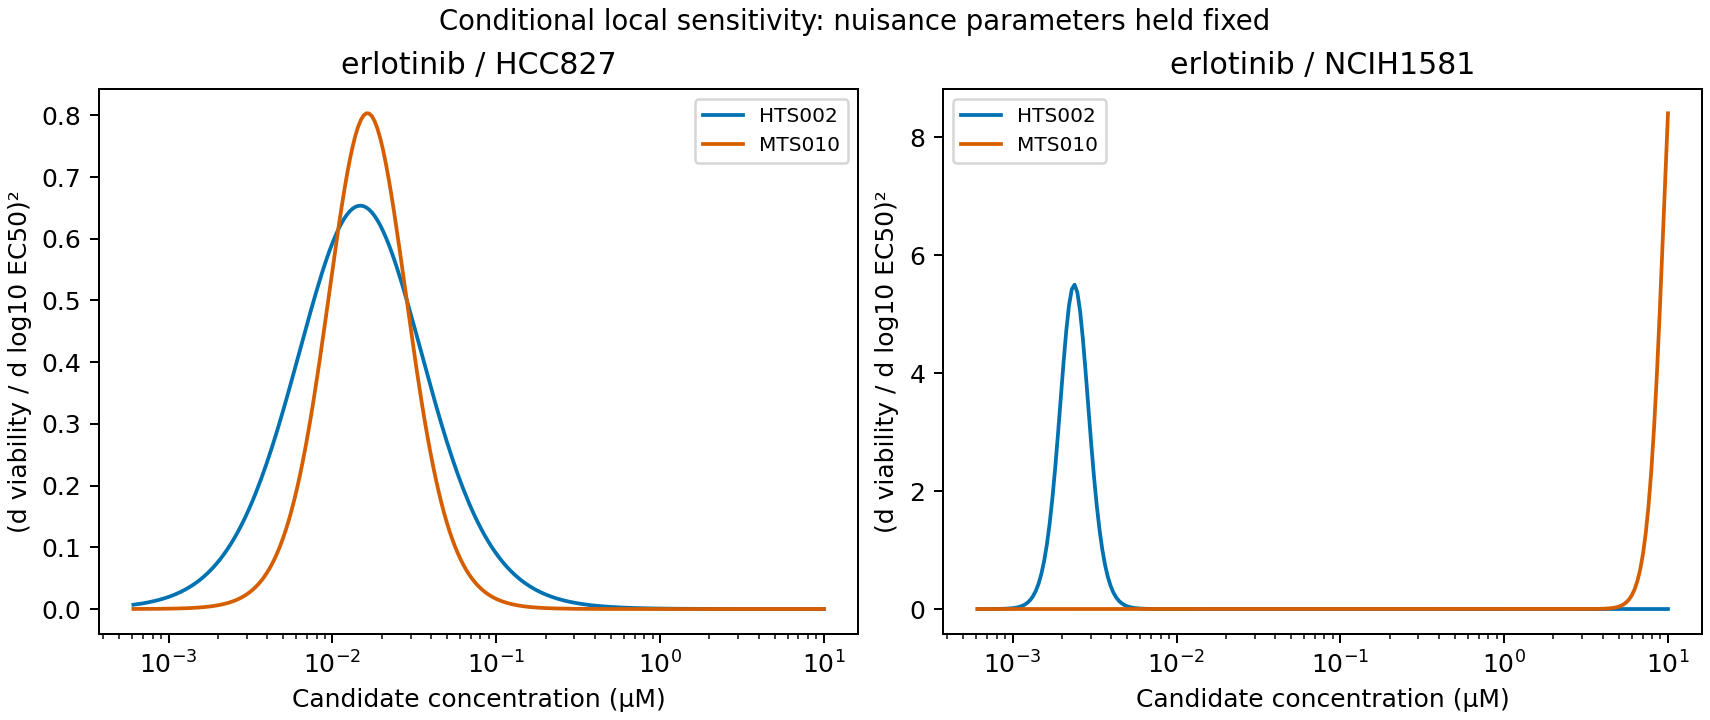
Figure 3. Conditional local sensitivity. With asymptotes and slope known, concentrations near EC50 are sensitive to its change. When those parameters are uncertain too, the local-sensitivity maximum does not determine an optimal added concentration.
Erlotinib–HCC827 has an observed transition around 0.01–0.03 µM in both screens. For open-profile or single-plate curves, support for adding concentrations around the point estimate is weaker. The sensitivity calculation does not resolve uncertain controls, asymptotes or reproducibility in another experiment.
Limitations
Three drugs and six lines do not provide a sample for estimating PRISM-wide non-identification rates. QC and ComBat were not reconstructed from uncorrected MFI, and plate offsets cannot restore preprocessing uncertainty. Independence, constant variance and Hill-model adequacy are also imperfect assumptions; profile ranges are not independent-experiment confidence intervals. Free medium concentrations, exposure-time differences and translation to patient PK were not addressed.
Conclusion
Using public EC50 values for follow-up requires checking observed concentration coverage, retained replication and parameter identification for each curve. This analysis distinguishes supported transitions around which to concentrate follow-up from curves requiring remeasurement over the original range. Technical precision alone does not establish biological reproducibility.
Data and code availability
Values come from curve_fits.csv, profiles.csv, audit.json and screen_comparison.csv generated by analysis/02_analyze.py. Figures were produced by analysis/03_figures.py; reproduction instructions and a notebook are retained in the analysis workspace.
Distributed functions
The ZIP of analysis functions and unit checks excludes source data and full-analysis reproduction materials. Constructed test cases check implementation, not clinical-data validity.
References
- Corsello SM, Nagari RT, Spangler RD, Rossen J, Kocak M, Bryan JG, et al. Discovering the anticancer potential of non-oncology drugs by systematic viability profiling. Nature Cancer. 2020;1(2):235–248. doi:10.1038/s43018-019-0018-6. PRISM project.
- Broad DepMap. PRISM Repurposing 19Q4 Dataset [Dataset]. Version 4. figshare. README, annotations, uncollapsed log2 fold changes and processed curve parameters. CC BY 4.0. Versioned dataset.
- Broad Institute. PRISM secondary screen processing script [Software]. Official processing code.