Trastuzumab rezetecan weight dosing across ADC and payload exposure
A public ADC/payload model separates weight effects, residual variability and covariate effects without selecting a clinical dose.
On this page
- Introduction
- Target and comparison conditions
- Reading supplementary code as well as the paper
- Why both AUCs have similar weight effects
- Individual variability remains
- Coefficient uncertainty and other covariates
- First and later cycles have different release terms
- Discussion
- Data and code availability
- References
Introduction
Does giving more drug to heavier people equalize exposure? For an antibody–drug conjugate, ADC, antibody-associated drug and circulating released payload need separate checks. In the public trastuzumab rezetecan model, their AUCs have nearly identical weight slopes. Both can be flattened algebraically, while albumin, AST and individual variability remain different. This article examines the limits of weight-only adjustment.
Target and comparison conditions
Trastuzumab rezetecan, SHR-A1811, is a HER2-targeted ADC with a topoisomerase-I-inhibitor payload. HORIZON-X follow-up and joint ADC/payload PopPK appeared in 2026 (1, 2). ASCO abstract 3505 also reports 4.8 mg/kg every three weeks in HER2-positive colorectal cancer (3). I use that regimen, also illustrated in the modeling paper, without extrapolating clinical outcomes to alternative doses.
The question is whether a dose suppressing ADC's weight-related AUC slope also equalizes payload AUC, and what remains beyond weight. Intended use is public-model research, not treatment or trial-dose selection. Four comparisons all give 290.88 mg at 60.6 kg:
Table 1. Dose comparisons.
| Design | Dose D(W), mg | Status |
|---|---|---|
| Weight-proportional | \(4.8W\) | Published comparison regimen |
| Fixed | \(290.88\) | Hypothetical |
| Power adjustment | \(290.88(W/60.6)^{0.526}\) | Hypothetical, derived below |
| Capped | \(4.8\min(W,70)\) | Hypothetical 70 kg cap |
W is kg. These alternatives are neither approved nor recommended schedules; rounding and preparation constraints are omitted.
Reading supplementary code as well as the paper
The PopPK study used 18,671 concentrations from 645 people, estimating ADC first and fixing it when estimating payload. I reuse final coefficients and random-effect variances, without individual data or new NLME estimation (2).
Supplementary NONMEM code defines payload input as empirical release rate times ADC central amount. It does not multiply that term again by ADC clearance or drug–antibody ratio. Let A1 and A2 be ADC amounts and Z an ADC-mg-equivalent computational payload state, not physical free-payload mass:
\[ \begin{aligned} \dot A_1&=R_{in}-\frac{CL+Q}{V_1}A_1+\frac{Q}{V_2}A_2,\\ \dot A_2&=\frac{Q}{V_1}A_1-\frac{Q}{V_2}A_2,\\ \dot Z&=k_{rel}A_1-\frac{CL_3}{V_3}Z,\\ k_{rel}&=RAT \quad(\mathrm{Cycle\ 1}),\\ k_{rel}&=RAT\times ALPHA \quad(\mathrm{Cycle\ 2\ onward}) \end{aligned} \]
Payload input does not subtract additional ADC mass. This is an empirical input relationship, not a stoichiometrically mass-conserving chemical model.
Table 2. Reused final coefficients.
| Quantity | Value |
|---|---|
| ADC CL, Q | 0.360, 0.162 L/day |
| ADC V1, V2 | 2.86, 2.88 L |
| RAT, ALPHA | 0.814 day⁻¹, 0.693 |
| Payload CL3, V3 | 392 L/day, 30 L, typical V3 fixed |
| Weight exponents: CL, V1, RAT | 0.525, 0.544, −0.546 |
| Log variances: CL, V1, Q, V2 | 0.0591, 0.0408, 0.0798, 0.546 |
| Log variances: RAT, ALPHA, CL3, V3 | 0.0419, 0.0692, 0.140, 0.146 |
These are final Table 1 values, not supplementary $THETA starting values. Variances use table omega-squared, not relative standard errors. Fixed typical V3 still has random variation in the model.
Other covariates are age 56, albumin 42.5 g/L, sum of target-lesion diameters, SOD, 52 mm, AST 25 U/L and NSCLC. Infusion is 90 minutes, with 30- and 180-minute sensitivities; this standardizes input rather than reproducing every clinical procedure.
Supplementary scales are S1=V1/151000 and S3=V3/533560. With ADC input in mg and ADC concentration A1/V1 in µg/mL, the reconstructed payload concentration is:
\[ C_{payload}=\frac{533560}{151000}\frac{Z}{V_3}\quad\mathrm{ng/mL} \]
This reconstructs consistent units from public scales without observing unpublished AMT preprocessing. Absolute payload concentrations are conditional on it; ratios between dose designs using the same conversion cancel the constant.
Why both AUCs have similar weight effects
At steady state with the later-cycle release rate fixed, compartment balance gives:
\[ AUC_{ADC}=\frac{D}{CL},\qquad AUC_{payload}=s\frac{k_{rel}V_1D}{CL\,CL_3},\qquad s=533560/151000 \]
ADC AUC is µg·day/mL and payload AUC ng·day/mL. Payload AUC depends on V1 and release rate as well as ADC clearance. With dose proportional to weight to power a and other covariates fixed:
\[ AUC_{ADC}\propto W^{a-0.525} \]
\[ AUC_{payload}\propto W^{a+0.544-0.546-0.525} =W^{a-0.527} \]
Negative release-rate and positive V1 weight effects nearly cancel. Minimizing the larger absolute AUC slope:
\[ \min_a\max\{|a-0.525|,|a-0.527|\} \]
gives a=0.526. This is an algebraic design against point estimates, not a clinically optimal dose estimate or evidence that 0.526 can clinically be distinguished from 0.525.
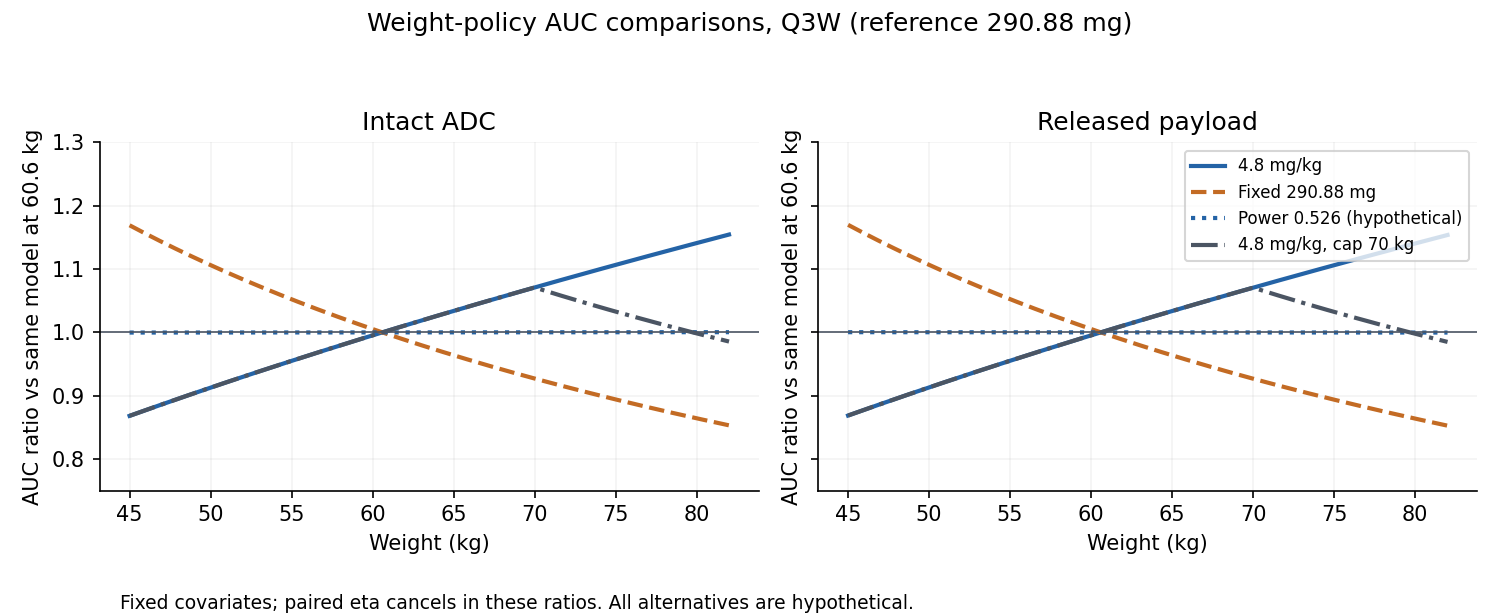
Figure 1. Ratios versus 60.6 kg at common covariates and random effects over the paper's 5th–95th-percentile weights, 45–82 kg. Similar panels reflect similar exponents. The cap overlaps proportional dosing below 70 kg.
Table 3. Typical endpoint-weight comparisons.
| Design | Dose at 45 kg, mg | Dose at 82 kg, mg | ADC AUC ratio, 45 / 82 kg | Payload AUC ratio, 45 / 82 kg |
|---|---|---|---|---|
| Proportional | 216.0 | 393.6 | 0.868 / 1.154 | 0.869 / 1.154 |
| Fixed | 290.9 | 290.9 | 1.169 / 0.853 | 1.170 / 0.853 |
| Power | 248.7 | 341.0 | 1.000 / 1.000 | 1.000 / 1.000 |
| 70 kg cap | 216.0 | 336.0 | 0.868 / 0.986 | 0.869 / 0.985 |
Fixed dosing reverses the slope; capping leaves the lighter-weight decrease. Power adjustment flattens AUC by construction, not by demonstrated patient improvement.
The paper's ADC ratios were 0.858 and 1.168, versus 0.868 and 1.154 here, differences +1.02 and −1.35 percentage points. Without individual records, seeds and original execution logs, the cause remains unresolved. Coefficients were not tuned to match; checking an equation differs from reproducing the entire original simulation.
Individual variability remains
Following the supplementary diagonal Omega, I generated eight log-normal effects and shared 4,096 draws across weights and designs. Covariate backgrounds are fixed, not sampled from a reconstructed joint patient distribution. Residual error, changing weight, dose reductions and interruptions are excluded.
Table 4. Steady state at 60.6 kg and 290.88 mg Q3W.
| Endpoint | ADC median [5th–95th percentile] | Payload median [5th–95th percentile] |
|---|---|---|
| Interval AUC | 805 [536–1,203] µg·day/mL | 11.82 [4.53–30.85] ng·day/mL |
| Cmax | 116.1 [87.5–153.5] µg/mL | 1.60 [0.72–3.57] ng/mL |
| Cmin | 13.10 [5.18–28.55] µg/mL | 0.190 [0.051–0.635] ng/mL |
These are simulated individual percentiles, not confidence intervals. Payload absolute values depend on the scale reconstruction. The paper reports underprediction of high payload concentrations, further limiting translation of upper peaks to safety thresholds. Shared random terms cancel in paired weight ratios; a narrow curve is not precise equalization of actual patients.
Coefficient uncertainty and other covariates
Published bootstrap 95% intervals for weight exponents were CL 0.400–0.661, V1 0.460–0.652 and RAT −0.710 to −0.398. Eight combinations of endpoints plus point estimates give nine sensitivity conditions, not a joint confidence region or probability distribution. The comparison metric is maximum absolute log AUC ratio across two AUCs, endpoint weights and reference weight.
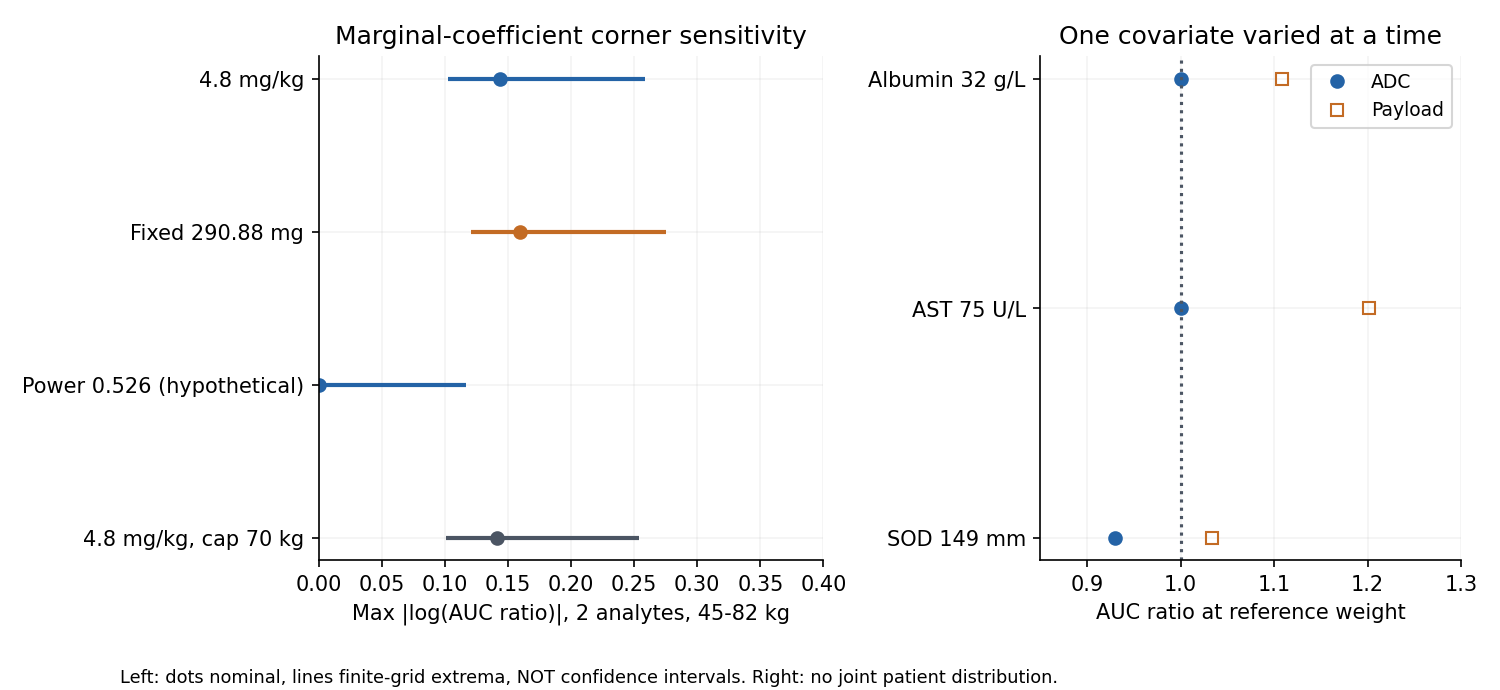
Figure 2. Left: point estimate and min–max over nine conditions, not a confidence interval. Even power adjustment gives AUC ratios 0.890–1.122 across coefficient combinations. Right: fixed-weight, one-covariate changes.
Table 5. One-at-a-time covariate effects.
| Change from reference | ADC AUC ratio | Payload AUC ratio |
|---|---|---|
| Albumin 42.5 to 32 g/L | 1.000 | 1.109 |
| AST 25 to 75 U/L | 1.000 | 1.201 |
| SOD 52 to 149 mm | 0.930 | 1.034 |
AST enters payload clearance and albumin affects V1 and other terms. Payload AUC can change without ADC AUC; SOD shifts them oppositely. These are equation substitutions, not within-patient observations or AST-based dosing recommendations.
First and later cycles have different release terms
Later release is multiplied by ALPHA=0.693. Comparing steady states with fixed release rates yields that payload-AUC ratio, but actual Cycle 1 and Cycle 2 AUCs need not differ by 0.693 because prior drug remains and ADC accumulates.
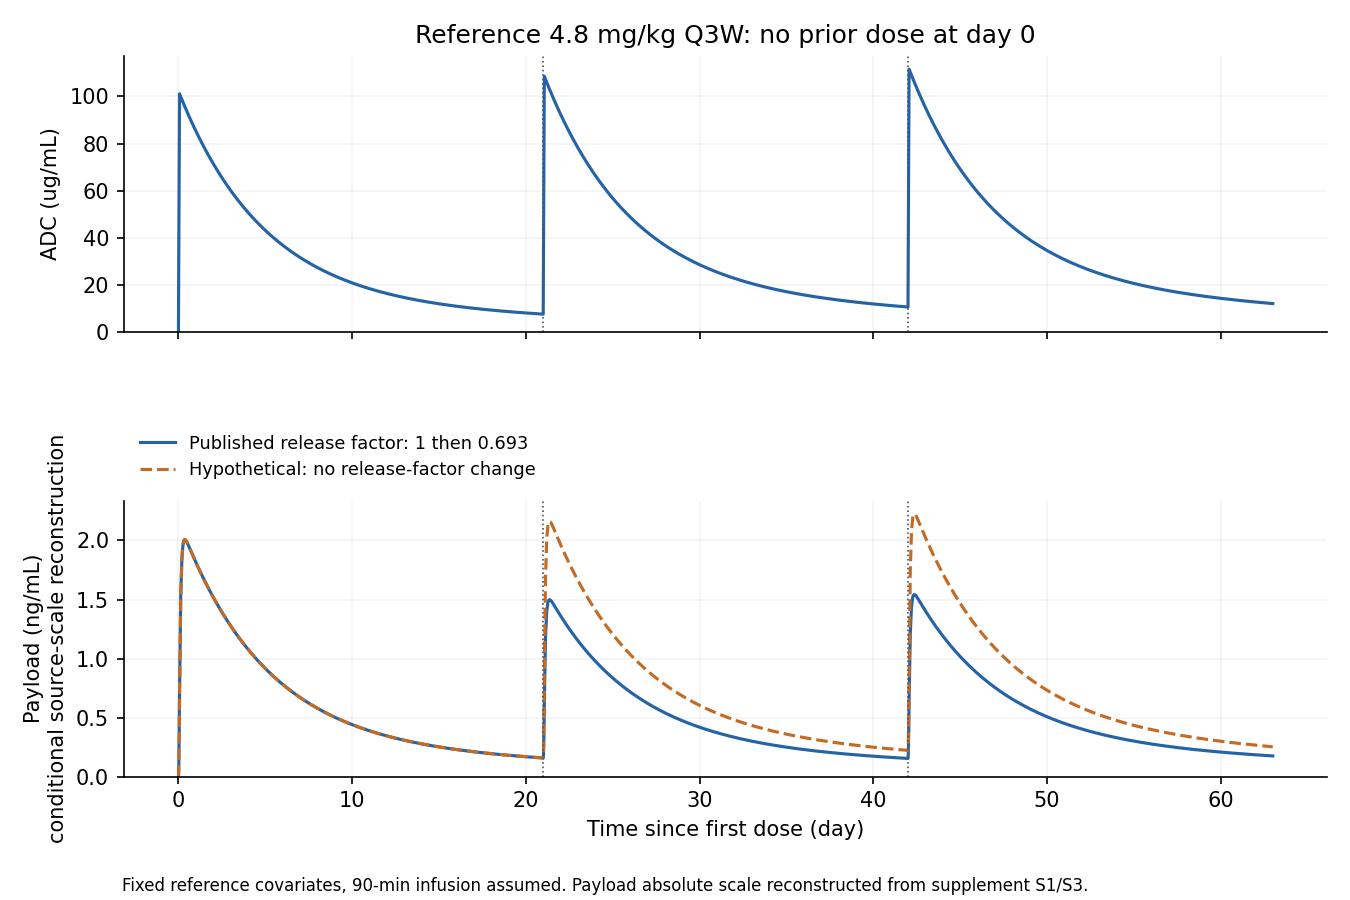
Figure 3. Typical profiles from zero initial drug with dosing every 21 days. Solid lines change release from Cycle 2 onward, including release from residual ADC; dashed lines do not.
The empirical cycle effect does not predict individual tumor shrinkage. The original tumor-dynamics linkage was insufficiently determined, so neither tumor response nor active intratumoral payload is inferred here.
Discussion
This model's ADC and circulating-payload weight slopes can be reduced together. The paper nevertheless judged covariate-based clinical dose changes unnecessary; hypothetical designs here do not overturn that judgment. Whether lower circulating payload preserves tumor delivery is outside the model. No public E–R coefficients supporting conversion to ORR, ILD or hematologic toxicity were identified.
Main comparisons cover 45–82 kg, not optimization across the supplementary 36.4–138 kg range. Joint covariates and dose rounding are omitted. Similar algebraic AUC slopes do not determine a clinically preferred regimen.
Data and code availability
analysis/run_analysis.py regenerates tables, figures and outputs/results.json using 4,096 draws and seed 20261021. Matrix exponentiation, independent ODE calculation and numerical integration check steady-state AUC. Original code, figures and individual data are not redistributed. Sources checked October 21, 2026.
Code, inputs, tables and instructions.
References
- Yao H, Yan M, Tong Z, Wu X, Yin Y, Ryu MH, et al. SHR-A1811, a novel HER2-targeting antibody-drug conjugate, in advanced solid tumors (HORIZON-X): a global phase 1 trial. Signal Transduction and Targeted Therapy. 2026;11(1):104. doi:10.1038/s41392-026-02612-9.
- Gao X, Zhao K, Zhao Y, Zhang Y, Zhao J, Zhao C, et al. Population Pharmacokinetics of Trastuzumab Rezetecan in Patients With HER2 ‐Expressing or Mutated Advanced Solid Tumors. CPT: Pharmacometrics & Systems Pharmacology. 2026;15(5):e70259. doi:10.1002/psp4.70259.
- Li J, Yuan Y, Liu T, Xiao X, Wang Y, Zhang F, et al. Phase 3 trial of trastuzumab rezetecan vs standard of care (SOC) for chemotherapy-refractory, HER2-positive, advanced colorectal cancer (CRC). Journal of Clinical Oncology. 2026;44(16_suppl):3505–3505. doi:10.1200/JCO.2026.44.16_suppl.3505. Conference abstract.