Does equal dose intensity imply equal Dato-DXd exposure?
On this page
Abstract
Published Dato-DXd PopPK equations were independently implemented to compare equal total doses over 84 days at three dosing intervals. Relative to 6 mg/kg every 21 days, 4 mg/kg every 14 days gave late-window ADC and DXd mean ratios of 0.972 and 1.004, with a DXd peak ratio of 0.770. Finite-period cumulative exposure differed from late-window averages. An unestimated alternative formation clock changed DXd predictions without changing total ADC PK. These conditional extrapolations do not establish preserved efficacy or reduced toxicity.
Literature checked on October 18, 2026. Calculations use public equations and estimated parameters, without refitting patient concentrations. Clinically evaluated regimens and mathematical comparison conditions are distinguished.
Introduction
Antibody–drug conjugates require measurement of both intact ADC and released payload. Equal amounts over equal periods need not change their concentration profiles in the same way.
The TROP2 ADC datopotamab deruxtecan (Dato-DXd) was modeled at 6 mg/kg every 21 days, 4 mg/kg every 14 days and 2 mg/kg every seven days using published PopPK equations (1). The latter two are hypothetical mathematical comparisons, not recommended regimens.
The 14-day schedule produced late-window ADC mean, DXd mean and DXd peak ratios of 0.972, 1.004 and 0.770 against the 21-day schedule. Similar means do not imply equal peaks or predose concentrations. The formation equation and comparison window require examination before interpreting efficacy or toxicity.
Methods
Question and context of use
Table 1. Analytical question and use
| Item | Definition |
|---|---|
| QOI | With equal total input and comparison periods, how do fractionated schedules change intact-ADC and released-DXd AUC, means, peaks and predose concentrations? How does extrapolating an empirical formation term affect interpretation? |
| COU | Research comparison of exposure metrics and model assumptions requiring verification for different intervals. Results alone do not select doses, change treatment or optimize efficacy/toxicity. |
| Analysis | Conditional simulations with estimated fixed effects, without new estimation, individual-patient reanalysis or population-risk prediction. |
Extrapolation can mistake a lower concentration metric for improved safety. Common periods, mass accounting, units and the formation term were therefore examined first.
Public sources
Table 2. Public information and its use
| Source | Information obtained | Use |
|---|---|---|
| Hong et al. 2025 PopPK paper (1) | Estimates, 90% CIs and covariates in Tables 1–2, Equations 8–15 and Figure 4 | Structural/covariate equations and numerical consistency within the model |
| Supplementary NONMEM code | Hour/day conversion, formation factors and molecular weights | Independent Python implementation; original code is not redistributed |
| Original Supplementary Table S1 | First infusion 90 minutes, subsequent infusions 30 minutes | Dose-event definitions |
| 2026 NSCLC E–R paper (2) | Endpoint-specific exposure definitions and limitations | Why outcomes are not directly extrapolated to new intervals |
| Prescribing information (3) | Reference 6 mg/kg every three weeks and weight-based cap | Distinguish the reference from hypothetical regimens |
The PopPK study used 729 patients, 9,036 ADC measurements and 9,012 DXd measurements (1). Those individual measurements and the joint covariate distribution were not obtained. All development-data dosing intervals were three weeks; seven- and 14-day schedules extrapolate beyond that interval range (Supplementary Table S1).
DXd here means unconjugated DXd, not drug unbound to plasma proteins. Plasma DXd is not equated with intratumoral or intracellular active exposure.
Units and parameters
The paper's summary gives DXd clearance as 2.66 L/day, whereas Table 2, Equation 14 and supplementary code use 2.66 L/h. The code divides only ADC CL, Q and Vmax by 24, without dividing DXd CL. That combination was retained.
Time is in hours, amounts in µg and volumes in L. Concentrations in µg/L numerically equal ng/mL; ADC figures/tables convert to µg/mL.
Table 3. Parameters and implementation units
| Parameter | Value | Unit |
|---|---|---|
| ADC linear CL | 0.386 / 24 | L/h |
| ADC central and peripheral volumes | 3.06, 2.88 | L |
| ADC Q | 0.422 / 24 | L/h |
| Nonlinear elimination Vmax | 8,410 / 24 | µg/h |
| Km | 4,490 | ng/mL |
| DXd CL | 2.66 | L/h |
| DXd volume | 25.1 | L |
| Formation factor from dose 2 onward | 0.696 | Dimensionless |
| Formation-factor decay β | 0.259 | h⁻¹, supplementary-code time scale |
| α and initial payload:intact ratio | 0.25, 4 | Dimensionless |
Reference covariates are 66 kg, male, age 62, albumin 38 g/L, summed tumor diameter 66 mm, AST 22 U/L, total bilirubin 0.4 mg/dL and US region. Random effects η are zero. This is not the trial population's mean curve. Weight is below 90 kg, so the clinical 540 mg cap does not operate in the main calculation.
Connecting intact ADC and DXd
Let A₁ and A₂ be central/peripheral ADC amounts and A₃ DXd amount.
\[ C_1=A_1/V_c,\quad C_2=A_2/V_p,\quad C_3=A_3/V_{DXd} \]
\[ R_{elim}(t)=CL\,C_1+\frac{V_{max}C_1}{K_m+C_1} \]
\[ \dot A_1=R_{in}(t)-R_{elim}(t)-Q(C_1-C_2),\qquad \dot A_2=Q(C_1-C_2) \]
\[ \dot A_3=R_{elim}(t)\,PIR(t)\frac{493.5}{150000}-CL_{DXd}C_3 \]
PIR is the code's payload:intact ratio. ADC elimination is converted using this ratio and molecular weights, rather than adding ADC mass directly to DXd.
\[ PIR(t)=4f_{cycle}\left[0.25+0.75\exp\{-0.259\,TSLD(t)\}\right] \]
In the original code, \(f_{cycle}=1\) during the first cycle and 0.696 thereafter; TSLD is time since the latest dose. This does not directly track true DAR for every circulating molecule.
Weight and albumin scenarios use published covariate equations. Holding other reference terms fixed gives
\[ CL_{ADC}\propto(WT/66)^{0.75}(ALB/38)^{-0.788},\qquad CL_{DXd}\propto(WT/66)^{0.298}(ALB/38)^{0.343} \]
The two exposure systems therefore need not move in the same direction. Covariate associations do not establish causal effects of manipulating albumin.
Results
Equal total input over 84 days
Table 4. Doses strictly before day 84
| Schedule | Doses before day 84 | Total dose |
|---|---|---|
| 6 mg/kg every 21 days | 4 | 24 mg/kg |
| 4 mg/kg every 14 days | 6 | 24 mg/kg |
| 2 mg/kg every 7 days | 12 | 24 mg/kg |
The next dose at day 84 is excluded; evaluation ends immediately before it. Every schedule delivers 1,584 mg at 66 kg. Comparisons use AUC₀–₈₄, mean and peak over days 42–84, and day-84 predose concentration. Days 42–84 are a late window, without proof of exact steady state.
AUC over 14 days is not directly compared with AUC over 21 days. Means divide AUC by the same specified window length.
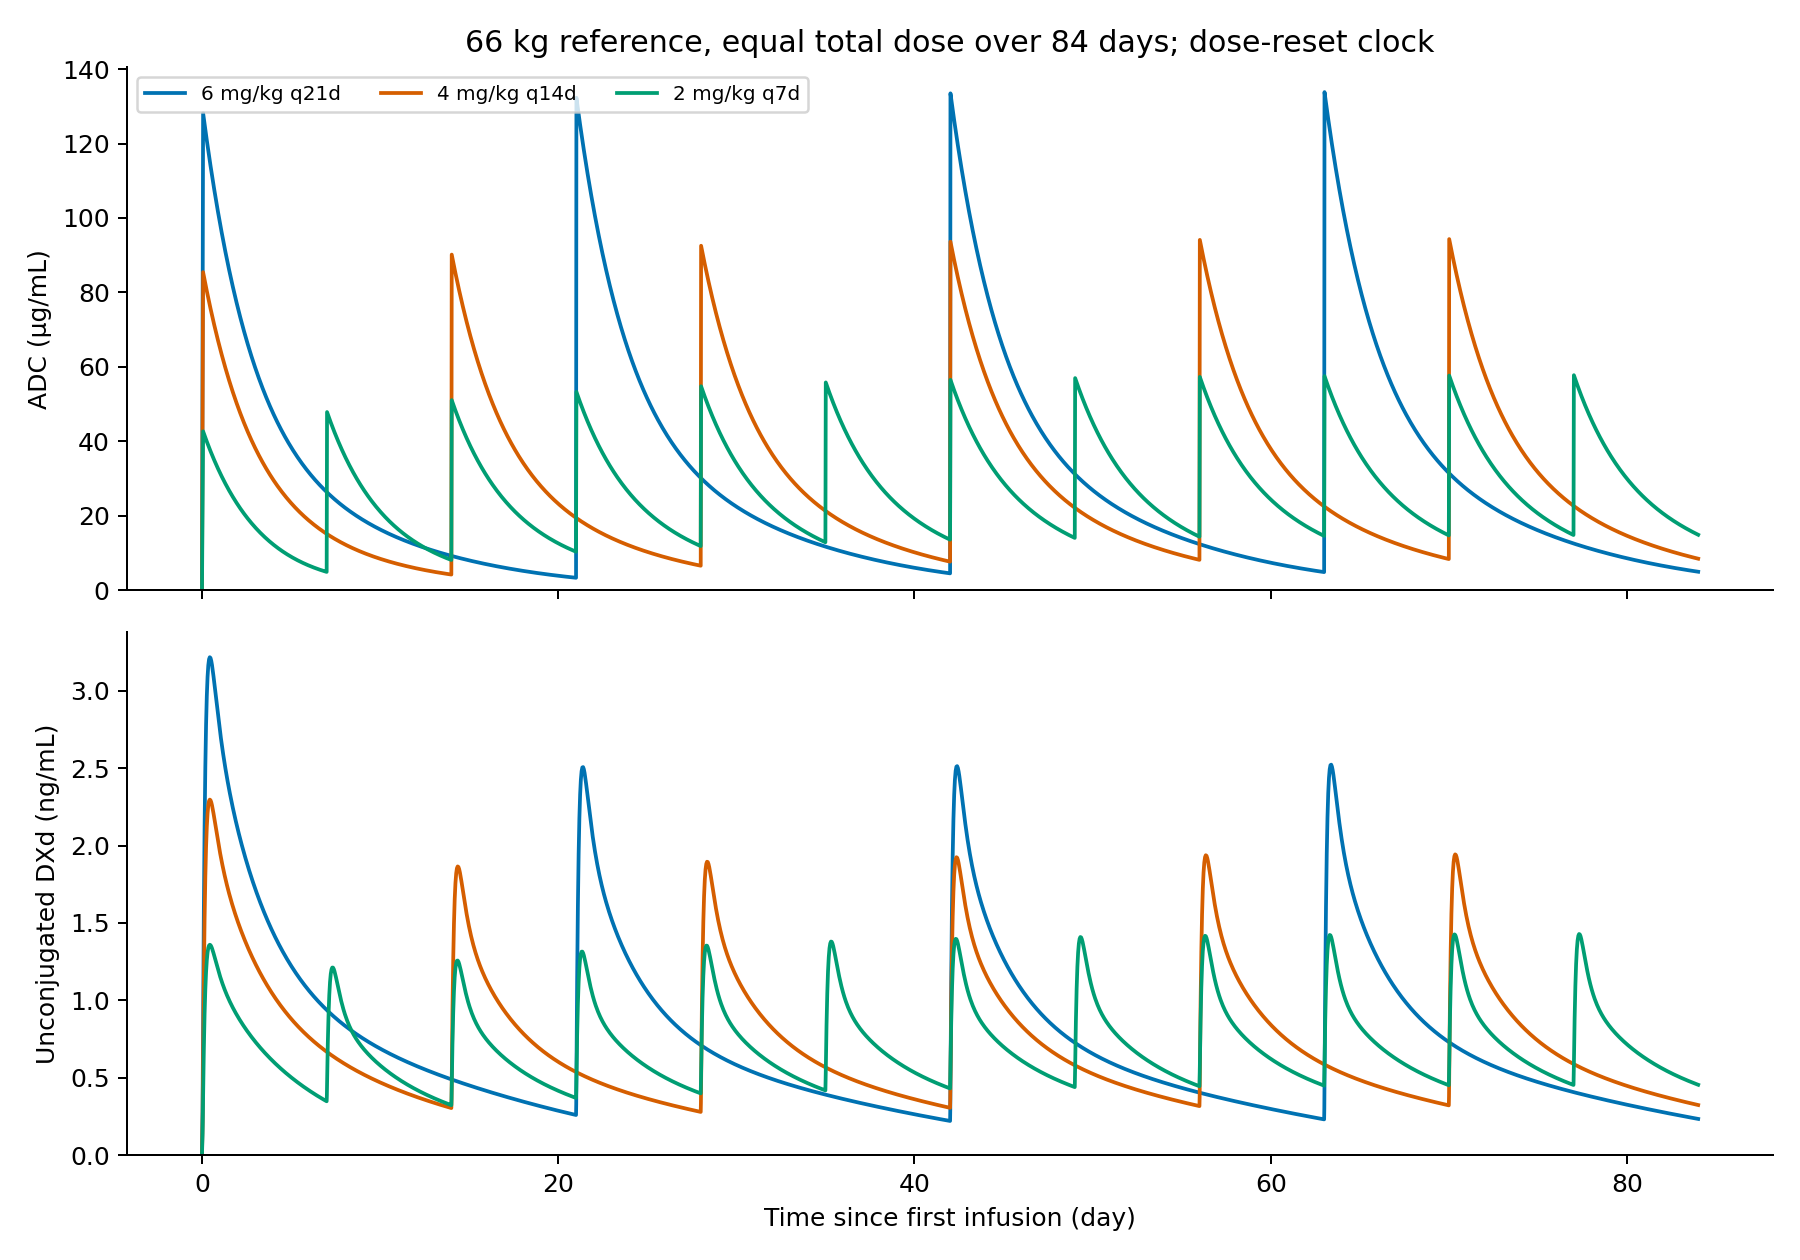
Figure 1. Reference-covariate profiles. Random effects are zero; the formation-clock factor resets with each dose.
Table 5. Late-window and predose ratios against 6 mg/kg every 21 days
| Schedule | ADC mean days 42–84 | DXd mean days 42–84 | ADC peak days 42–84 | DXd peak days 42–84 | ADC predose day 84 | DXd predose day 84 |
|---|---|---|---|---|---|---|
| 6 mg/kg q21d | 1.000 | 1.000 | 1.000 | 1.000 | 1.000 | 1.000 |
| 4 mg/kg q14d | 0.972 | 1.004 | 0.705 | 0.770 | 1.715 | 1.384 |
| 2 mg/kg q7d | 0.944 | 1.026 | 0.431 | 0.566 | 3.025 | 1.943 |
Ratios use identical reference covariates. They are neither population-mean ratios nor clinical-equivalence tests.
Table 6. Cumulative AUC ratios through day 84
| Schedule | ADC AUC₀–₈₄ ratio | DXd AUC₀–₈₄ ratio |
|---|---|---|
| 6 mg/kg q21d | 1.000 | 1.000 |
| 4 mg/kg q14d | 0.950 | 0.955 |
| 2 mg/kg q7d | 0.893 | 0.924 |
DXd cumulative AUC decreased to 0.955 and 0.924 under the 14- and seven-day schedules. Maintained or slightly increased late-window means cannot be generalized to whole-period exposure. Timing of the second-dose switch to formation factor 0.696 also differs by schedule.
Fractionation lowered peaks and raised predose concentrations for both analytes. ADC late means decreased 2.8% and 5.6%, whereas DXd means increased 0.4% and 2.6%. Not every exposure metric fell.
Separating elimination and remaining mass
Equal total input does not mean equal elimination by day 84. The seven-day schedule has less time since its final dose and more remaining ADC.
\[ D_{total}=CL\,AUC_{0-84}+M_{nonlinear,0-84} +A_1(84)+A_2(84) \]
For two schedules with equal total input and CL,
\[ \Delta AUC_{0-84} =-\frac{\Delta M_{nonlinear,0-84}}{CL} -\frac{\Delta M_{remaining,84}}{CL} \]
This is a mass-accounting identity within the model, not a new biological hypothesis.
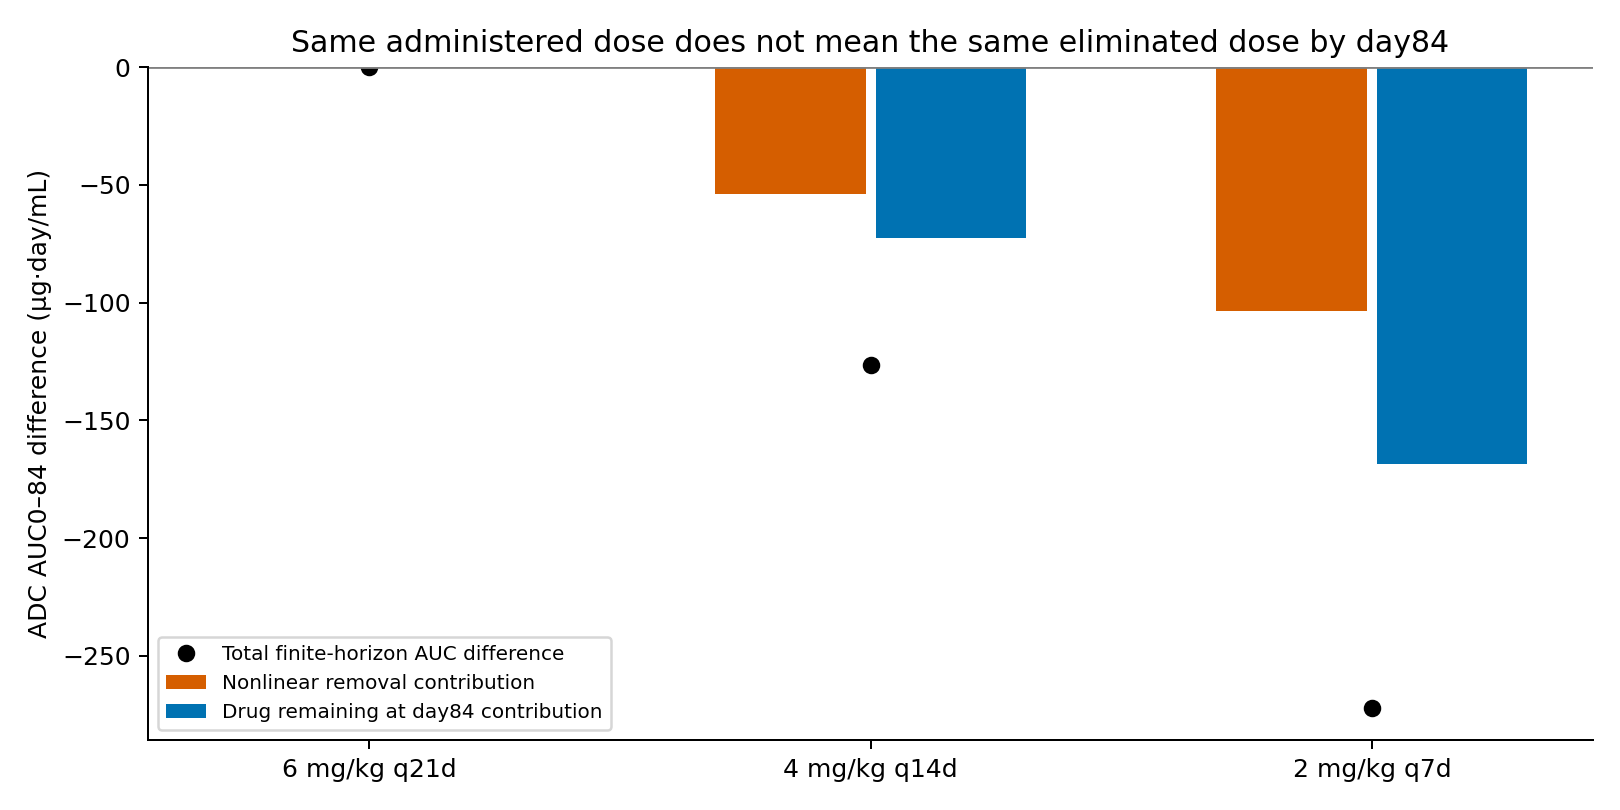
Figure 2. ADC AUC accounting. Differences are decomposed into nonlinear elimination and mass remaining at day 84.
Table 7. Components of ADC AUC₀–₈₄ differences
| Schedule | ADC AUC₀–₈₄ difference | Nonlinear-elimination component | Remaining-mass component |
|---|---|---|---|
| 6 mg/kg q21d | 0.0 | -0.0 | -0.0 |
| 4 mg/kg q14d | -126.3 | -53.8 | -72.5 |
| 2 mg/kg q7d | -272.2 | -103.5 | -168.7 |
Units are µg·day/mL relative to reference. Components sum to the AUC difference. Ignoring remaining mass would incorrectly attribute all finite-period differences to elimination pathways.
These are integrals through day 84, not AUC∞ including every post-final-dose contribution. In a linear-elimination control, adding the future AUC associated with remaining mass recovers total dose/CL for all schedules.
Formation clocks for overlapping ADC doses
The published equation uses one patient-level TSLD. A new dose therefore applies the immediate-postdose factor to DXd formation from remaining ADC too. An approximation fitted to 21-day intervals need not hold when residual doses overlap more at seven-day intervals.
An extension retained separate central/peripheral ADC amounts from each dose and their own ages. Nonlinear elimination uses total concentration and is allocated proportional to each dose's central amount. The 0.696 post-second-dose factor remains patient-wide; only the decay clock becomes dose-specific.
\[ R_{DXd}^{cohort}(t)= \frac{493.5}{150000}\sum_i \left[CL\,C_{1,i}+\frac{V_{max}C_{1,i}}{K_m+\sum_jC_{1,j}}\right] 4f_{cycle}\left[0.25+0.75e^{-\beta(t-t_i)}\right] \]
This extension is unestimated and unvalidated, not asserted to be a true DAR model. It tests extrapolation assumptions. Total ADC PK is algebraically unchanged, while DXd predictions can differ.
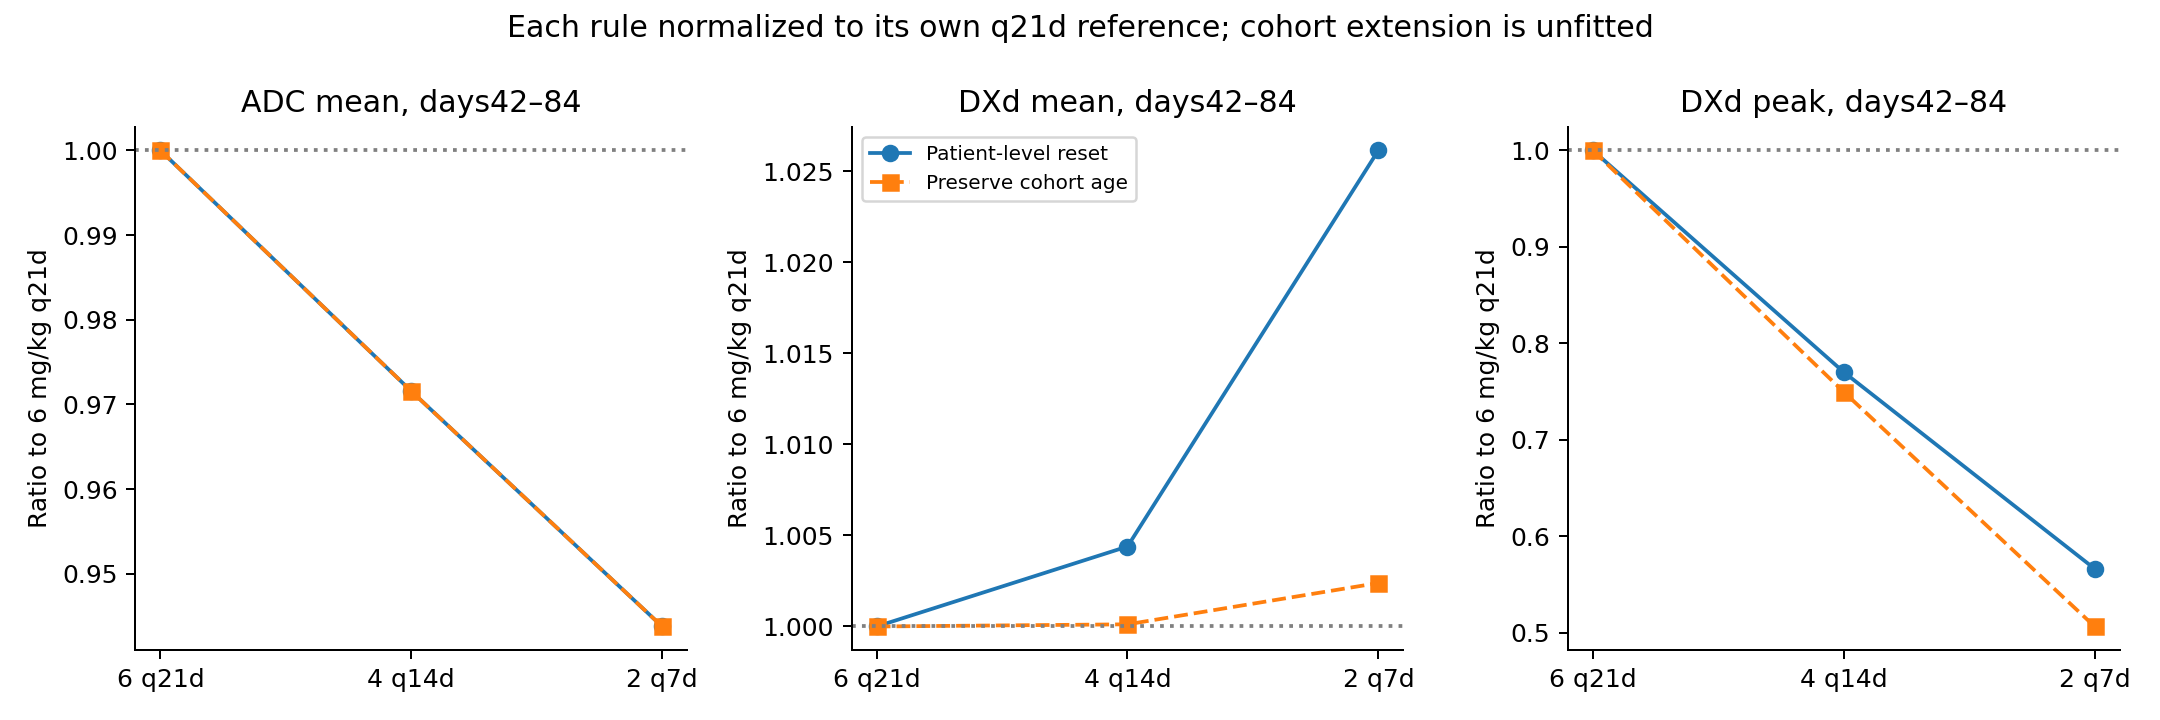
Figure 3. Alternative formation-clock assumptions. Each formulation is normalized to its own 21-day reference.
Table 8. Late-window DXd ratios under alternative clocks
| Schedule | DXd mean, published reset | DXd mean, dose-specific | DXd peak, published reset | DXd peak, dose-specific |
|---|---|---|---|---|
| 6 mg/kg q21d | 1.000 | 1.000 | 1.000 | 1.000 |
| 4 mg/kg q14d | 1.004 | 1.000 | 0.770 | 0.750 |
| 2 mg/kg q7d | 1.026 | 1.002 | 0.566 | 0.506 |
Reference 21-day DXd means are 0.7180 ng/mL for the published clock and 0.7162 ng/mL for the extension. Absolute predictions differ already at reference; the extension was not recalibrated. Ratios use each formulation's own reference.
Means stay near reference, while peak reductions change. Remaining-dose treatment therefore matters when transferring peak predictions to frequent dosing. These calculations cannot select the formulation closer to patient concentrations. Their difference is neither a patient predictive interval nor a biologically validated bound; peak reduction percentages are not toxicity-reduction percentages.
Numerical checks and parameter scenarios
Table 9. Verification results
| Check | Result |
|---|---|
| Solve equivalent hour/day equations | Maximum metric relative difference 6.3e-11 |
| Change integration precision and maximum step | Maximum metric relative difference 2.3e-10 |
| ADC and payload mass accounting | Maximum relative difference 3e-15 |
| Four weight/albumin-endpoint conditions in original Figure 4 | Maximum relative-effect discrepancies: ADC 0.51%, DXd 3.23% |
Original Figure 4 shows median predictions from parameters sampled using fixed-effect covariance, not exactly the same target as one fixed-effect calculation. Agreement checks implementation against published model results, rather than external validation with patient concentrations.
Ten structural/formation parameters were moved individually to published 90% CI bounds. Without simultaneous covariance-based variation, resulting ranges are not 90% predictive intervals.
Table 10. One-at-a-time sensitivity ranges under the published reset clock
| Schedule | ADC mean ratio, days 42–84 | DXd mean ratio, days 42–84 | DXd peak ratio, days 42–84 |
|---|---|---|---|
| 4 mg/kg q14d | 0.955–0.981 | 1.004–1.005 | 0.763–0.780 |
| 2 mg/kg q7d | 0.910–0.962 | 1.024–1.028 | 0.552–0.587 |
Uncertainty from alternative extrapolation rules is absent from these ranges. Nine weight/albumin combinations—45, 66 and 85 kg with 28, 38 and 45 g/L—were also saved in CSVs. They are not a virtual population reproducing the joint patient distribution. Independent variability distributions were not supplied to manufacture target-attainment or toxicity probabilities.
Discussion
The 2026 NSCLC analysis uses first-cycle AUC for OS, cycle-specific AUCτ for PFS and Cav for ORR. Safety endpoints variously use ADC AUC₁, ADC Cav or DXd Cav (2).
The days 42–84 mean differs from average exposure through the event's cycle. Changing interval also changes cycle length. Inserting AUCs covering different durations directly into E–R equations can mistake duration for exposure effects.
No reductions in stomatitis or preserved efficacy were calculated. Which adverse event and exposure metric, if any, corresponds to lower plasma DXd peaks requires separate evidence.
Conclusion
Equal-dose-intensity fractionation changed peaks and predose concentrations while leaving late-window means relatively close. ADC and DXd means did not move identically, and DXd peak changes depended on the formation term.
Applying a new-dose factor to residual ADC has not been validated under frequent dosing. These are extrapolations of published equations, not evidence of preserved efficacy or improved safety.
Data and code availability
Figures, calculation code and derived tables were independently created. Original text, figures, NONMEM source and patient data are not redistributed. The calculation code, tables and instructions document the independent implementation.
References
- Hong Y, Peigné S, Pan Υ, Friberg Hietala S, McLaughlin A, Tajima N, et al. Population Pharmacokinetic Analysis of Datopotamab Deruxtecan (Dato- DXd ), a TROP2 -Directed Antibody-Drug Conjugate, in Patients With Advanced Solid Tumors. CPT: Pharmacometrics & Systems Pharmacology. 2025;14(12):2149–2160. doi:10.1002/psp4.70118.
- Hong Y, Mc Laughlin AM, Pan Y, Hietala SF, Peigné S, Chargualaf M, et al. Exposure-Response Analyses of Datopotamab Deruxtecan (Dato- DXd ), a TROP2 -Directed Antibody-Drug Conjugate, in Advanced Non-small Cell Lung Cancer. Clinical Pharmacology & Therapeutics. 2026 [published online 2026 Sep 13]. doi:10.1002/cpt.70477.
- DailyMed. DATROWAY (datopotamab deruxtecan-dlnk): US prescribing information [Internet; cited 2026 Oct 18]. Prescribing information.