Can osimertinib plasma exposure establish tumor target inhibition?
A public osimertinib PBPK model separates plasma exposure, total tumor drug, and reversible binding, with absorption and partitioning sensitivity checks.
On this page
- Introduction
- Question and intended use
- Materials obtained and remaining limits
- Separate whole-body drug amounts from EGFR-bound states
- Compare 80 and 160 mg using the source absorption equations
- Does F=0.70 reduce the absorbed amount to 70%?
- Equal plasma exposure can coexist with different total tumor amounts
- Numerical verification
- Discussion
- Data and code availability
- References
Introduction
Sources were checked on October 19, 2026. I ported a public PBPK model to Python and calculated its outputs using previously estimated parameters. This is neither new patient-data estimation nor a treatment-dose proposal.
Under linear PK, doubling the dose doubles plasma exposure. Does it also double tumor exposure or target inhibition?
A published whole-body osimertinib PBPK model includes a lung tumor and EGFR binding (1, 2). It goes beyond a plasma-only model, but outputs named “tumor” or “binding” do not automatically represent clinical effects directly. I compared once-daily 80 and 160 mg to establish which differences are calculable and where their interpretation must stop.
Using the source code's absorption equations, increasing 80 to 160 mg doubled late plasma mean concentration, increased modeled total lung-tumor concentration 1.80-fold, and changed the fraction in the reversible binding state from 85.1% to 92.0%. These are not efficacy ratios or evidence favoring dose escalation.
Question and intended use
Table 1. Scope of the model comparison.
| Item | Definition |
|---|---|
| QOI | With the same public parameters, how do plasma, modeled lung-tumor drug amounts, and reversible EGFR binding change from 80 to 160 mg? How do absorption and tumor-partition assumptions affect interpretation? |
| COU | Examine implementation, output meanings, and assumptions requiring further validation when planning target-tissue exposure comparisons. Not intended for patient dose escalation, CNS treatment selection, or optimization of efficacy and safety. |
| Analysis | Conditional numerical calculations with fixed parameters. No new parameter estimation, interpatient-variability estimation, or virtual-population generation. |
The prescribing information lists 80 mg/day as the usual dose (3). The BLOOM study evaluated 160 mg/day in patients with leptomeningeal metastases. This lung-tumor comparison is neither a reanalysis of BLOOM nor evidence for CNS dose escalation (4). Drug-interaction dose adjustments are also outside the analysis.
Materials obtained and remaining limits
Table 2. Public materials used in the implementation.
| Material | Obtained and used | Not established here |
|---|---|---|
| 2025 paper (1) | Tumor volume, EGFR abundance, binding rates, and state definitions in original Table 1 | Re-estimation of original patients' efficacy or toxicity |
| Original Appendices S2–S5 | Tissue volumes, flows and composition, drug properties, partition equations, whole-body ODEs | Empirical validation of unbound tissue concentrations |
| Author-released code (2) | Parameters, partition coefficients, and ODE implementation at a fixed commit | Guaranteed agreement with every R/deSolve output |
| Prescribing information and clinical study (3, 4) | Distinction between clinical doses and the comparison conditions | Clinical superiority of 80 or 160 mg |
The source commit is 00c6410c000bcb3b32b7fa54f2cb3a2aed87dcbd. Original files and SHA256 hashes were retained. I did not reacquire individual PET or clinical PK data. The checks below establish consistency of equations, mass balance, and numerical calculations, not independent clinical validation against patients.
Separate whole-body drug amounts from EGFR-bound states
The model has 26 states: non-EGFR-bound amounts in 13 tissues, EGFR-bound amounts in 10 tissues, gut lumen, arterial blood, and venous blood. Eliminated and unabsorbed amounts are also accumulated for mass-balance checks. Time is in min, amounts in nmol, and volumes in L; nmol/L equals nM.
For a typical tissue, let \(A_i\) be its non-EGFR-bound amount, \(B_i\) its EGFR-bound amount, \(V_i\) tissue volume, \(V_{iw,i}\) intracellular-water volume, and \(R_i\) tissue EGFR concentration. The source exchange and binding equations can be written as
\[ C_{out,i}=\frac{A_i}{V_i}\frac{bp}{K_{p,i}} \]
\[ U_i=k_{on,i} A_i\frac{\max(R_iV_i-B_i,0)}{V_{iw,i}}-k_{off,i}B_i \]
\[ \dot A_i=Q_i(C_{in,i}-C_{out,i})-U_i-E_i, \qquad \dot B_i=U_i \]
The liver receives input from gut, spleen, and hepatic artery; elimination occurs in kidney and liver. I retained the source structure in which lung and lung tumor receive venous input. The distributed code contains all tissue equations.
Because \(bp\) is the blood/plasma ratio, venous plasma concentration is \(C_{plasma}=A_{ven}/(V_{ven}bp)\). Tissue/plasma \(K_p\) must not be confused with a tissue/blood coefficient.
Table 3. Representative source parameters.
| Parameter | Value | Interpretation |
|---|---|---|
| Molecular weight | 500 g/mol | Source rounding used for mg-to-nmol conversion |
| Plasma unbound fraction \(f_u\) | 0.0535 | Not the tissue unbound fraction |
| Blood/plasma ratio \(bp\) | 1/1.30 | Conversion to plasma concentration |
| Absorption rate \(k_a\) | 0.24/60 min⁻¹ | Source value |
| Absorption coefficient \(F\) | 0.70 | Its placement in the equations is compared below |
| Calculated tumor Kp | 1.6014 | Calculated with source partition equations |
| Lung-tumor volume | 0.046 L | Fixed source assumption |
| Tumor EGFR concentration | 382.65 nM | Not an individual measurement |
| Tumor \(k_{on},k_{off}\) | 0.18 nM⁻¹min⁻¹, 86.1 min⁻¹ | Source averages WT and L858R/T790M-mutant rates |
| Intrinsic hepatic CL, renal CL | Approximately 3.631, 0.235/60 L/min | Calculated using source expressions |
The \(K_p\) calculation includes intracellular and extracellular water, lipids, acidic phospholipids, and lysosomal trapping. I preserved source values and usage of quantities such as LogP, rather than automatically substituting a different physicochemical definition. Following the implementation does not establish every physiological assumption as validated.
Non-EGFR-bound does not mean unbound
I distinguish three tumor outputs:
\[ C_{tumor,nonEGFR}=A_{tumor}/V_{tumor} \]
\[ C_{tumor,total}=(A_{tumor}+B_{tumor})/V_{tumor} \]
\[ f_{bound}=B_{tumor}/(R_{tumor}V_{tumor}) \]
\(A_{tumor}\) includes amounts reflecting tissue partitioning and nonspecific retention. I do not call this “unbound tumor concentration.” Likewise, \(f_{bound}\) is the fraction in a reversible binding state within the model. Only parent drug is tracked; active metabolites AZ5104 and AZ7550 are absent. Irreversible inhibition and target synthesis and degradation are not explicitly modeled, so this fraction is not interchangeable with true EGFR inhibition or efficacy.
The source averages binding rates for WT and L858R/T790M receptors. This does not generalize to other mutations such as exon 19 deletion, and generally differs from separately tracking two receptor types and averaging the resulting states. I preserved that approximation. Binding input also uses the effective ratio of non-EGFR-bound amount to intracellular-water volume; it does not directly track pharmacological intracellular free concentration.
Compare 80 and 160 mg using the source absorption equations
Dosing starts on day 0 and continues once daily for 28 days. Both conditions use the same 24-hour comparison window, days 27–28. The source clinical-PK event sequence includes a gap after the initial dose; I replaced that event sequence with daily administration rather than reproducing it.
Table 4. Outputs using the source absorption equations, averaged over days 27–28.
| Dose | Mean plasma, nM | Mean tumor non-EGFR-bound, nM | Mean tumor total, nM | Mean reversible binding fraction | Predose binding fraction |
|---|---|---|---|---|---|
| 80 mg/day | 742.6 | 1189.2 | 1515.0 | 85.1% | 82.9% |
| 160 mg/day | 1485.2 | 2378.5 | 2730.4 | 92.0% | 90.7% |
These are fixed-condition calculations in a common window, not patient observations, population means, or true target-inhibition fractions.
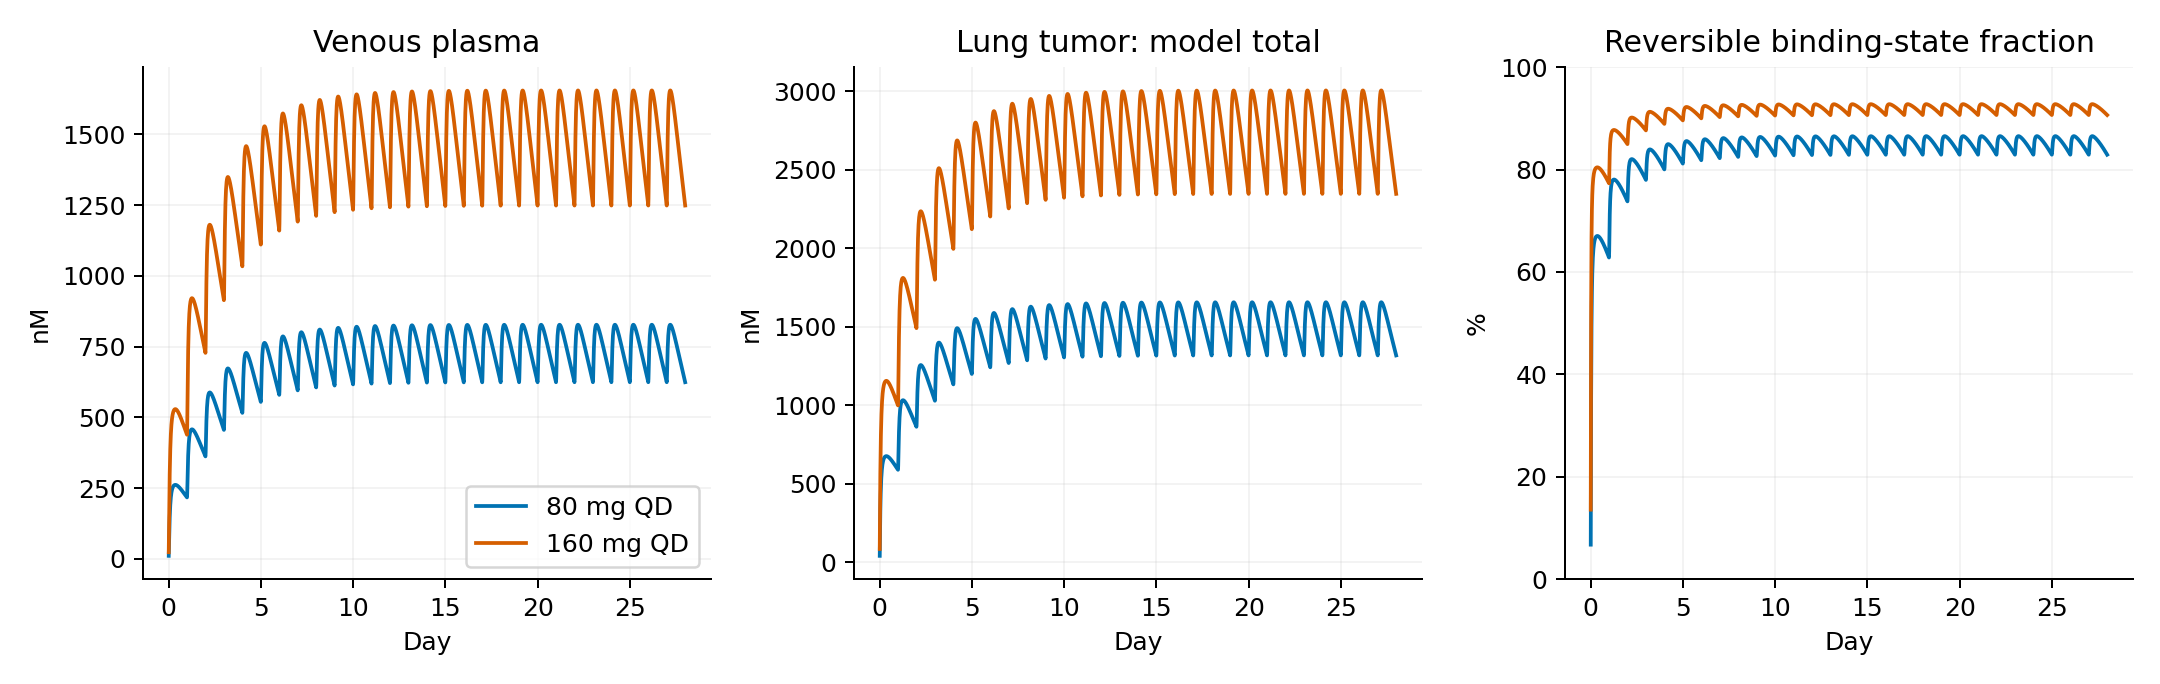
Figure 1. Time courses of plasma concentration, modeled total lung-tumor concentration, and reversible binding fraction using the source absorption equations.
The non-EGFR-bound amount approximately doubled, whereas total concentration increased by 80.2%. The difference in mean binding fraction, calculated before rounding, was 6.8 percentage points; binding did not double.
Saturable binding contributes to this difference. Non-EGFR-bound amounts rise almost proportionally with dose, but binding capacity is limited to \(R_{tumor}V_{tumor}\). Total tumor amount can therefore increase less than plasma concentration. This does not establish that efficacy saturates at 160 mg.
Does F=0.70 reduce the absorbed amount to 70%?
The public code applies the same \(F\) to both gut-lumen loss and input into the gut tissue:
\[ \dot A_{lumen}=-k_aFA_{lumen},\qquad R_{gut,in}=k_aFA_{lumen} \]
Given sufficient time, all drug leaving the lumen enters the gut compartment. At this point in the equations, \(F\) changes the absorption rate; it does not remove 30% of the dose as unabsorbed drug. Hepatic first-pass elimination remains elsewhere in the model, so this does not imply 100% systemic bioavailability.
As a control, I separated lumen loss from gut input:
\[ \dot A_{lumen}=-k_aA_{lumen},\qquad R_{gut,in}=Fk_aA_{lumen},\qquad R_{loss}=(1-F)k_aA_{lumen} \]
This is an unvalidated modification. It has not been refitted to clinical data and is not claimed to correct or improve the source model. All other parameters remain fixed to isolate the consequences of placing \(F\) differently.
Table 5. Outputs after the unvalidated separation of absorbed and unabsorbed amounts.
| Dose | Mean plasma, nM | Mean tumor non-EGFR-bound, nM | Mean tumor total, nM | Mean reversible binding fraction | Predose binding fraction |
|---|---|---|---|---|---|
| 80 mg/day | 519.8 | 832.5 | 1138.6 | 80.0% | 76.7% |
| 160 mg/day | 1039.7 | 1664.9 | 2005.0 | 88.9% | 86.8% |
This control uses identical remaining parameters. It is not presented as more accurate than the original paper.
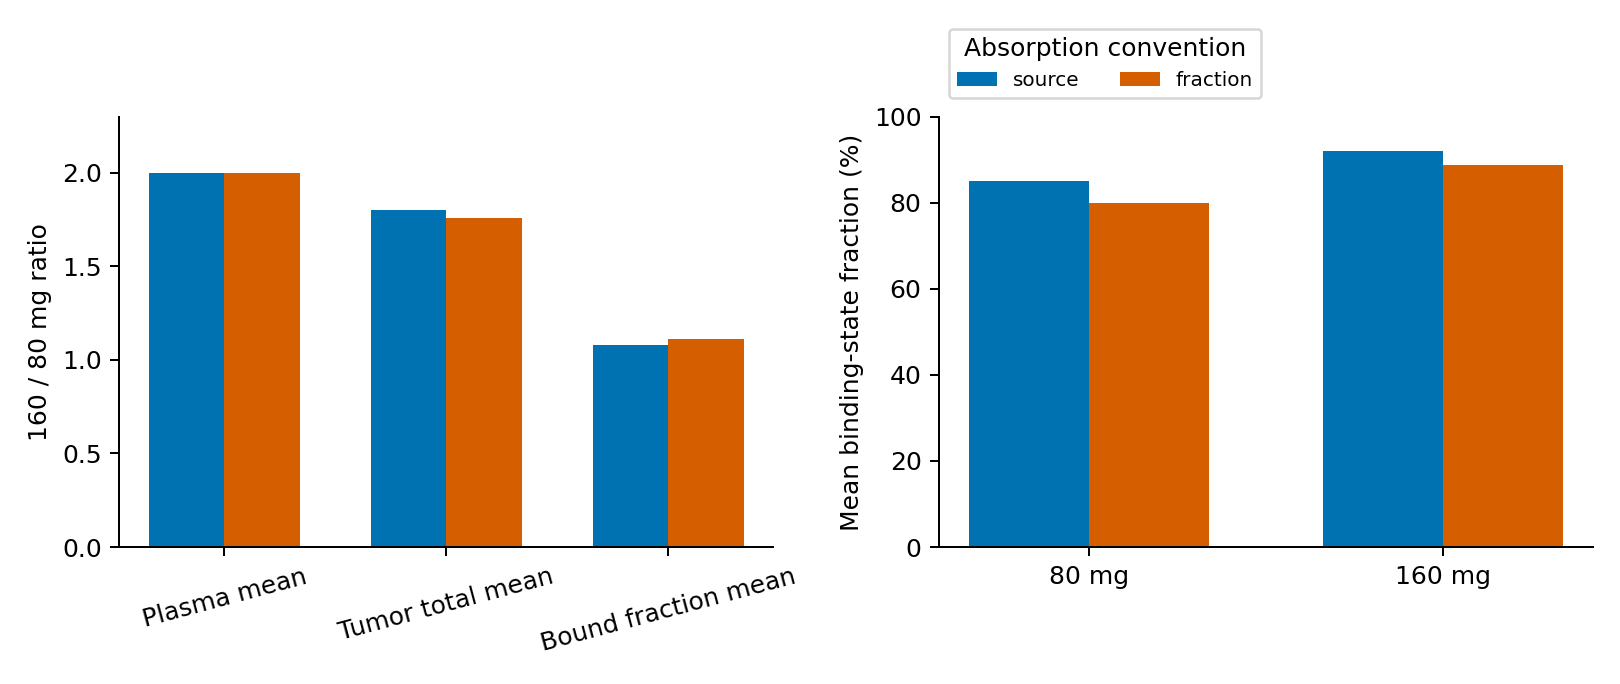
Figure 2. Ratios for 160 versus 80 mg and absolute reversible binding fractions under two absorption interpretations. “source” denotes the original implementation; “fraction” denotes the unvalidated modification.
At 80 mg, mean plasma concentration changed from 742.6 to 519.8 nM and mean binding fraction from 85.1% to 80.0%. The latter calculation tracked 30.00% of total administered dose as unabsorbed by day 28.
The same coefficient can produce different answers depending on what it controls in the equations. Absolute binding thresholds cannot be interpreted without resolving this distinction.
Equal plasma exposure can coexist with different total tumor amounts
I separately changed tumor \(K_p\), blood flow, and EGFR abundance to 0.5 and 2 times their reference values. These are neither patient distributions nor published confidence intervals. Here Kp governs partitioning between non-EGFR-bound tissue amount and total plasma concentration; its sensitivity is not a change in unbound Kpuu. Body weight and other tissues remain fixed. Opposite changes in lung blood flow preserve total cardiac output when tumor flow changes.
Table 6. One-at-a-time tumor sensitivities at 80 mg using source absorption.
| Change | Mean plasma ratio | Mean tumor-total ratio | Mean binding fraction |
|---|---|---|---|
| Tumor Kp ×0.5 | 1.000000 | 0.580 | 74.1% |
| Tumor Kp ×2.0 | 1.000000 | 1.802 | 92.0% |
| Tumor blood flow ×0.5 | 1.000000 | 1.000 | 85.1% |
| Tumor blood flow ×2.0 | 1.000000 | 1.000 | 85.1% |
| Tumor EGFR abundance ×0.5 | 1.000000 | 0.892 | 85.1% |
| Tumor EGFR abundance ×2.0 | 1.000000 | 1.215 | 85.1% |
Ratios describe conditional changes relative to the same 80 mg reference. Tiny differences around 1 should not be interpreted as meaningful individual variation.
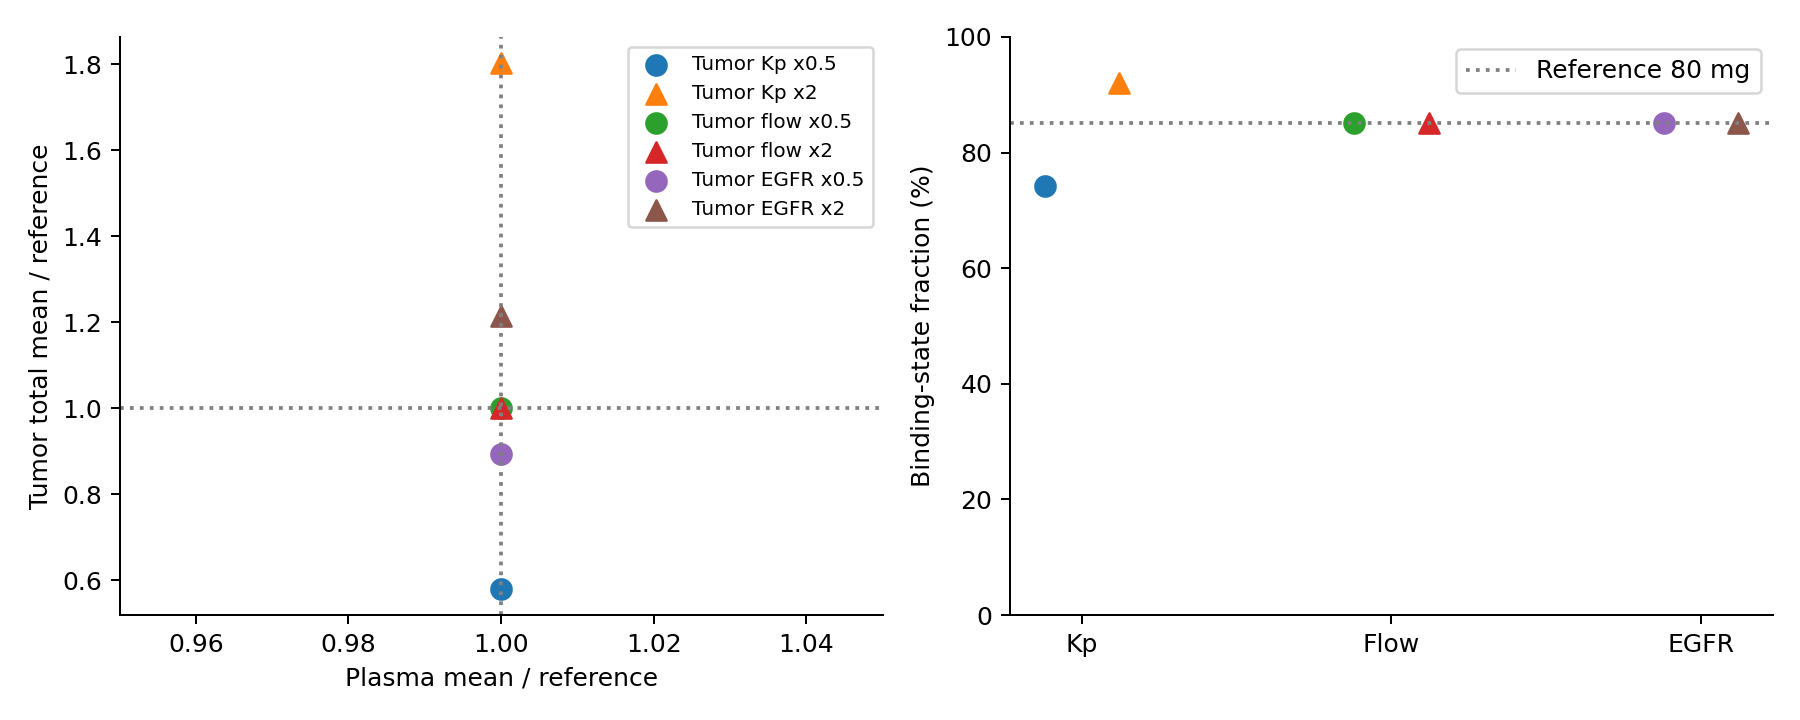
Figure 3. One-at-a-time changes at 80 mg. Left: plasma and tumor-total ratios to reference; right: reversible binding fraction. Circles indicate 0.5-fold and triangles twofold changes. The left horizontal range is 0.95–1.05. Plasma means remain approximately 1, without visually distinguishing negligible numerical differences.
Changing \(K_p\) alters tumor concentration and binding fraction. Increasing EGFR abundance raises total concentration while leaving the fraction bound almost unchanged. More drug in a tumor differs from a larger proportion of targets in the bound state.
When tissue and bound amounts have nearly zero net change over a steady-state cycle, and the tumor has no elimination,
\[ 0\simeq Q_{tumor}\{\overline C_{ven,blood} -\overline C_{tumor,nonEGFR}\,bp/K_{p,tumor}\} \]
so \(\overline C_{tumor,nonEGFR}\simeq K_{p,tumor}\overline C_{plasma}\). This structure explains the near-invariance of late mean concentrations to flow. It does not show that perfusion is unimportant in actual poorly perfused tumors. Early delivery, permeability limitation, transporters, necrosis, and intratumoral heterogeneity require separate evaluation.
Numerical verification
Table 7. Numerical checks and their results.
| Check | Result |
|---|---|
| Change integrator and tolerances | Maximum relative difference in principal means: 7.9e-08 |
| Final 24 hours at day 28 versus day 56 | Maximum relative difference in principal means: 4.5e-06 |
| Administered dose = body amount + eliminated amount + unabsorbed amount | Maximum relative error: 7.3e-15 |
| Seven unit tests | Mass balance, binding bounds, Jacobian, dose proportionality without binding, absorption loss, and source parameters passed |
Integration is segmented at daily dosing events, carrying predose amounts into the next integration. BDF and an analytical Jacobian handle stiff binding rates; Radau with tighter tolerances provides a comparison. Extending the horizon to 56 days also checks stability. Numerical stability is not clinical validity.
Outputs come from analysis/run_analysis.py; tables are outputs/tables/exposure.csv and sensitivity.csv; verification results are in outputs/verification.json. There is no random sampling, and plotted curves do not represent population intervals.
Discussion
Plasma and total tumor amounts did not change by the same factor. Absolute binding fractions depended on the absorption interpretation, and the binding state itself did not represent irreversible inhibition.
Observed total PET signal, modeled drug amount, and irreversible target binding are different quantities. This analysis does not validate irreversible binding or target turnover and does not evaluate CNS penetration from a lung-tumor result.
The public PBPK calculation therefore cannot establish the clinical superiority of 80 or 160 mg. Conditions needed to translate concentration increases into occupancy or efficacy increases have not been established in this comparison.
Data and code availability
Figures and derived tables were generated from these calculations. Source attribution, modifications, and licenses accompany the code, parameters, tables, and rerun instructions. Original figures and patient data are not redistributed.
References
- van der Gaag S, Jordens T, Yaqub M, Grijseels R, van Valkengoed DW, de Langen EN, et al. Physiologically Based Pharmacokinetic Model of Tyrosine Kinase Inhibitors to Predict Target Site Penetration, with PET ‐Guided Verification. CPT: Pharmacometrics & Systems Pharmacology. 2025;14(5):918–928. doi:10.1002/psp4.70006.
- Bartelink I and contributors. Target-Site-PBPK-in-oncology. Source code, commit 00c6410c000bcb3b32b7fa54f2cb3a2aed87dcbd. Repository. Apache License 2.0.
- TAGRISSO (osimertinib): US prescribing information. DailyMed. Accessed 2026 Oct 19.
- Yang JCH, Kim SW, Kim DW, Lee JS, Cho BC, Ahn JS, et al. Osimertinib in Patients With Epidermal Growth Factor Receptor Mutation–Positive Non–Small-Cell Lung Cancer and Leptomeningeal Metastases: The BLOOM Study. Journal of Clinical Oncology. 2020;38(6):538–547. doi:10.1200/JCO.19.00457.