When shrinking totals hide growing lesions: an audit of public CT data
On this page
Abstract
Two-timepoint lesion volumes from a public melanoma CT dataset were used to examine heterogeneity concealed by patient-level aggregation. Among 276 patients with 2,425 eligible matched lesions, 58 patients (21.0%; 95% patient-bootstrap interval, 16.3–25.7%) had decreasing summed volume but at least one lesion growing by more than 20%. Frequencies depended on lesion selection. Within-patient organ contrasts remained uncertain. These descriptive results neither estimate causal drug sensitivity nor classify clinical progression.
Introduction
Summing tumor volumes within a patient produces a convenient comparison metric. A decreasing total, however, does not imply that every lesion shrinks. A large shrinking lesion can conceal growth in a smaller one.
This property was examined using public two-timepoint CT data for metastatic melanoma. In the primary analysis of 276 patients and 2,425 lesions, 58 patients, or 21.0%, had decreasing total volume among matched existing lesions but at least one lesion growing by more than 20%. The 95% patient-bootstrap interval was 16.3–25.7%.
This is not the proportion classified as having progressive disease. Eligible lesions had a reliable correspondence, positive volumes at both timepoints and a positive scan interval. New, disappearing and merging lesions were excluded from that total.
Methods
Question and data
The quantity of interest was how often a change in patient-level summed volume conceals lesions changing in the opposite direction. The context of use was research on lesion information worth retaining in future response models and the limitations of aggregate measures.
Longitudinal-CT v3 provides baseline and follow-up scans, lesion organs, volumes and correspondences for 300 patients. This analysis used supplied lesion and demographic CSVs, without resegmenting images. Drug names, treatment initiation, doses and dose changes are absent (1, 2).
The analysis therefore estimates neither causal organ-specific drug sensitivity nor PK/PD. Before examining numerical results, the scope was narrowed from longitudinal diameter-based response modeling to two-timepoint volumes supported by the public data. This was not preregistered.
Eligibility for aggregation
The 4,638 lesion-CSV rows are neither independent patients nor uniformly matched lesions.
Table 1. Lesion correspondence categories and primary-analysis handling
| Correspondence | Rows | Primary-analysis handling |
|---|---|---|
| Existing matched lesions (UNCHANGED) | 2,506 | Retain after checking correspondence certainty, volume and time |
| Disappearing | 1,407 | Count separately, without forcing into positive-volume log ratios |
| Newly appearing | 559 | Count separately because baseline volume is absent |
| Merging | 166 | Exclude to avoid double counting |
UNCHANGED is a correspondence-topology category, not a statement that lesion shape or size is unchanged. Correspondence was unclear in 135 rows and missing in four. One patient identifier could not be matched to demographics, and five patients had zero-day scan intervals. Identifiers and dates were not repaired by inference. Their 155 lesion rows were excluded from the primary analysis of changes over time. Exclusion reasons overlap and cannot simply be added.
The primary analysis retained 2,425 lesions in 276 patients; 247 patients had multiple lesions and 175 had lesions in multiple organs. The supplied demographic table had a median scan interval of 97 days and a maximum of 1,036 days, rather than a common treatment duration.
Results and analysis definitions
Summed volume and the largest lesion increase
For eligible lesion set \(J_i\) in patient \(i\), define
\[ R_i=\log\left(\frac{\sum_{j\in J_i}V_{ij,FU}}{\sum_{j\in J_i}V_{ij,BL}}\right),\qquad M_i=\max_{j\in J_i}\log(V_{ij,FU}/V_{ij,BL}) \]
Even if \(R_i<0\), \(M_i>0\) indicates that changes do not all point in the same direction within that patient.
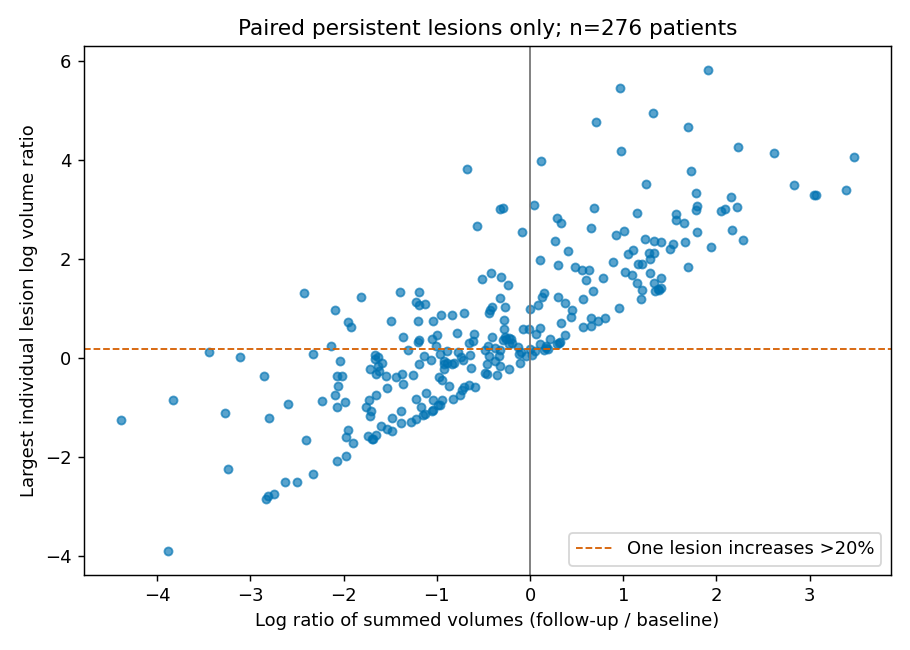
Figure 1. Aggregate and lesion-level change. Each point is one patient, using only reliably matched existing lesions. Both axes show log volume ratios: the largest individual lesion ratio vertically and the summed-volume ratio horizontally. Points left of zero and above the dashed line have a decreasing total but at least one lesion growing by more than 20%.
Table 2. Decreasing total volume with a lesion increasing beyond an exploratory threshold
| Exploratory lesion-growth threshold | Patients / primary-analysis patients | Proportion | 95% patient-bootstrap interval |
|---|---|---|---|
| Above 0% | 77/276 | 27.9% | 22.8–33.3% |
| Above 20% | 58/276 | 21.0% | 16.3–25.7% |
| Above 50% | 41/276 | 14.9% | 10.9–19.2% |
Every denominator is all 276 primary-analysis patients, rather than only those with a decreasing total. Summed volume decreased in 172 patients. Thresholds explore sensitivity to small measurement differences and are not clinical progression criteria. Resampling used 2,000 whole-patient bootstrap replicates; lesions were not treated as independent patients.
Dependence on lesion selection
Using growth above 20% gives the following results.
Table 3. Sensitivity to lesion and scan-interval selection
| Selection | Lesions | Patients | Qualifying patients | Proportion |
|---|---|---|---|---|
| Primary analysis | 2,425 | 276 | 58 | 21.0% |
| target_lesion only | 443 | 243 | 14 | 5.8% |
| Baseline volume at least 1,000 mm³ | 894 | 229 | 23 | 10.0% |
| Scan interval at most 120 days | 1,971 | 214 | 45 | 21.0% |
The lower frequency among target lesions does not show that patients improved. Examining fewer lesions also reduces opportunities to detect a maximum increase. Excluding small lesions can remove both measurement instability and genuine heterogeneity. These selections change denominators and lesion sets; they are not randomized interventions in the same population.
Within-patient organ contrasts
To prevent patients with many lesions from dominating, lesion log volume ratios were averaged within each patient–organ combination. A linear model included patient fixed effects and baseline volume, with lung as reference. It covered 137 patients with at least two of four selected organs and 331 patient–organ rows.
\[ \bar y_{io}=\alpha_i+\beta_o+\gamma\overline{\log V_{BL}}_{io}+\varepsilon_{io} \]
The scan interval is constant within a patient and absorbed by the patient fixed effect, so a separate interval coefficient was not added. This does not ignore between-patient interval differences, but organ-specific time dependence and treatment histories remain unidentified.
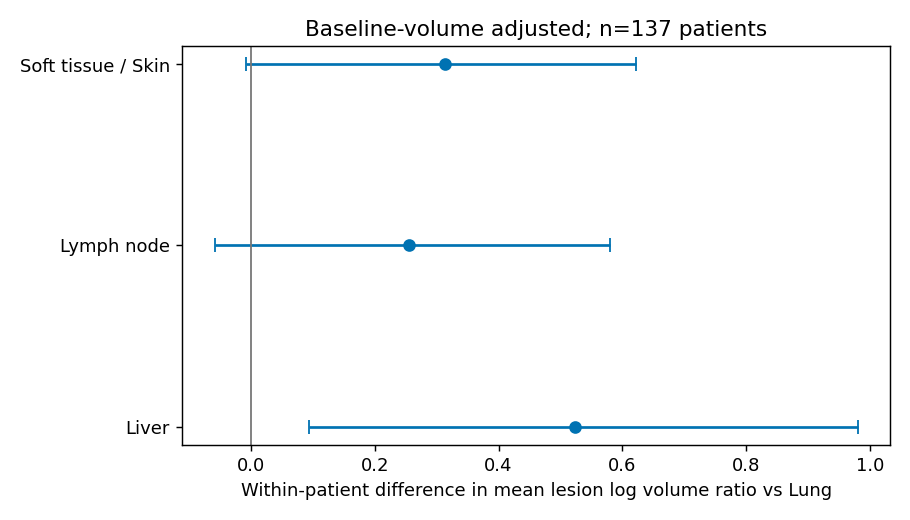
Figure 2. Within-patient mean lesion log-volume-ratio contrasts. Intervals are 95% intervals from 1,000 whole-patient bootstrap replicates. These are not drug-specific causal effects; unadjusted lesion characteristics and selection remain possible influences.
The liver–lung contrast was 0.523 (95% interval, 0.094–0.982). Lymph-node and soft-tissue/skin contrasts were 0.255 (−0.059–0.581) and 0.314 (−0.008–0.623), respectively, with substantial uncertainty. Multiple organs were explored without multiplicity adjustment. Across five sensitivity analyses omitting roughly one-fifth of patients at a time, liver point estimates ranged from 0.324 to 0.716 and some intervals included zero. These results do not establish an organ-sensitivity ranking.
Discussion
Changes were not uniform across lesions even when the matched-existing-lesion total decreased. The 21.0% frequency is not a treatment-failure rate. Total burden including disappearing and new lesions was not reconstructed. Converting volume to diameter would not create a RECIST assessment incorporating target, non-target and new lesions (3).
Drug, dose, treatment-start, local-treatment, outcome and reading-error information is also insufficient. Patient bootstrap resampling does not supply these missing variables, and two timepoints cannot separate shrinkage from regrowth rates. Conclusions from organ-specific longitudinal models using more detailed clinical-trial data cannot be transferred directly to this analysis (4).
Conclusion
Decreasing summed volume among reliably matched existing lesions can coexist with lesion growth. The observed frequency depends on the included lesion set. Patient-level aggregation therefore loses information about within-patient heterogeneity, while these two-timepoint data do not establish progression classifications or drug-specific organ sensitivity.
Verification and data availability
analysis/01_extract_metadata.py retrieves only CSVs from the supplied ZIP and checks uncompressed size and CRC32. analysis/02_analyze.py regenerates tables and figures. Checks covered source SHA256, patient–lesion keys, join row counts and model-matrix rank. The executed notebook is retained as reports/analysis.ipynb, with detailed outputs in outputs/tables/ in the analysis workspace.
The dataset's CC BY-NC conditions are retained. Original images and patient-level CSVs are not included in the article download. Figures and tables are original aggregate results calculated from the supplied numbers.
Distributed code
The ZIP of analysis functions and unit checks excludes source data and full-analysis reproduction materials. Constructed test cases check implementation rather than clinical-data validity.
References
- Küstner T, Peisen F, Gatidis S, Wagner A, Megne O, Othman A, et al. Longitudinal-CT [Dataset]. Version 3. FDAT Repository; 2026 Sep 18. Versioned dataset. doi:10.57754/FDAT.qe950-g4h94.
- Gatidis S, Peisen F, Wagner A, Choudja POM, Othman A, Sanner A, et al. A longitudinal whole-body CT dataset with manually annotated tumor lesions. Scientific Data. 2026;13(1):1139. doi:10.1038/s41597-026-07466-y.
- Eisenhauer EA, Therasse P, Bogaerts J, Schwartz LH, Sargent D, Ford R, et al. New response evaluation criteria in solid tumours: Revised RECIST guideline (version 1.1). European Journal of Cancer. 2009;45(2):228–247. doi:10.1016/j.ejca.2008.10.026.
- Zhou J, Cipriani A, Liu Y, Fang G, Li Q, Cao Y. Mapping lesion-specific response and progression dynamics and inter-organ variability in metastatic colorectal cancer. Nature Communications. 2023;14(1):417. doi:10.1038/s41467-023-36121-y.