When patients stop being measured: how much does dropout change a tumor-shrinkage estimate?
Most tumor-scan dropout was death. A mixed model removed most of the survivor bias in 48-week shrinkage; a joint model and delta adjustment showed the 24-week arm difference was robust but the 48-week difference was fragile.
Key findings
- In a public colorectal-cancer subset where most scan dropout was death, the mean of patients still scanned overstated 48-week shrinkage by about a third in the combination arm; a mixed-effects model removed most of that bias.
- The 24-week shrinkage and arm difference held under every dropout assumption tried, including a joint model and delta adjustments.
- The 48-week arm difference lost support if dropouts in the better-looking arm deteriorated about 0.5 per year faster than predicted; without recorded dropout reasons, the mechanism is not identified.
On this page
In a public subset of a colorectal-cancer trial, most patients stopped having tumor scans because they were dying, and those close to death were the ones whose tumors were growing. Ignoring that, the mean of patients still measured overstated shrinkage at 48 weeks. A standard mixed-effects model removed most of the bias, and a joint model linking death to tumor size reduced the 48-week shrinkage only a little further. The difference between the two arms at 24 weeks was robust to every assumption tried. The 48-week difference was not: it lost support as soon as dropouts in the better-looking arm were assumed to deteriorate modestly faster than the model predicts.
日本語要約:脱落の大半が死亡で、死亡が近い人ほど腫瘍が大きくなっていた公開臨床試験データで、腫瘍縮小の推定が脱落の扱いでどれだけ変わるかを調べた。計測が続いている人の平均は48週の縮小を過大に示し、通常の混合効果モデルがその多くを補正した。死亡を腫瘍の値に結ぶ joint model はさらに少し縮小を小さくした。24週の群間差はすべての仮定で保たれたが、48週の群間差は、見かけの良い群の脱落者が予測より年0.5だけ悪化すると仮定しただけで支持を失った。脱落の理由は記録されておらず、どの仮定が正しいかは決められない。
The question
Tumor-growth-inhibition (TGI) summaries, such as the mean change in tumor size at a fixed week, are estimated from patients who are still being scanned. In advanced cancer, scans stop mainly because patients progress, deteriorate or die, so the patients who remain are not a random sample. How much does the estimated shrinkage, and the difference between treatment arms, depend on what is assumed about the patients who are no longer measured?
The context of use is a research decision: whether a TGI summary from such data can be taken at face value, and if not, at which time points and under which conditions it should not be trusted. The quantity a mixed-effects model estimates here is hypothetical, in the ICH E9(R1) sense: the mean trajectory had every patient remained alive and measured. Tumor size after death does not exist, so this quantity rests on assumptions about unobserved values. The analysis shows how strongly it depends on them; it does not decide which estimand is right.
Data and what they allow
The colorectal and colorectalLongi datasets in CRAN frailtypack 3.8.1 contain a random subset of 150 of the 410 participants of FFCD 2000–05, a randomized trial of sequential chemotherapy (fluorouracil first, then FOLFOX6, then FOLFIRI) versus upfront combination (FOLFOX6, then FOLFIRI). Tumor size is the sum of lesion diameters after a Box–Cox transform (λ = 0.3); negative changes mean shrinkage on that scale. One participant has a measurement after death and was excluded, leaving 149 patients, 900 measurements and 120 deaths. Earlier analyses of the same subset looked at early tumor change and survival and kinetic models at a landmark.
No dropout reason is recorded. The data contain death or censoring times and the times of new lesions, nothing about why scans stopped. The audit showed:
- Median time from the last scan to death was 12 weeks.
- Among patients who died within six months of their last scan, the tumor was growing over the last interval (median +1.1 per year on the transformed scale), compared with no change in the others. The distributions overlap widely.
- The sequential arm lost patients earlier: at 24 weeks, 57 of 77 were still scanned versus 65 of 73 with combination.
- Scans continued after new lesions in 60 patients, so the trajectories describe the whole treatment strategy, not first-line therapy alone.
Because reasons are missing, the dropout mechanism cannot be estimated. The plan, fixed before any model was fitted, was therefore restricted to two ways of varying the assumption: a joint model in which the risk of death depends on the current tumor size, and a delta-adjustment sensitivity analysis.
Three ways to estimate the trajectory
- Mean of patients still measured. Descriptive; it ignores dropout entirely.
- Mixed-effects model (MAR). A linear mixed model with a piecewise-linear time course (change of slope at 24 weeks), arm-specific slopes and correlated random intercept and slopes (
nlme, maximum likelihood). It assumes dropout depends only on observed data. Intervals come from 1,000 patient-level bootstrap refits. - Joint model. The same longitudinal model linked to a Cox model for death (arm, WHO status, previous resection, age group), with the hazard depending on the current tumor value (
JMbayes2, three chains of 12,000 iterations, all R̂ < 1.05). A second version added the current slope (24,000 iterations were needed for convergence).
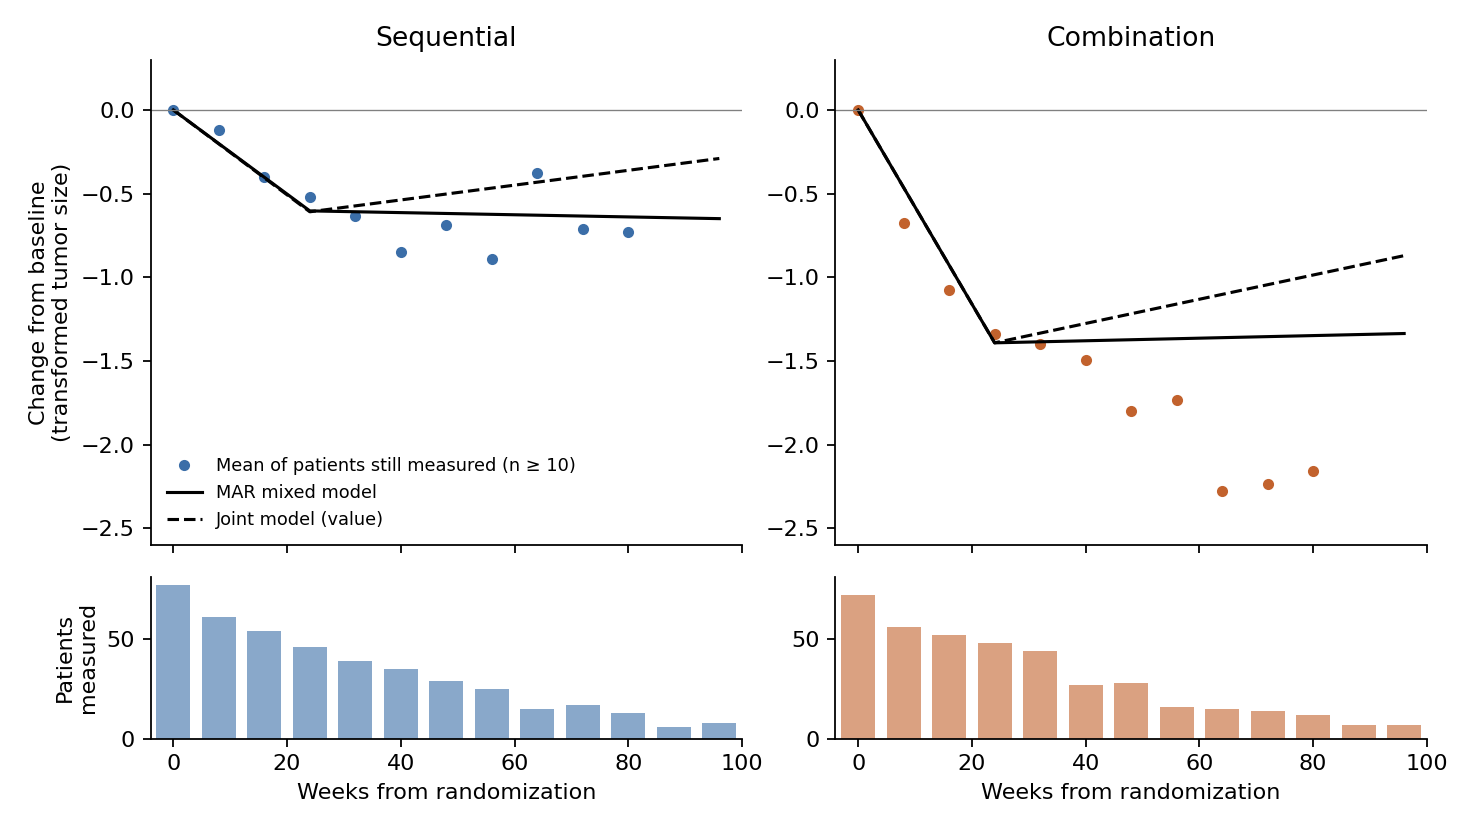
| Change from baseline | Still measured (n) | MAR mixed model | Joint model |
|---|---|---|---|
| 24 weeks, sequential | −0.52 (46) | −0.60 (−0.83, −0.34) | −0.61 (−0.96, −0.26) |
| 24 weeks, combination | −1.34 (48) | −1.39 (−1.87, −1.02) | −1.39 (−1.73, −1.06) |
| 24 weeks, difference | −0.79 (−1.31, −0.35) | −0.78 (−1.25, −0.32) | |
| 48 weeks, sequential | −0.69 (29) | −0.62 (−1.09, −0.36) | −0.50 (−0.88, −0.13) |
| 48 weeks, combination | −1.80 (28) | −1.37 (−1.80, −0.95) | −1.22 (−1.59, −0.83) |
| 48 weeks, difference | −0.75 (−1.27, −0.04) | −0.72 (−1.24, −0.19) |
In the joint model, each unit of transformed tumor size multiplied the hazard of death by 1.37 (log-hazard 0.31, 95% credible interval 0.18 to 0.46). Adding the slope did not change anything (slope association −0.01, −0.23 to 0.22).
Three points stand out. The survivors' mean overstated shrinkage most where dropout was heaviest: −1.80 versus −1.37 in the combination arm at 48 weeks. The mixed model already removed most of that gap by extrapolating each dropout's own trajectory. The joint model moved the 48-week estimates by a further 0.12 (sequential) and 0.15 (combination) towards less shrinkage, and left 24 weeks essentially unchanged because most deaths came later. The pre-specified rule called the joint model's change material only if it exceeded half the width of the mixed model's interval; it did not, at either time point.
How much worse would unmeasured patients need to be?
The joint model is one specific assumption. The delta adjustment asks a more direct question: if every patient's unobserved trajectory after the last scan were worse than the mixed model predicts by δ per year, what would the estimates become? δ was fixed in advance at 0, 0.5, 1, 2 and 3 per year, bracketing the last-interval slopes seen before death.
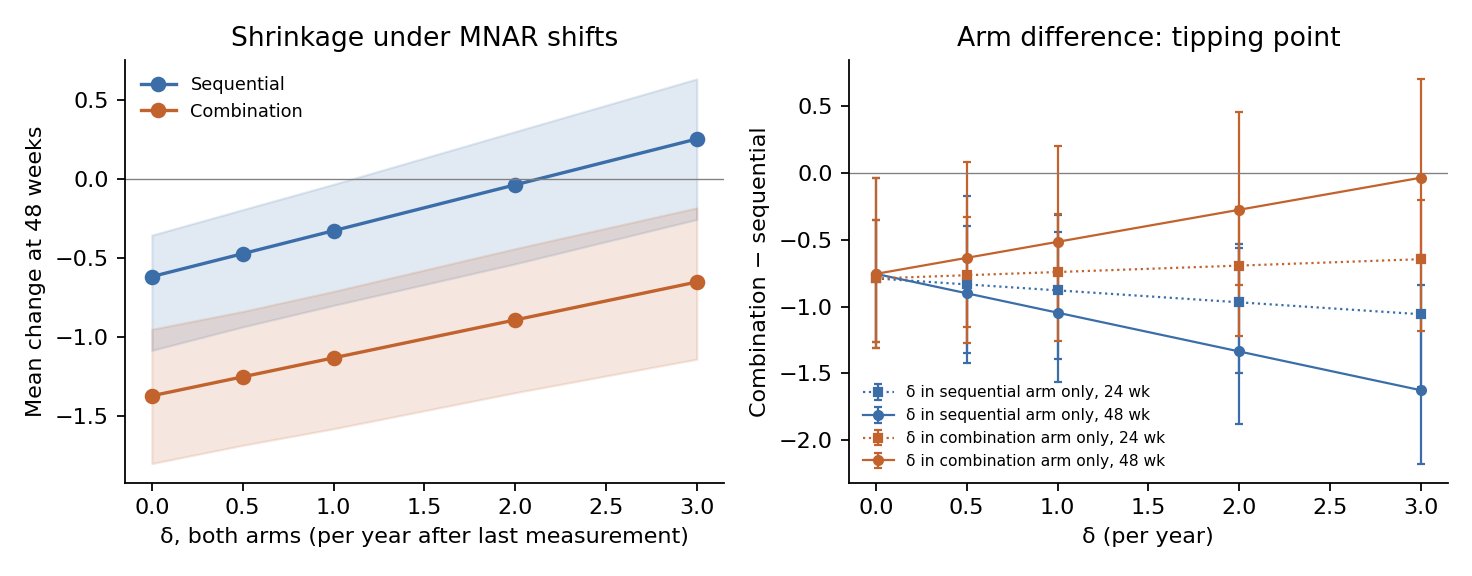
- Shrinkage within each arm. With the same δ in both arms, the sequential arm's 48-week shrinkage was no longer supported at δ = 2 (−0.04, −0.54 to +0.30). The combination arm's shrinkage persisted up to δ = 3 (−0.65, −1.14 to −0.18). The joint model's shift corresponds to δ of roughly 0.5 to 1.
- The arm difference at 24 weeks held in every scenario, including δ = 3 applied to the combination arm only (−0.64, −1.18 to −0.20).
- The arm difference at 48 weeks lost its support at δ = 0.5 applied to the combination arm only (−0.63, −1.15 to +0.08), and its point estimate was close to zero at δ = 3. Applying δ to both arms, or to the sequential arm, widened the difference instead, because the sequential arm loses patients earlier.
Two data choices pointed the same way. Excluding scans after the first new lesions, a common convention that ties dropout more closely to progression, left the 48-week difference from the mixed model with an interval that included zero (−0.62, −1.32 to +0.43). Excluding the 34 measurements at the transform's floor reduced shrinkage in both arms but left every conclusion unchanged.
Does the joint model recover a known truth?
Before relying on the joint model, it was checked on synthetic data with a known answer: 30 trials of 150 patients per scenario, with tumor trajectories and death times generated from the fitted joint model and the same 81% death fraction as the real data. The association between tumor size and death was set to zero (MAR true), to the estimate, or to twice the estimate. The plan required the joint model to beat the mixed model in the scenarios with an association, and both to be nearly unbiased (|bias| < 0.1) when MAR was true. Only replicates whose joint model converged (R̂ < 1.1; 20 to 23 of 30 per scenario, after a first run with shorter chains converged too rarely) are summarized; the mixed model is compared on the same replicates.
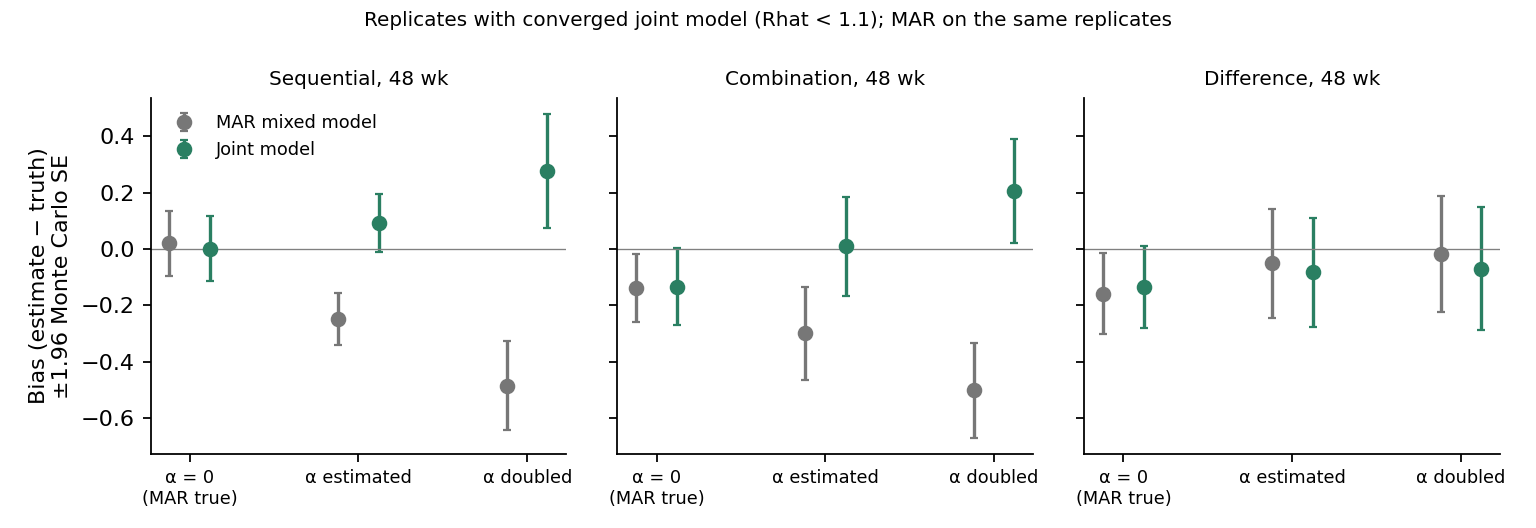
- Per-arm shrinkage. When death depended on tumor size, the mixed model overstated 48-week shrinkage by 0.25 to 0.30 at the estimated association and by about 0.5 at twice that. The joint model removed the bias when the association was specified correctly, but over-corrected by 0.2 to 0.3 when the true association was twice as strong as the one assumed in fitting.
- Arm difference. Neither model was materially biased in any scenario with an association (|bias| ≤ 0.09), and the joint model was not better than the mixed model. A dropout mechanism shared by both arms shifts both arm means and largely cancels in the difference.
- MAR true. At 48 weeks both models showed a bias of −0.13 to −0.16 in the combination arm and the difference, about two Monte Carlo standard errors. Thirty replicates cannot tell a small-sample effect from chance.
The joint model therefore failed two of the pre-specified criteria, and, as the plan required, it is not used as the main evidence. It remains one plausible scenario. The check also explains the pattern in the real data: a common mechanism mostly distorts each arm's shrinkage, while only an arm-specific mechanism moves the difference, which is what the one-arm delta adjustment probes.
What can and cannot be concluded
Supported: In this subset, the mean of patients still scanned should not be read as treatment-induced shrinkage after the first months; it overstated shrinkage at 48 weeks by about a third in the combination arm. Shrinkage at 24 weeks and the arm difference at 24 weeks were insensitive to every dropout assumption tried. Shrinkage in the combination arm at 48 weeks survived even large assumed deterioration.
Fragile: The 48-week arm difference. Its support disappears if patients who left the combination arm deteriorated by about 0.5 per year more than the model predicts, a size within the range observed before death. The trial itself is a reason to take that seriously: all six treatment-related deaths in the full trial occurred in the combination arm, so the reasons for leaving may well differ between arms.
Not supported: Any statement that dropout is ignorable, or that the joint model's small shift shows that dropout hardly matters; the joint model did not pass its synthetic-data check for the arm difference. Without recorded reasons, the dropout mechanism is not identified; the joint model and the delta adjustment are alternative assumptions. Nor does this analysis evaluate mechanistic TGI models, treatment benefit (the trial's primary endpoint was progression-free survival and showed no difference), physical tumor sizes, or other trials.
What would change the answer: recorded reasons for stopping assessment (progression, toxicity, death, withdrawal), scans continued after progression, tumor sizes on the original scale, and the full trial population. With reasons available, separate assumptions could be made for toxicity and progression dropouts instead of a single δ.
Reproduce
The companion contains the acquisition and export scripts, the analysis, simulation and validation code, aggregate result tables and figure code. It does not contain participant-level data: acquire.py downloads the source package from CRAN and checks its SHA-256, and export.R writes the two datasets locally. Run python acquire.py, Rscript export.R, python audit.py, Rscript analyze.R, Rscript simulate.R 1 (and 2, 3), Rscript simulate.R combine, Rscript validate.R and python figures.py (R 4.5.3 with nlme 3.1-168, survival 3.8-6, JMbayes2 0.6.0 and lme4 2.0-1; Python 3.12 with matplotlib). The mixed model was cross-checked against an independent implementation (lme4, fixed effects within 4 × 10⁻⁶), and the joint model against a second MCMC seed (posterior means within 0.005). The analysis outputs were byte-identical under R 4.5.1 with survival 3.8-3 and R 4.5.3 with survival 3.8-6.
Sources
- Rondeau V, et al. frailtypack: general frailty models. CRAN package version 3.8.1, datasets
colorectalandcolorectalLongi. https://cran.r-project.org/package=frailtypack - Ducreux M, et al. Sequential versus combination chemotherapy for the treatment of advanced colorectal cancer (FFCD 2000–05): an open-label, randomised, phase 3 trial. Lancet Oncol. 2011;12(11):1032–1044. doi:10.1016/S1470-2045(11)70199-1
- Rizopoulos D, Papageorgiou G, Miranda Afonso P. JMbayes2: extended joint models for longitudinal and time-to-event data. R package version 0.6.0. https://cran.r-project.org/package=JMbayes2
- ICH E9(R1). Addendum on estimands and sensitivity analysis in clinical trials to the guideline on statistical principles for clinical trials. 2019.
- Pinheiro J, Bates D, R Core Team. nlme: linear and nonlinear mixed effects models. R package version 3.1-168.
Download the companion: code, aggregate results and figure scripts