Does a tumor-kinetic model add anything to a single early tumor change?
At 16, 24 and 32 weeks, a mixed-effects tumor-kinetic estimate added no held-out survival discrimination beyond the observed one-point change, and carrying the last value forward predicted the next measurement best.
Key findings
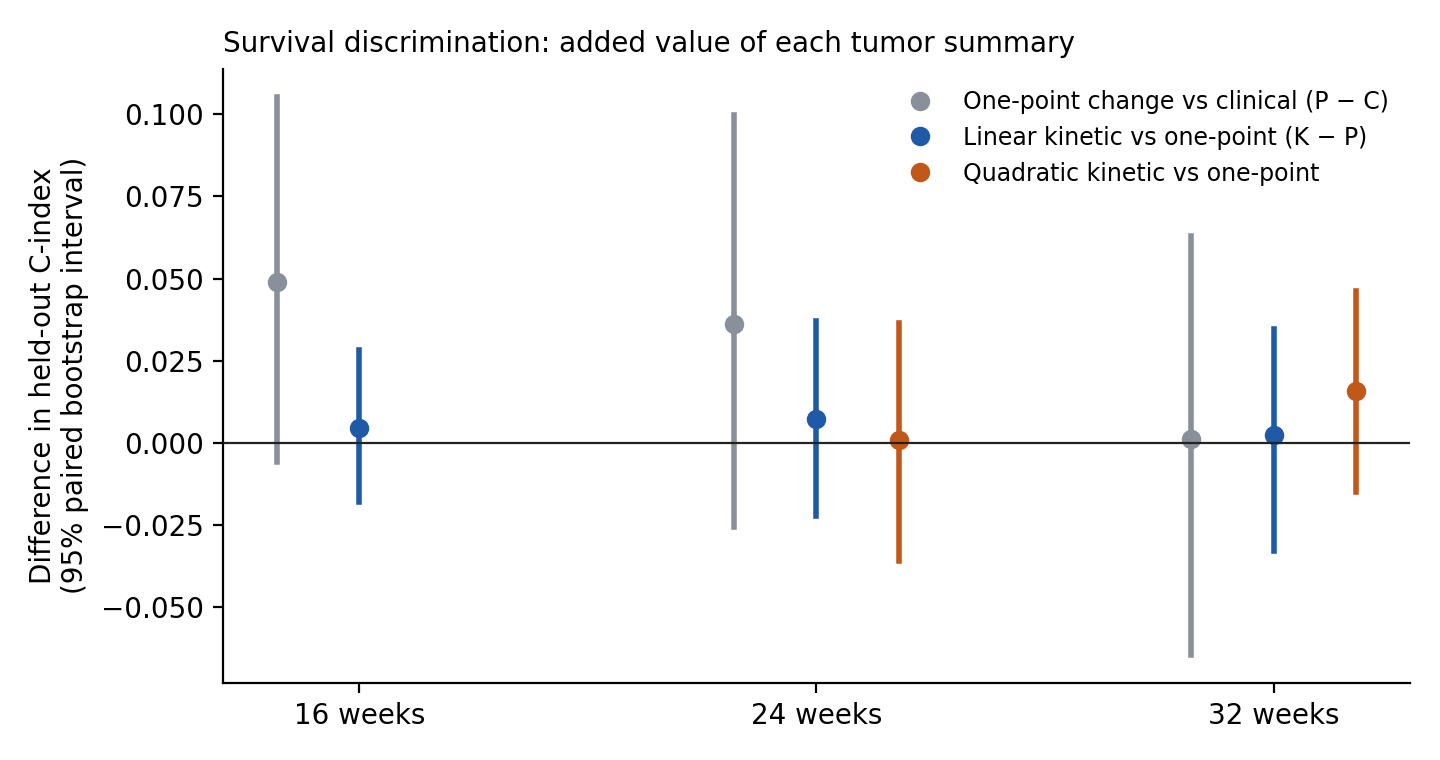
- At 16, 24 and 32 weeks, a mixed-effects tumor-kinetic estimate changed held-out survival C-index by only +0.002 to +0.016 over the observed one-point change, and every interval included zero.
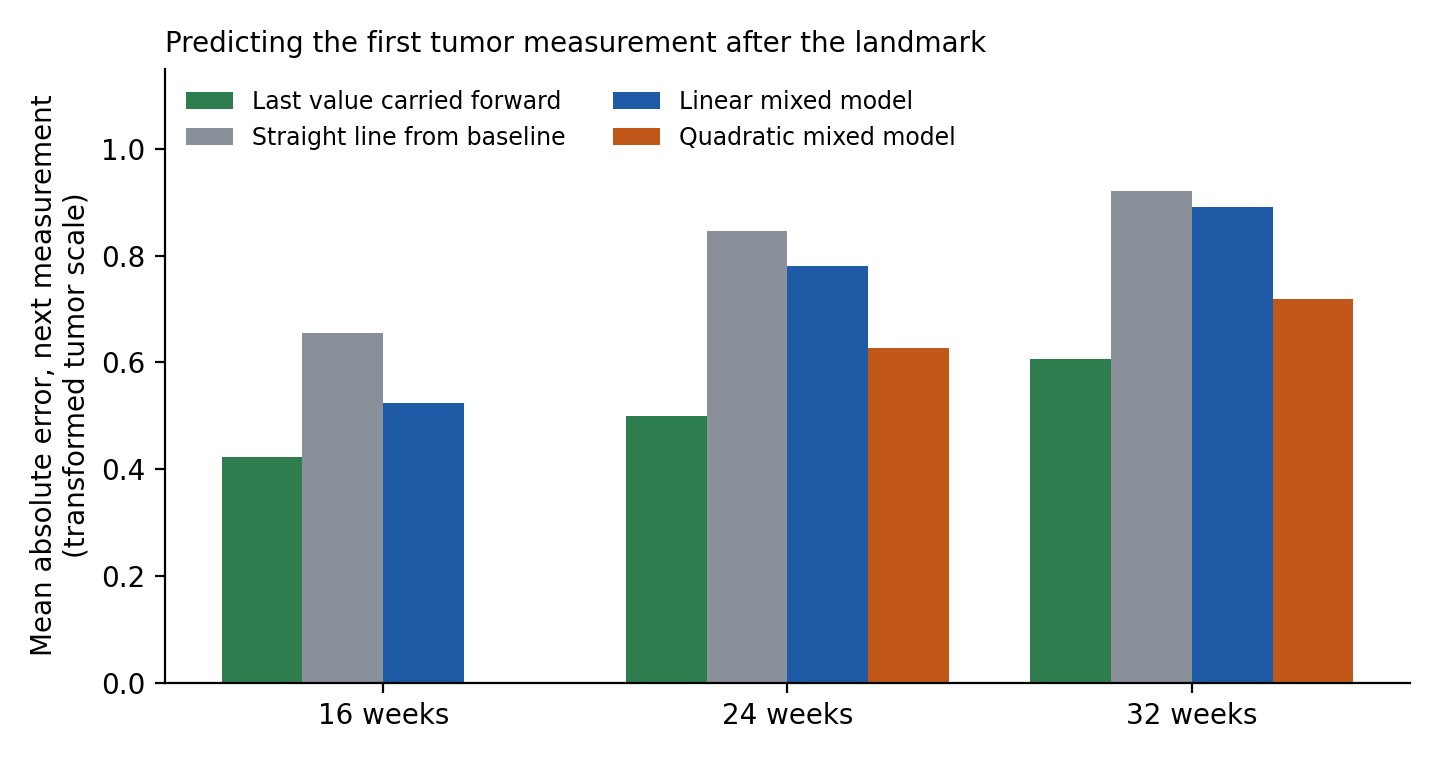
- For the next tumor measurement, carrying the last value forward was the most accurate rule at every landmark (MAE 0.42–0.61), beating both linear and quadratic mixed models.
- Kinetic terms correlated about 0.97 with the one-point change, so with this measurement density a simple change suffices; this is not an evaluation of mechanistic TGI models in general.
On this page
In a public subset of a colorectal-cancer trial, a mixed-effects model of each patient's tumor trajectory did not improve held-out prediction of survival beyond the observed change from baseline, at 16, 24 or 32 weeks. For the next tumor measurement, simply carrying the last value forward was the most accurate rule at every landmark. Within this dataset, early tumor assessment did not need a kinetic model.
日本語要約:同じランドマークの時点で、混合効果モデルによる個人の腫瘍動態が、観測した一点の変化に情報を加えるかを検証した。16・24・32週のいずれでも、その後の生存の識別はほぼ変わらず(C-indexの差 +0.002〜+0.016、区間はすべてゼロを含む)、次の腫瘍計測は「最後の値のまま」が最も当たった。このデータの解像度では、早期評価に動態モデルは要らない。機序的なTGIモデル一般の評価ではない。
The question
Tumor-growth-inhibition models are often proposed as a way to extract more information from early tumor measurements than a single percentage change. The question of interest here was narrower: at the same landmark, does an individual kinetic estimate from a population mixed-effects model add out-of-sample information about later overall survival, or about the next tumor measurement, beyond the observed one-point change?
The context of use is a research decision: whether early tumor assessment needs a kinetic model or whether a simple change suffices. It is not a surrogate-endpoint qualification, a treatment-effect analysis, or an individual prognosis tool. The fixed rule was to claim added value at a landmark only if the survival C-index improvement over the one-point model had a 95% interval above zero and the kinetic model predicted the next measurement better than both simple rules.
Data and what they allow
The colorectal and colorectalLongi datasets in CRAN frailtypack 3.8.1 contain a random subset of 150 participants from the FFCD 2000–05 trial of sequential versus combination chemotherapy for metastatic colorectal cancer: 906 tumor measurements, 121 deaths. Tumor size is the sum of lesion diameters after a Box–Cox transform (λ = 0.3); 34 measurements sit at a censoring floor. One participant has a measurement recorded after death and was excluded, as in the earlier landmark analysis of the same data.
That earlier analysis compared clinical factors with the observed early change at 16 weeks and noted that sparse sampling did not justify individual growth modeling. The audit for this article quantified the point:
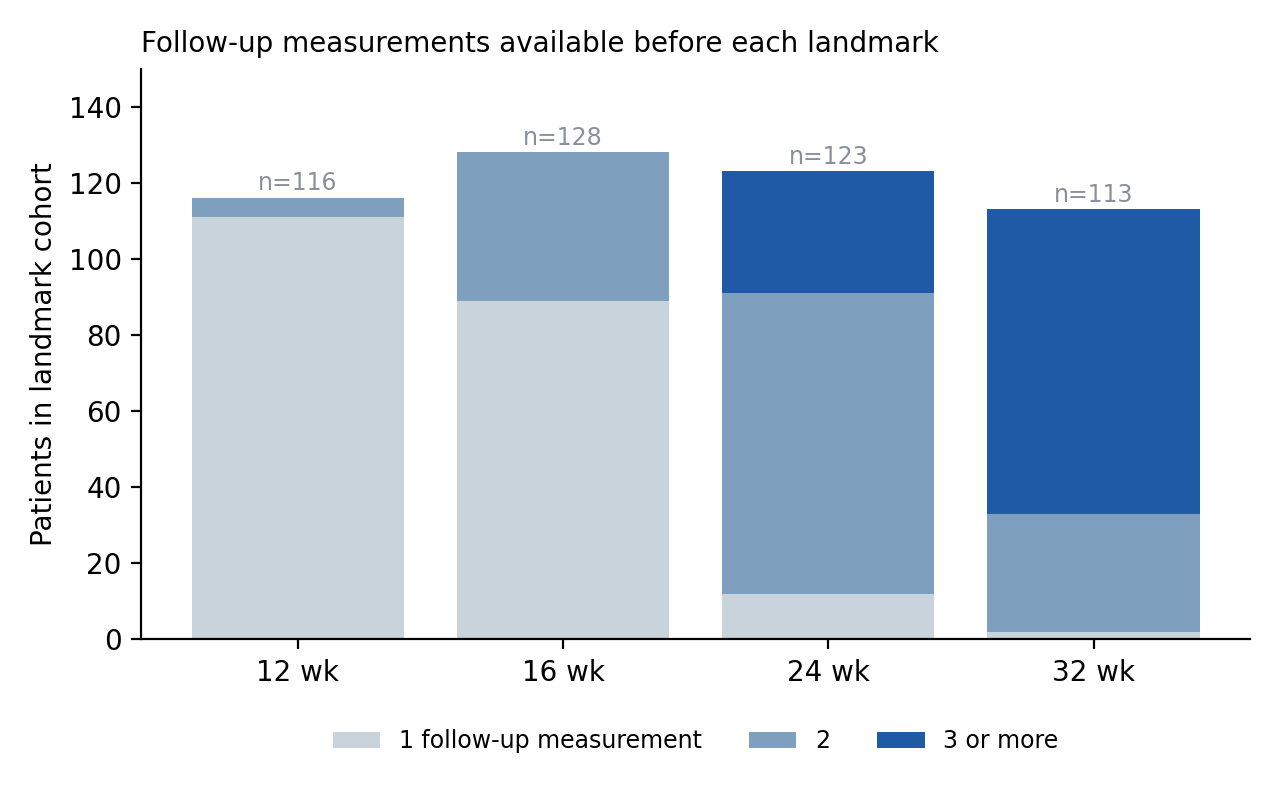
At 16 weeks, 89 of 128 patients have a single follow-up measurement; with one point after baseline, a patient's slope is the one-point change divided by time. Individual kinetics only become estimable at 24 weeks (111 of 123 with two or more) and 32 weeks (111 of 113). The primary comparisons are therefore at 24 and 32 weeks, with 16 weeks reported for continuity.
Three models with the same number of tumor terms
All models are Cox models for survival from the landmark, fitted to the same patients and folds.
| Model | Predictors |
|---|---|
| C: clinical | Treatment arm, age group, WHO status ≥1, previous resection, baseline tumor value |
| P: one-point | C + last value before the landmark minus baseline, and the time of that value |
| K: kinetic | C + the model-predicted value at the landmark minus baseline, and the individual slope |
P and K each add two terms to C, so the comparison concerns the information in the terms rather than their number.
The kinetic model is a linear mixed-effects model on the transformed scale with a random intercept and slope (nlme, REML), fitted only to measurements up to the landmark. Population parameters are estimated in the training fold; each held-out patient's individual effects are best linear unbiased predictions computed with those fixed parameters. No measurement after the landmark enters any predictor. A quadratic time term was added only if, by a pre-specified rule, it was both statistically supported and reduced next-measurement error by at least 5%. That rule was met at 24 and 32 weeks, so the quadratic model is reported as an additional comparison. Mechanistic TGI models (Claret- or Stein-type) were not fitted: they need sizes on the original scale, and the floor values and point counts make back-transformed fits unstable.
Validation repeated a death-stratified five-fold split ten times with a fixed seed, averaged each patient's held-out predictions, and formed paired bootstrap intervals over patients. These intervals are conditional on the fitted models and do not include refitting uncertainty. The 16-week clinical and one-point C-indices (0.532 and 0.581) reproduce the earlier analysis exactly, and an independent re-implementation of all primary metrics agreed to within 5 × 10⁻⁹.
Survival: no added discrimination
| Landmark | One-point vs clinical (P − C) | Linear kinetic vs one-point (K − P) | Quadratic kinetic vs one-point |
|---|---|---|---|
| 16 weeks | +0.049 (−0.006 to +0.105) | +0.004 (−0.018 to +0.028) | — |
| 24 weeks | +0.036 (−0.026 to +0.100) | +0.007 (−0.022 to +0.037) | +0.001 (−0.036 to +0.037) |
| 32 weeks | +0.001 (−0.064 to +0.063) | +0.002 (−0.033 to +0.035) | +0.016 (−0.015 to +0.046) |
The kinetic terms changed the C-index by at most 0.016, and every interval included zero. One-year Brier score differences were similarly centered on zero. The reason is visible in the diagnostics: across patients, the kinetic terms correlated about 0.97 with the one-point terms. The mixed model largely restates the observed change, shrunk toward the population (slope shrinkage 0.24–0.35).
Calibration slopes were well below 1 for all models (0.25–0.46 for P and K), so even the best model's risk spread is overstated. This is expected with about 100 events and weak predictors, and it is another reason not to read small C-index differences as meaningful.
The next tumor measurement: the last value wins
| Landmark | Last value carried forward | Straight line from baseline | Linear mixed model | Quadratic mixed model |
|---|---|---|---|---|
| 16 weeks | 0.42 | 0.65 | 0.52 | — |
| 24 weeks | 0.50 | 0.85 | 0.78 | 0.63 |
| 32 weeks | 0.61 | 0.92 | 0.89 | 0.72 |
Values are mean absolute errors on the transformed scale. The mixed model beat a straight line drawn from baseline but was worse than carrying the last value forward, by 0.10 to 0.29 (all intervals excluded zero). Even the quadratic model remained worse than the last value, by 0.11 to 0.13.
The failure has a structural cause. Residuals from the linear model were curved in time (correlation with squared centered time 0.22–0.27 at 24 and 32 weeks), consistent with shrinkage that levels off or reverses. A trend fitted to the early decline extrapolates further decline that does not happen. Adding curvature reduced the error but did not overcome it. In these data, the most recent measurement is a better summary of the near future than any fitted trend.
Sensitivity
Excluding floor-censored measurements before the landmark, or retaining the excluded participant without the inconsistent measurement, did not change any conclusion: all kinetic-versus-one-point intervals included zero, and the last value remained the best next-measurement predictor.
What can and cannot be concluded
Supported: In this 150-patient subset, a population kinetic model did not add information beyond the observed one-point change, either for later survival or for the next tumor measurement, at any landmark from 16 to 32 weeks. At 16 weeks it could not have: most patients had one follow-up measurement. For early assessment with this measurement density, a simple change is sufficient, and a fitted trend can be worse than no trend.
Not supported: That mechanistic TGI models are uninformative in general (none was fitted); that the one-point change itself is a useful predictor (its improvement over clinical factors also included zero, as in the earlier analysis); or that these results transfer to other trials, tumor types or scan schedules (no external cohort was available).
What would change the answer: tumor sizes on the original scale, ideally per lesion; at least three measurements per patient before the landmark; and an independent validation cohort. With those, comparing minimal models that allow decline followed by regrowth would be a meaningful next step.
Reproduce
The companion contains the acquisition and export scripts, the analysis and independent validation code, aggregate result tables and figure code. It does not contain participant-level data: acquire.py downloads the source package from CRAN and checks its SHA-256, and export.R writes the two datasets locally. Run python acquire.py, Rscript export.R, python audit.py, Rscript analyze.R, python validate.py and python figures.py (R 4.5.1 with survival 3.8-3 and nlme 3.1-168; Python 3.12 with matplotlib). The seed is fixed; two runs gave identical results.
Sources
- Rondeau V, et al. frailtypack: general frailty models. CRAN package version 3.8.1, datasets
colorectalandcolorectalLongi. https://cran.r-project.org/package=frailtypack - Chiou SH, Xu G, Yan J, Huang CY. Regression modeling for recurrent events possibly with an informative terminal event using R package reReg. J Stat Softw. 2023;105(5). doi:10.18637/jss.v105.i05 (section 6 uses this FFCD 2000–05 subset)
- Ducreux M, et al. Sequential versus combination chemotherapy for the treatment of advanced colorectal cancer (FFCD 2000–05): an open-label, randomised, phase 3 trial. Lancet Oncol. 2011;12(11):1032–1044. doi:10.1016/S1470-2045(11)70199-1
- Pinheiro J, Bates D, R Core Team. nlme: linear and nonlinear mixed effects models. R package version 3.1-168.
- Therneau TM. survival: a package for survival analysis in R. R package version 3.8-3.
Download the companion: code, aggregate results and figure scripts